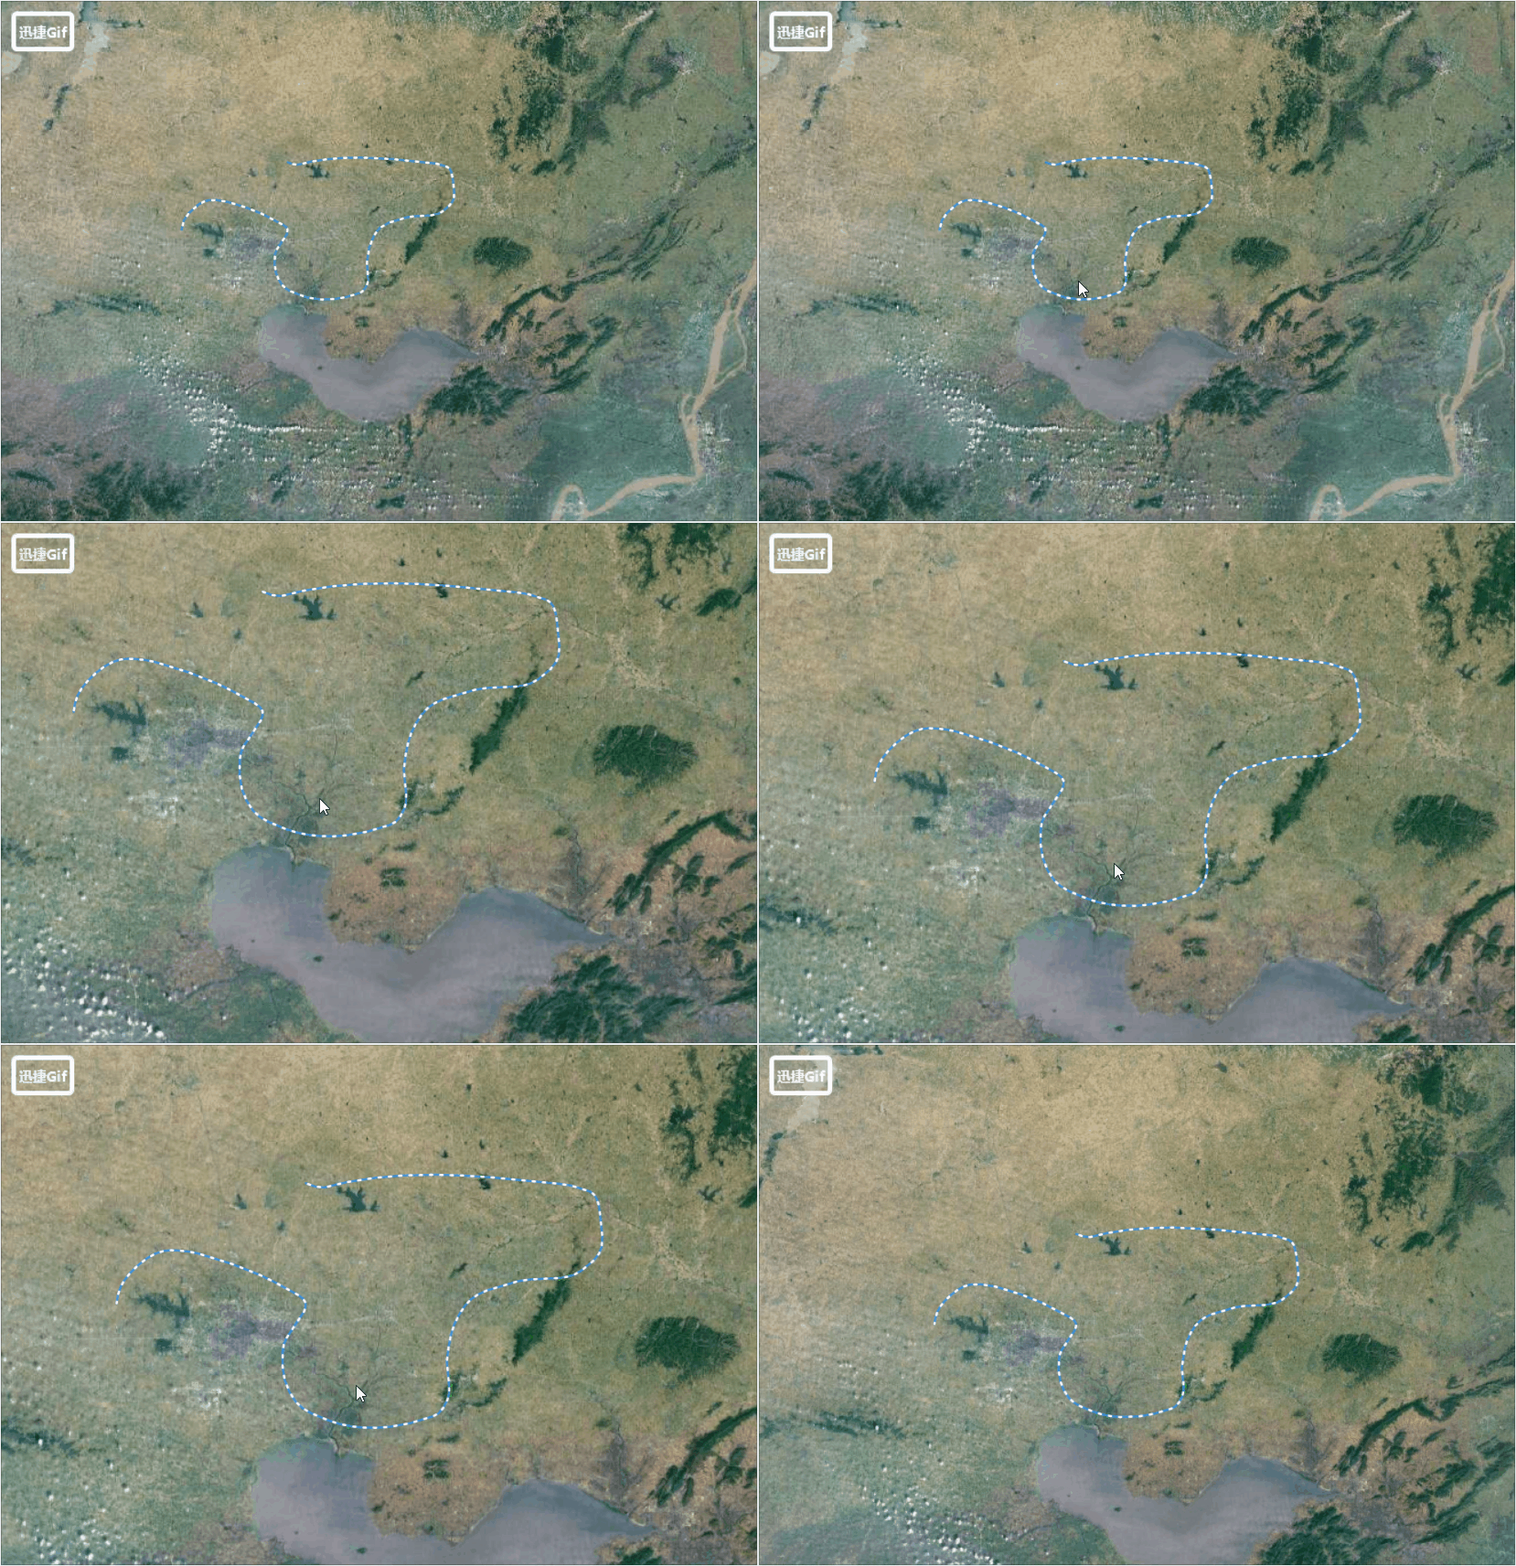
openlayers 好玩的效果之流动线
vue openlayers 流动线效果
·
老规矩先看效果图

使用的是vue + openlayers
思路:加载一个线的geojson 数据,实例化geojsonLayer 加载到地图上,拿到图层的features ,将feature 的style stroke 中的 lineDashoffset 定时改变即可
部分核心代码:(不好意思哈各位,只能上部分核心代码了,完整的vue 页面和示例数据,我放到资源中心去下载,最近囊中羞涩,积分严重不足,赚点积分)
geojsonLayer.getSource().on('featuresloadend',evt=>{
        geojsonLayer.getSource().getFeatures().forEach(item=>{
          setInterval(()=>{
            let style  =  item.getStyle();
            if(style == undefined){
              item.setStyle(
                [new Style({
                  stroke: new Stroke({
                    color: "rgba(30,144,255, 0.7)",
                    width: 2,
                  })
                }),
                  new Style({
                    stroke:new Stroke({
                      color: [255, 250, 250, 1],
                      width: 2,
                      lineDash: [20, 27],
                      lineDashOffset:0
                    })
                  })]
              )
            }else {
              let lineDashOffset = item.getStyle()[1].getStroke().getLineDashOffset();
              item.setStyle(
                [new Style({
                  stroke: new Stroke({
                    color: "rgba(30,144,255, 0.7)",
                    width: 2,
                  })
                }),
                  new Style({
                    stroke:new Stroke({
                      color: [255, 250, 250, 1],
                      width: 2,
                      lineDash: [2, 7],
                      lineDashOffset:lineDashOffset==8 ?0:lineDashOffset+1
                    })
                  })]
              )
            }
          },100)
        })
      })
其中拿取到的feature 是没有style 的,然后给他设置的style ,所以多判断了一个,如果你刚开始创建的feature 加载到图层就可以省略这个判断。
更多推荐
 已为社区贡献3条内容


所有评论(0)