prometheus2+springboot2+grafana5+k8s
实现的功能:使用prometheus监控部署在k8s中的springboot应用1.依赖搭建本文的内容是基于已经把springboot应用部署到了k8s中,并且系统已经安装好了prometheus和grafana。2.版本核对:这步有点坑,版本不对可能导致效果差距很大。本文章使用的版本:prometheus:2.0.0springboot:2.4.2k8s:1.8.1grafana:5....
实现的功能:
使用prometheus监控部署在k8s中的springboot应用
1.依赖搭建
本文的内容是基于已经把springboot应用部署到了k8s中,并且系统已经安装好了prometheus和grafana。
2.版本核对:
这步有点坑,版本不对可能导致效果差距很大。
本文章使用的版本:
prometheus:2.0.0
springboot:2.4.2
k8s:1.8.1
grafana:5.0.4
3.springboot项目改造:
3.1添加依赖:
<!-- Micrometer Prometheus registry -->

<!--监控系统健康情况的工具-->
<dependency>
   <groupId>org.springframework.boot</groupId>
   <artifactId>spring-boot-starter-actuator</artifactId>
</dependency>

<!--桥接Prometheus-->
<dependency>
   <groupId>io.micrometer</groupId>
   <artifactId>micrometer-registry-prometheus</artifactId>
   <version>1.6.0</version>
</dependency>

<!--micrometer核心包, 按需引入, 使用Meter注解或手动埋点时需要-->
<dependency>
   <groupId>io.micrometer</groupId>
   <artifactId>micrometer-core</artifactId>
   <version>1.6.0</version>
</dependency>
<!--micrometer获取JVM相关信息, 并展示在Grafana上-->
<dependency>
   <groupId>io.github.mweirauch</groupId>
   <artifactId>micrometer-jvm-extras</artifactId>
   <version>0.2.0</version>
</dependency>
3.2添加配置
#prometheus+grafana+springboot2监控集成配置
# metircs
management:
endpoints:
web:
exposure:
include: health,info,env,prometheus,metrics,httptrace,threaddump,heapdump
metrics:
export:
simple:
enabled: false
tags:
application: ${spring.application.name}
3.3启动应用测试
浏览访问:http://ip:port/actuator/prometheus
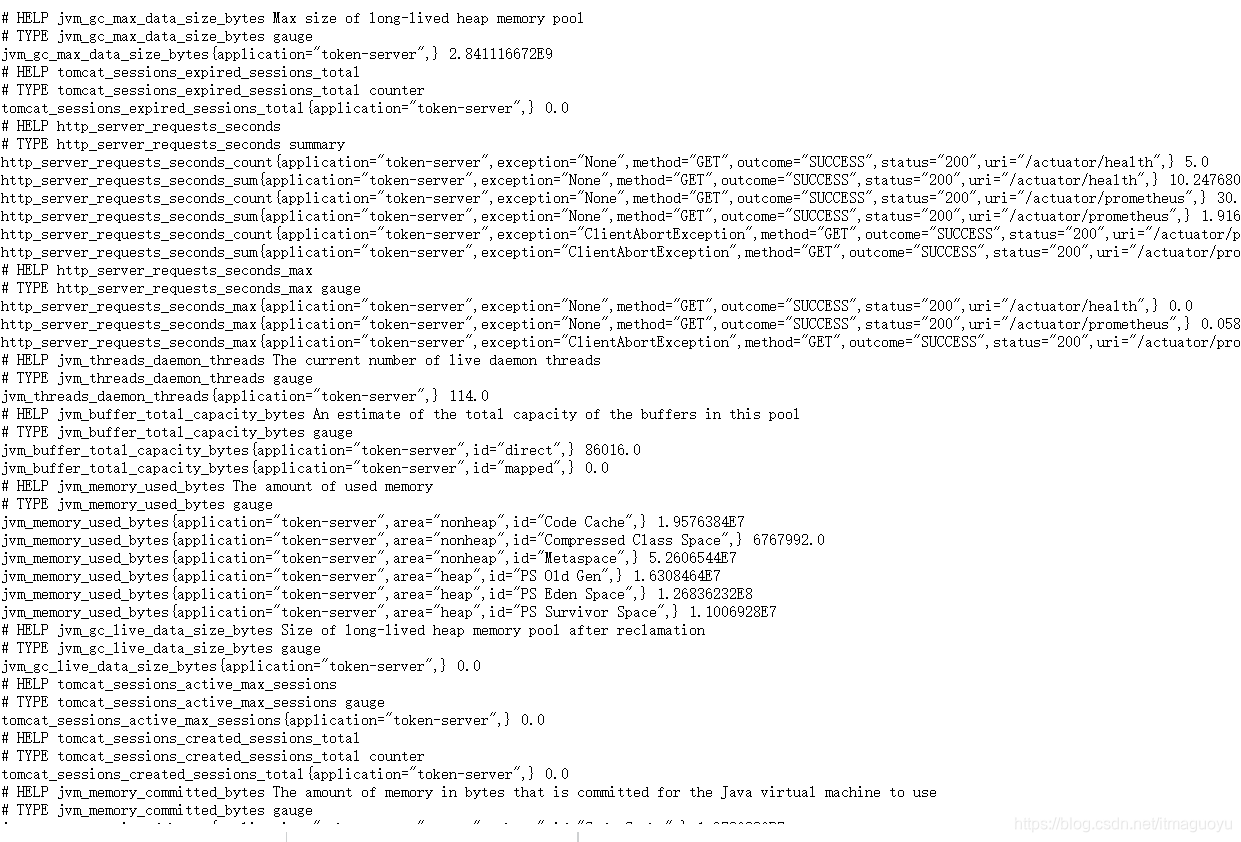
返回监控内容表示项目改造完成。
4.修改k8s的service配置,并重新部署svc,配置如下:
apiVersion: v1
kind: Service
metadata:
annotations:
prometheus.io/port: "27000"
prometheus.io/spring: "true"
prometheus.io/path: "/actuator/prometheus"
5.修改prometheus.yml配置,增加job
- job_name: 'spring metrics'
kubernetes_sd_configskubernetes_sd_configs:
- role: endpoints
relabel_configs:
- source_labels: [__meta_kubernetes_service_annotation_prometheus_io_spring]
action: keep
regex: true
- source_labels: [__meta_kubernetes_service_annotation_prometheus_io_path]
action: replace
target_label: __metrics_path__
regex: (.+)
- source_labels: [__address__, __meta_kubernetes_service_annotation_prometheus_io_port]
action: replace
target_label: __address__
regex: ([^:]+)(?::\d+)?;(\d+)
replacement: $1:$2
- action: labelmap
regex: __meta_kubernetes_service_label_(.+)
- source_labels: [__meta_kubernetes_namespace]
action: replace
target_label: spring_namespace
- source_labels: [__meta_kubernetes_service_name]
action: replace
target_label: spring_name
6.查看prometheus服务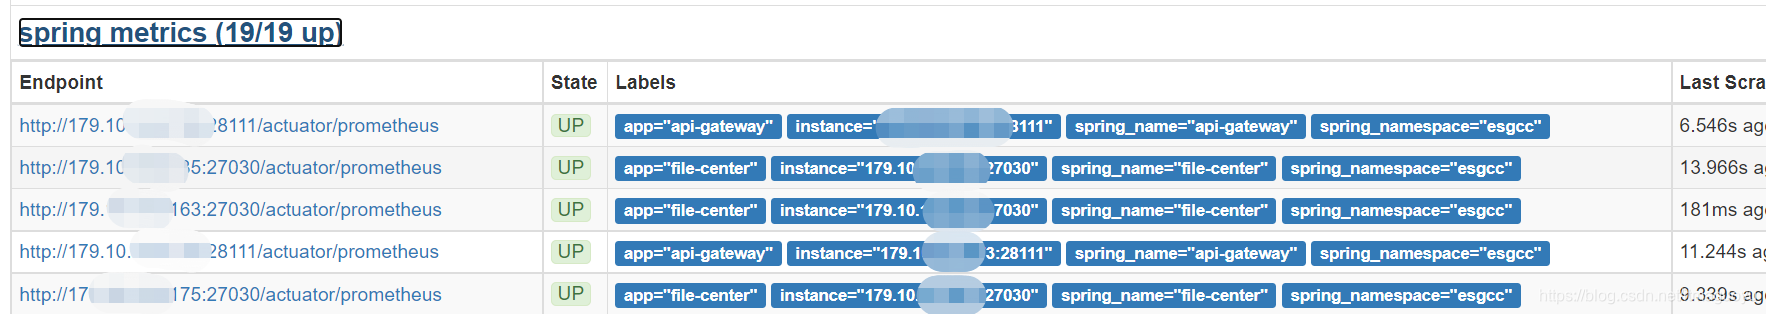
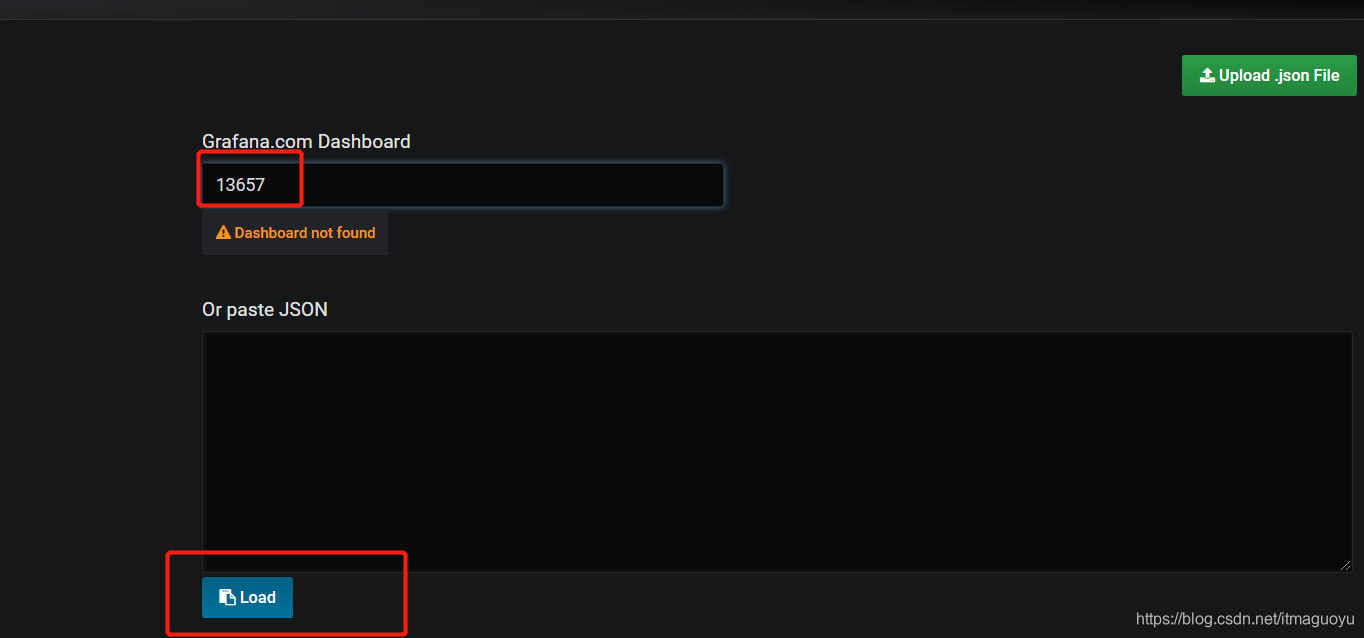
7.grafana上新建大屏,对应的dashboard已经上传到grafana,import编号为13657的即可。
效果如下:
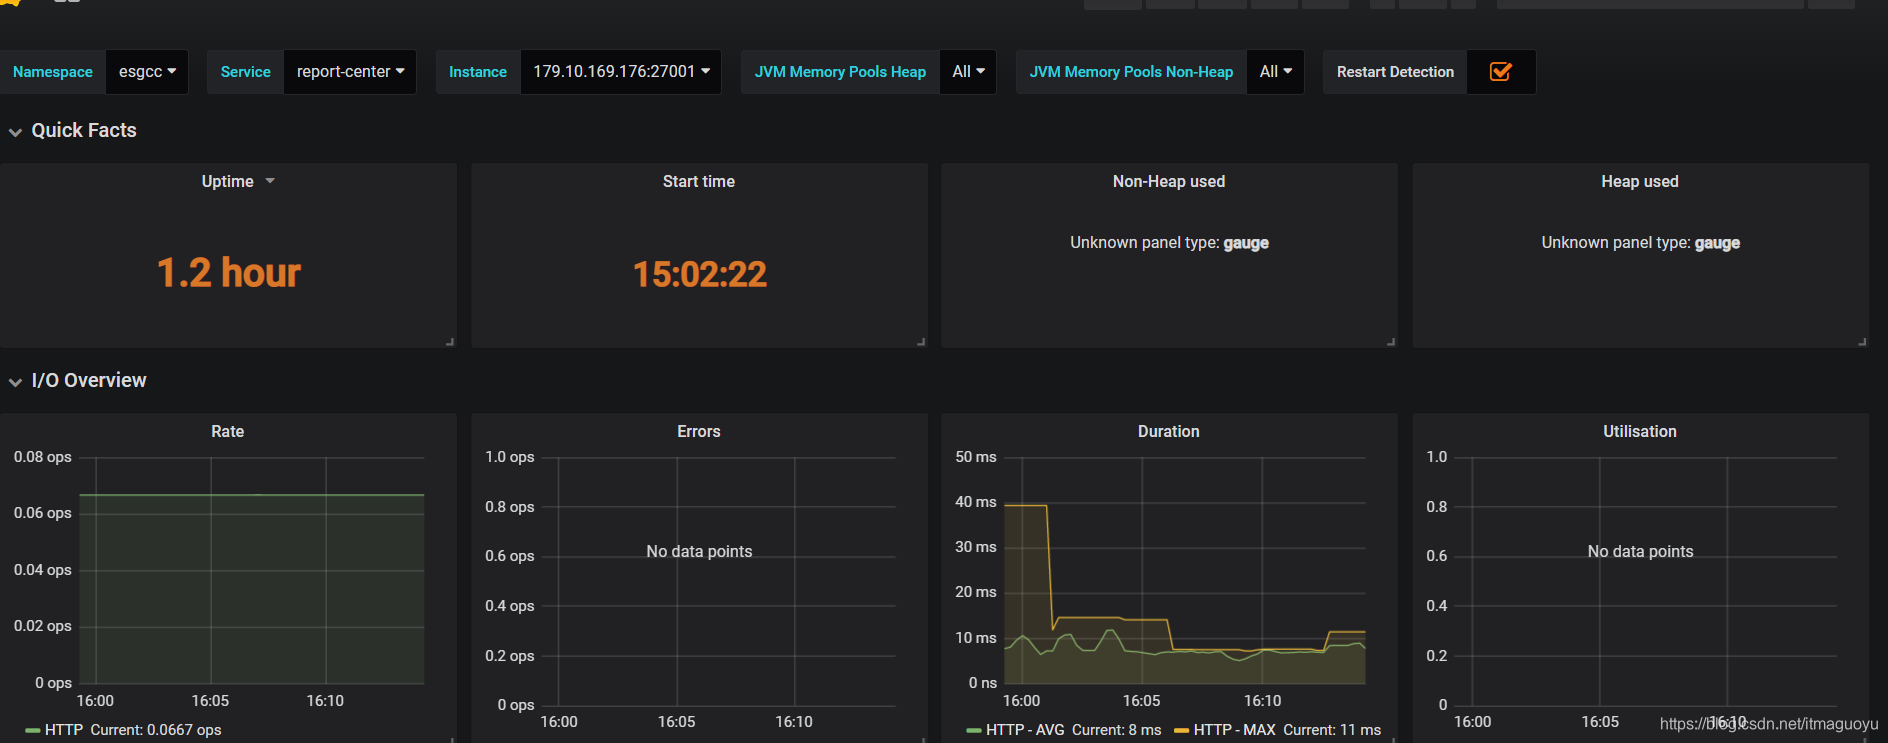
搞定

K8S/Kubernetes社区为您提供最前沿的新闻资讯和知识内容
更多推荐


 1
1 0
0- 0


 已为社区贡献1条内容

所有评论(0)