使用开源软件Prometheus监控企业内部应用
使用开源软件Prometheus监控企业内部资源1. 写在前面在电厂行政管理大区内,因为业务体量小,业务变化相对少,之前公司采用的监控技术栈较为落后,只有简单的北塔网络监控,基本没有任何的监控平台。接触Docker和kubernetes时间久了,开源的监控方案所接触。网上也有不少Zabbix、Nagios、Open-Falcon、Prometheus、Influxdb的对比这里就不一一列举了。
使用开源软件Prometheus监控企业内部资源
1. 写在前面
在公司行政管理大区内,因为业务体量小,业务变化相对少,之前公司采用的监控技术栈较为落后,只有简单的北塔网络监控,基本没有任何的监控平台。
接触Docker和kubernetes时间久了,开源的监控方案所接触。网上也有不少Zabbix、Nagios、Open-Falcon、Prometheus、Influxdb的对比这里就不一一列举了。最终公司选择Prometheus+Grafana+explorer技术栈作为企业内部IT资源监控,Prometheus各类型采集器丰富,Grafana仪表板颜值高,基于Docker-compose部署方便,该项目自2018年实施已稳定运行三年,极大缩短了故障排查时间。
2. 监控资源分析
内部需要监控的资源有
- 网络资源:如交换机SNMP、交换机各端口流量
- Windows资源:Windows服务器运行时间、CPU使用率、内存使用率、磁盘使用率、磁盘IO、进程数、服务数、网络带宽情况等
- Linux资源:Linux服务器运行时间、CPU使用率、打开文件描述符、上下文切换次数、内存使用率、磁盘使用率、磁盘IO、网络带宽情况等
- Docker资源:各容器CPU使用率、内存使用率、网络带宽情况、磁盘io等
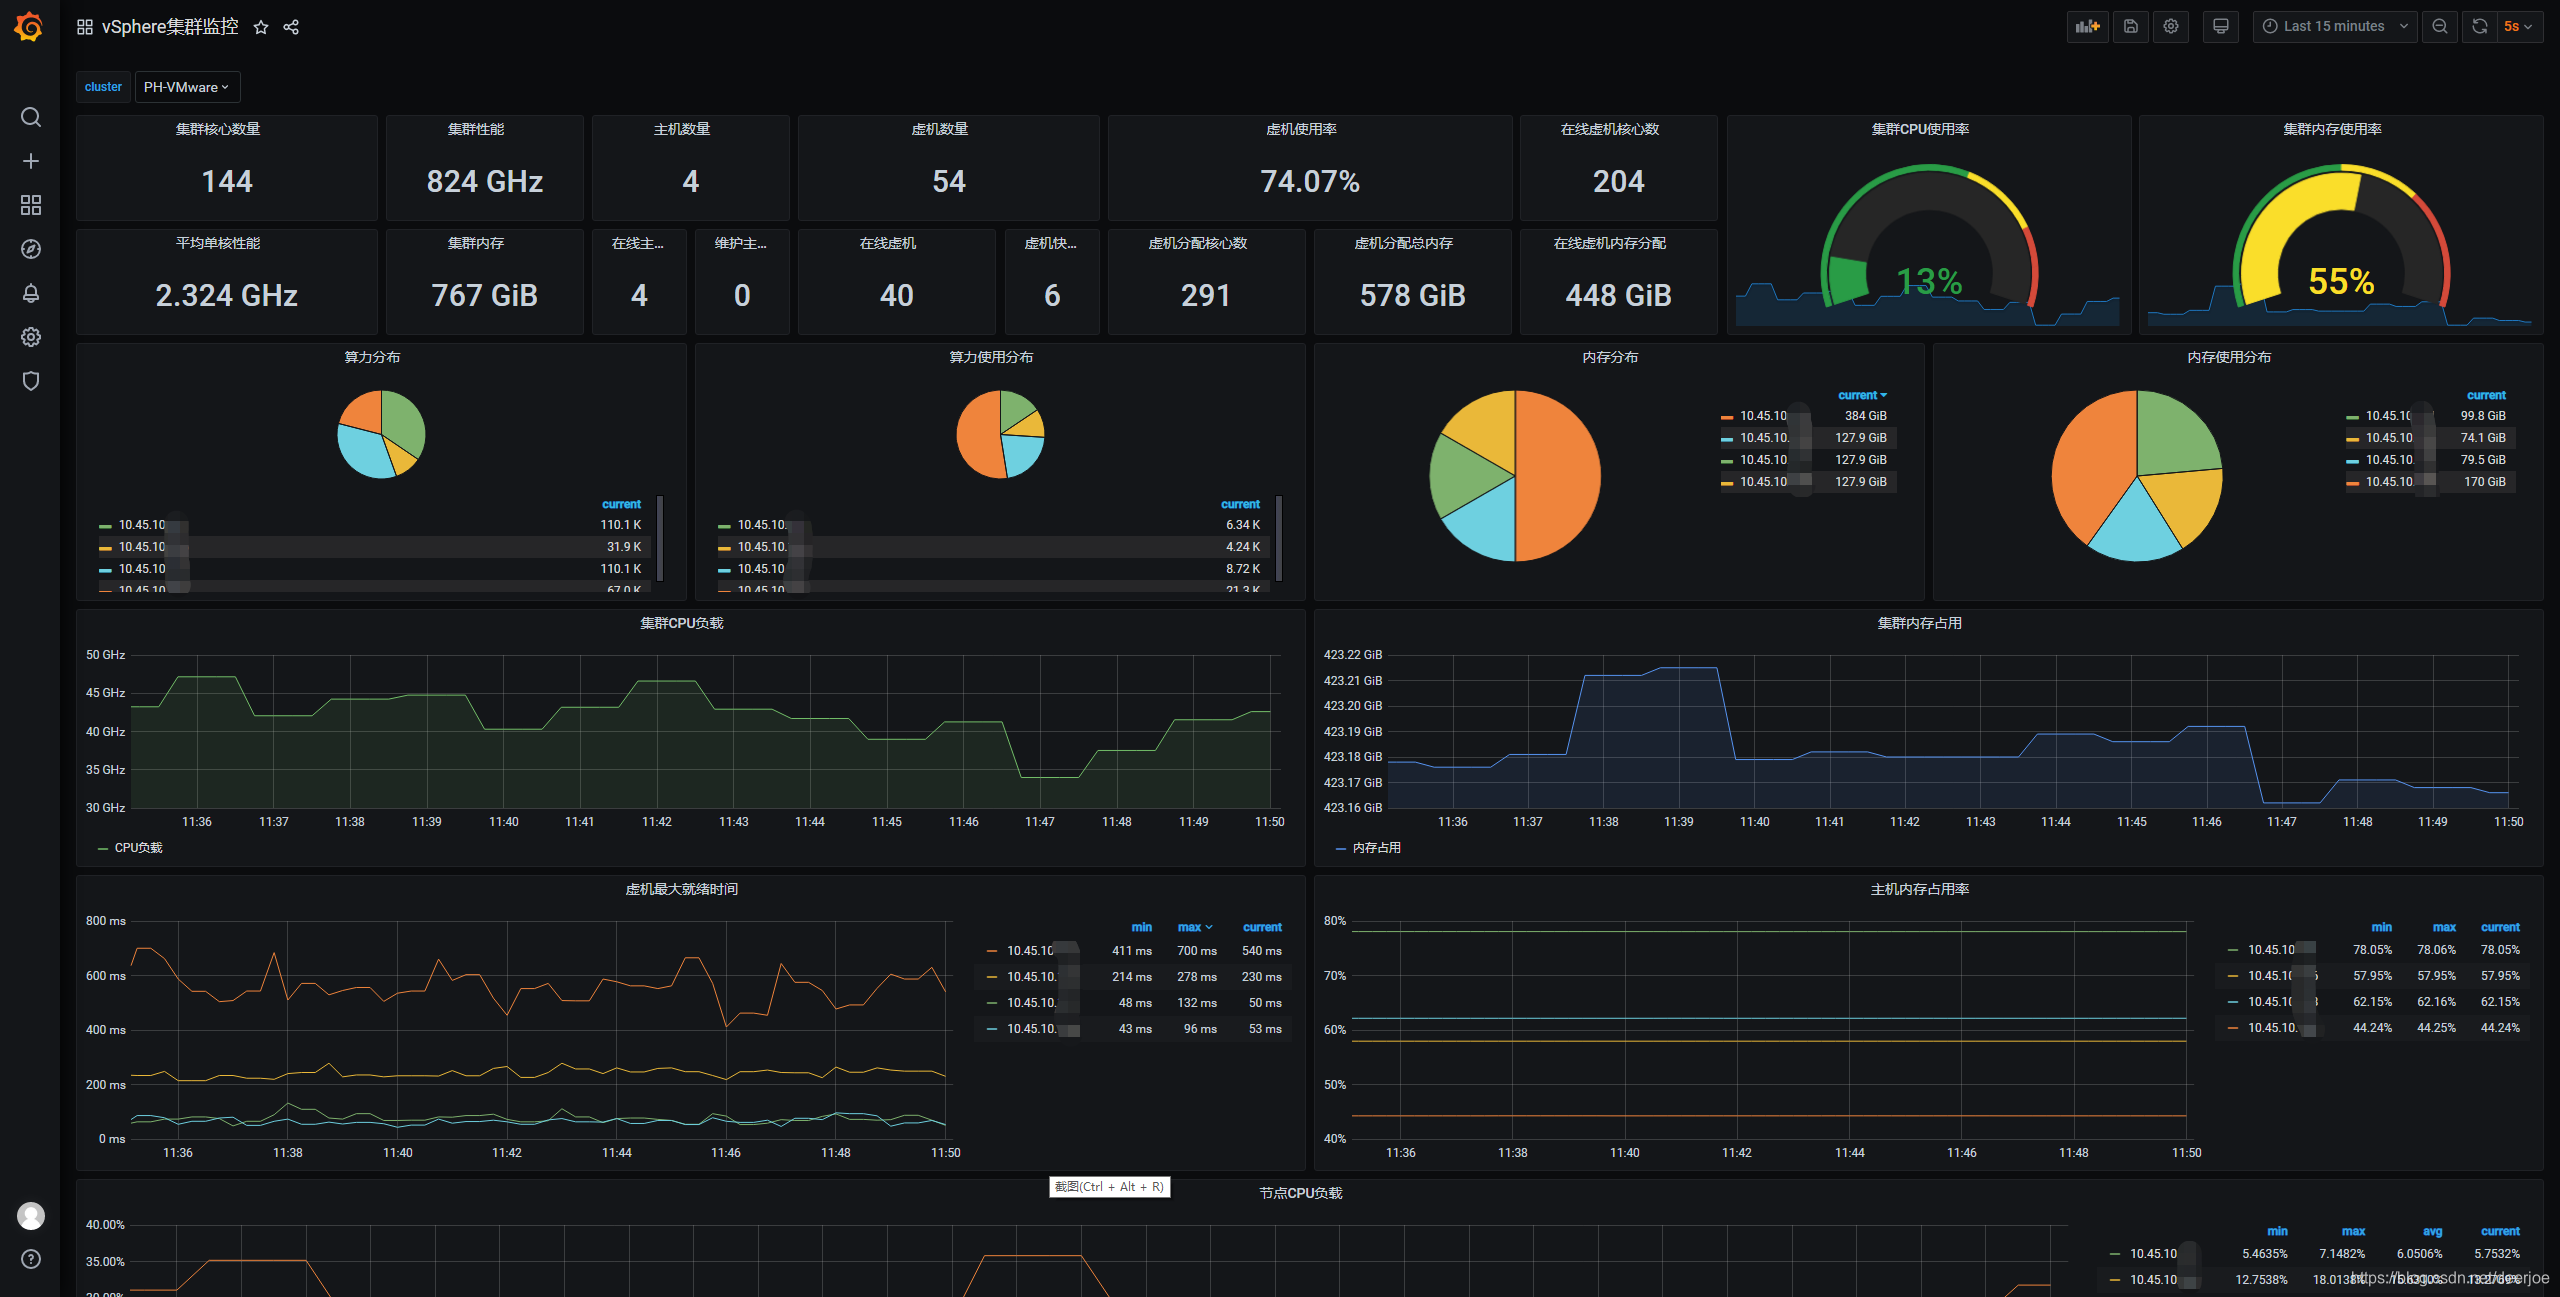
- vSphere资源:vSphere物理节点内存、CPU、虚拟机、网络情况,各虚拟机CPU使用率、CPU就绪时间、网络封包、磁盘IO等。
- Oracle数据库性能情况:数据库状态、执行统计、用户提交/回滚数量、进程数量、表空间使用情况、IO、资源利用率等。
- JVM监控:Java版本、运行时间、加载类总数、线程数量、线程峰值、死锁线程数量、gc次数等
- 存储资源监控:Ceph OSD状态等
- 其他类型监控:连通类监控如端口、HTTP,SSL证书状态监控等
根据监控资源在GitHub以及Prometheus官网内收集推荐的exporter,总结如下:
| 监控资源 | exporter名称 | 部署方式 | 项目地址 |
|---|---|---|---|
| SNMP | snmp_exporter | 代理部署 | https://github.com/prometheus/snmp_exporter |
| Windows | windows_exporter | 实例部署 | https://github.com/prometheus-community/windows_exporter |
| Linux | node_exporter | 实例部署 | https://github.com/prometheus/node_exporter |
| Docker | cadvisor | 实例部署 | https://github.com/google/cadvisor/releases/latest |
| vSphere | vmware_exporter | 代理部署 | https://github.com/pryorda/vmware_exporter |
| Oracle | oracledb_exporter | 实例部署 | https://github.com/iamseth/oracledb_exporter |
| JVM | jmx_exporter | 实例部署 | https://github.com/prometheus/jmx_exporter |
| Ceph | ceph_mgr | 实例自带 | |
| 其他 | Blackbox_exporter | 代理部署 | https://github.com/prometheus/blackbox_exporter |
这是官网上收录的exporter:https://prometheus.io/docs/instrumenting/exporters/
也可以在GitHub上搜,比如Proxmox就没有收录在官方文档内。
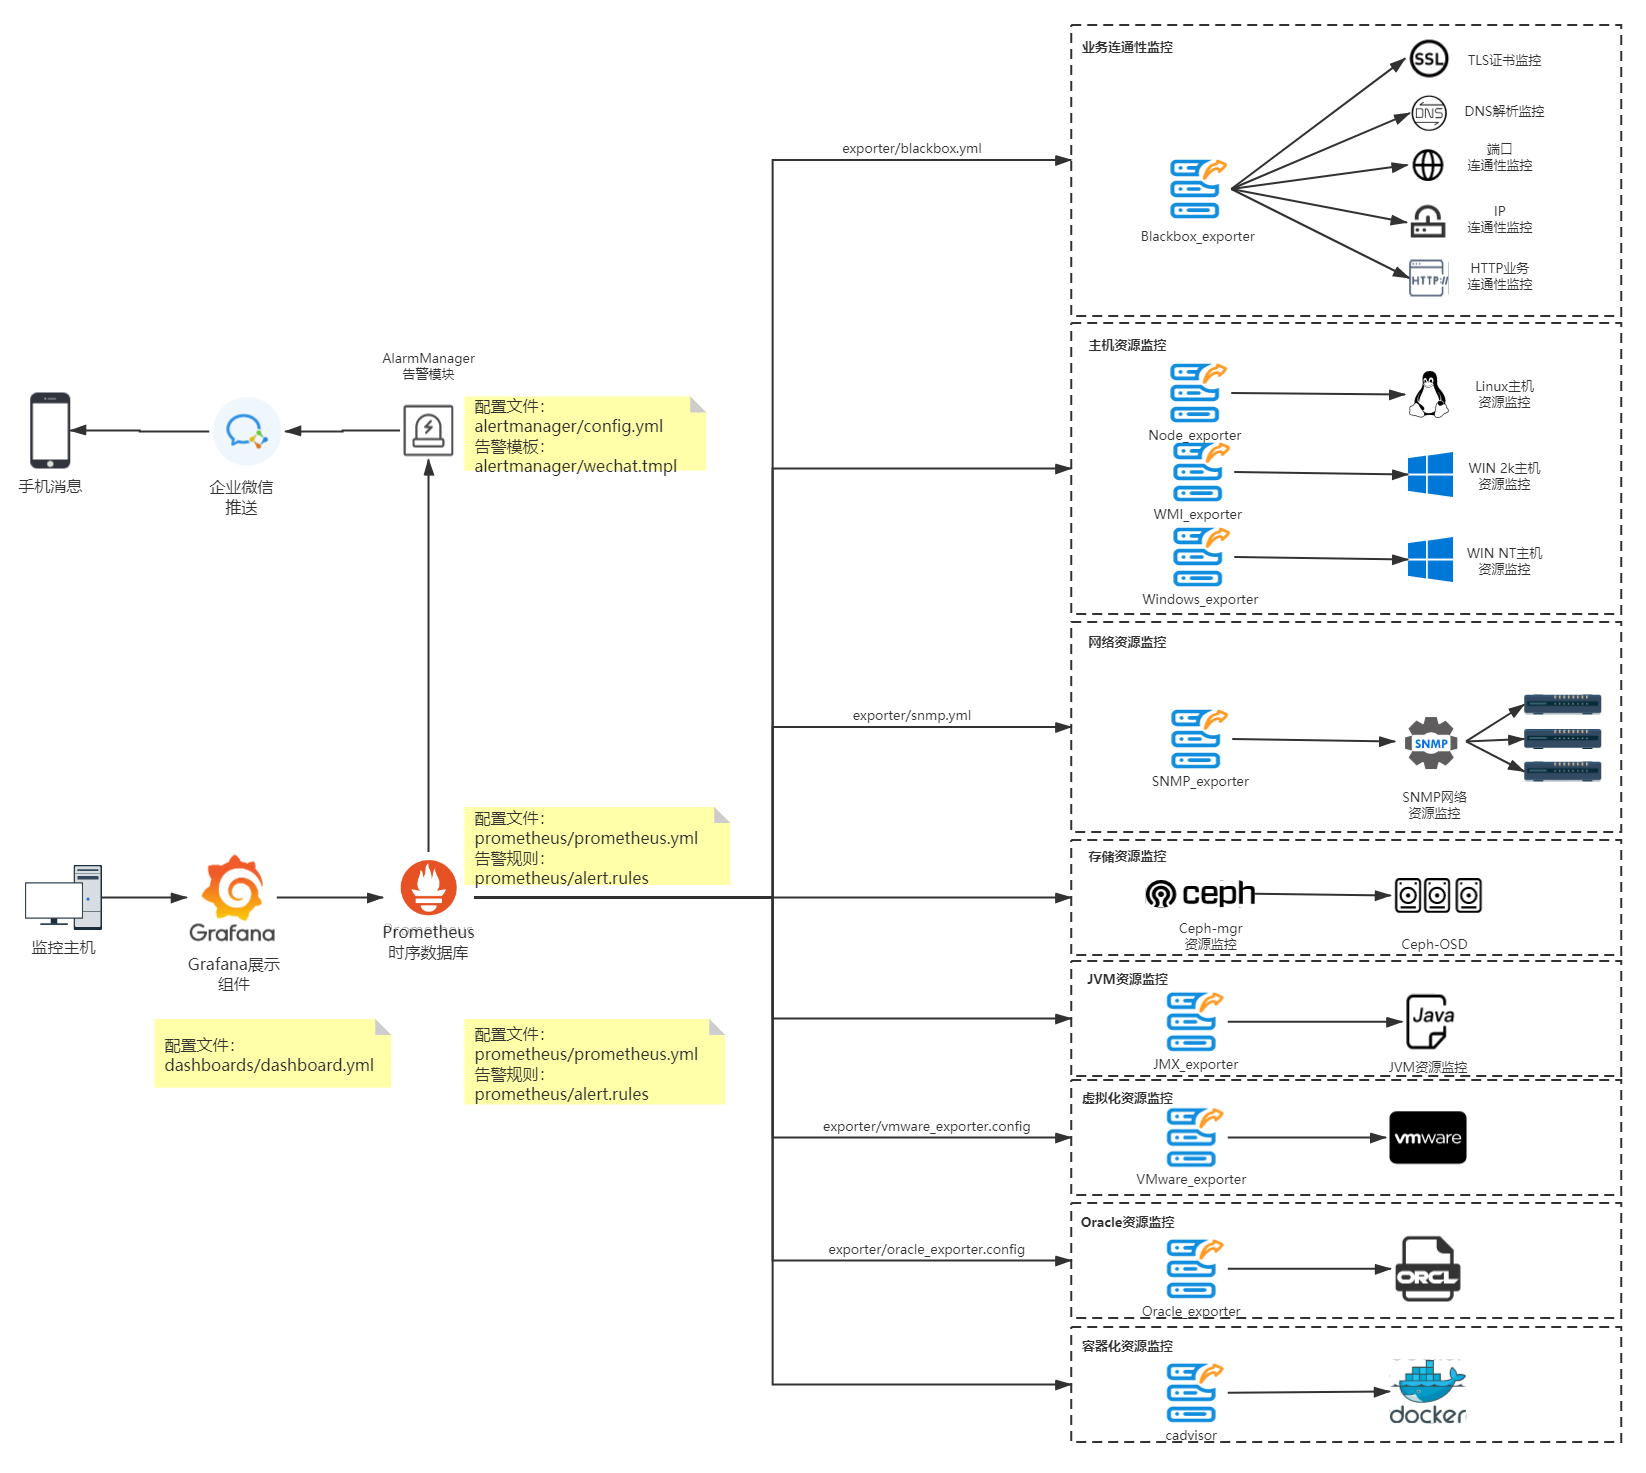
3. 整体架构及实施效果
本次采用Docker-Compose的方式搭建部署,参照Github上的https://github.com/vegasbrianc/prometheus.git进行二次开发。
拓扑如下:

目录结构如下:
.
├── alertmanager                              #alertmanager 告警模块
│   ├── config.yml                              #alertmanager 配置文件
│   └── wechat.tmpl                             #alertmanager weChat通知配置
├── CODE_OF_CONDUCT.md
├── CONTRIBUTING.md
├── dashboards                                #Grafana默认Dashboard
│   ├── Grafana_Dashboard.json
│   ├── Grafana_Dashboard_prom_2.json
│   └── System_Monitoring.json
├── docker-compose.yml                        #主要Docker-compose文件
├── docker-prometheus.dockerapp
│   └── docker-compose.yml
├── docker-stack.yml
├── docker-traefik-stack.yml
├── exporter                                  #explorer 模块
│   ├── blackbox.yml                           #blackbox_exporter配置文件
│   ├── oracle_exporter.config                 #oracle_exporter配置文件
│   ├── snmp.yml                               #snmp_exporter配置文件
│   └── vmware_exporter.config                 #vmware_exporter配置文件
├── grafana                                   #Grafana 模块
│   ├── config.monitoring                      #Grafana 配置文件夹
│   └── provisioning
│       ├── dashboards
│       │   ├── dashboard.yml
│       │   └── Docker Prometheus Monitoring-1571332751387.json
│       └── datasources
│           └── datasource.yml
├── Grafana_Dashboard.json
├── Grafana Dashboard With Service.json
├── HighLoadDashboard.json
├── images
│   ├── Add_Data_Source.png
│   ├── Dashboard.png
│   ├── Import_Dashboard.png
│   └── mac-filesystem.png
├── ISSUE_TEMPLATE.md
├── LICENSE
├── m3db
├── prometheus                               #prometheus 模块
│   ├── alert.rules                           #prometheus 告警配置
│   └── prometheus.yml                        #prometheus 配置
├── pwd-stack.yml
└── README.md
我们主要关注prometheus、alertmanager、explorer、Grafana的配置以及docker-compose.yml 即可。在配置完成后,最终项目实施效果如下:
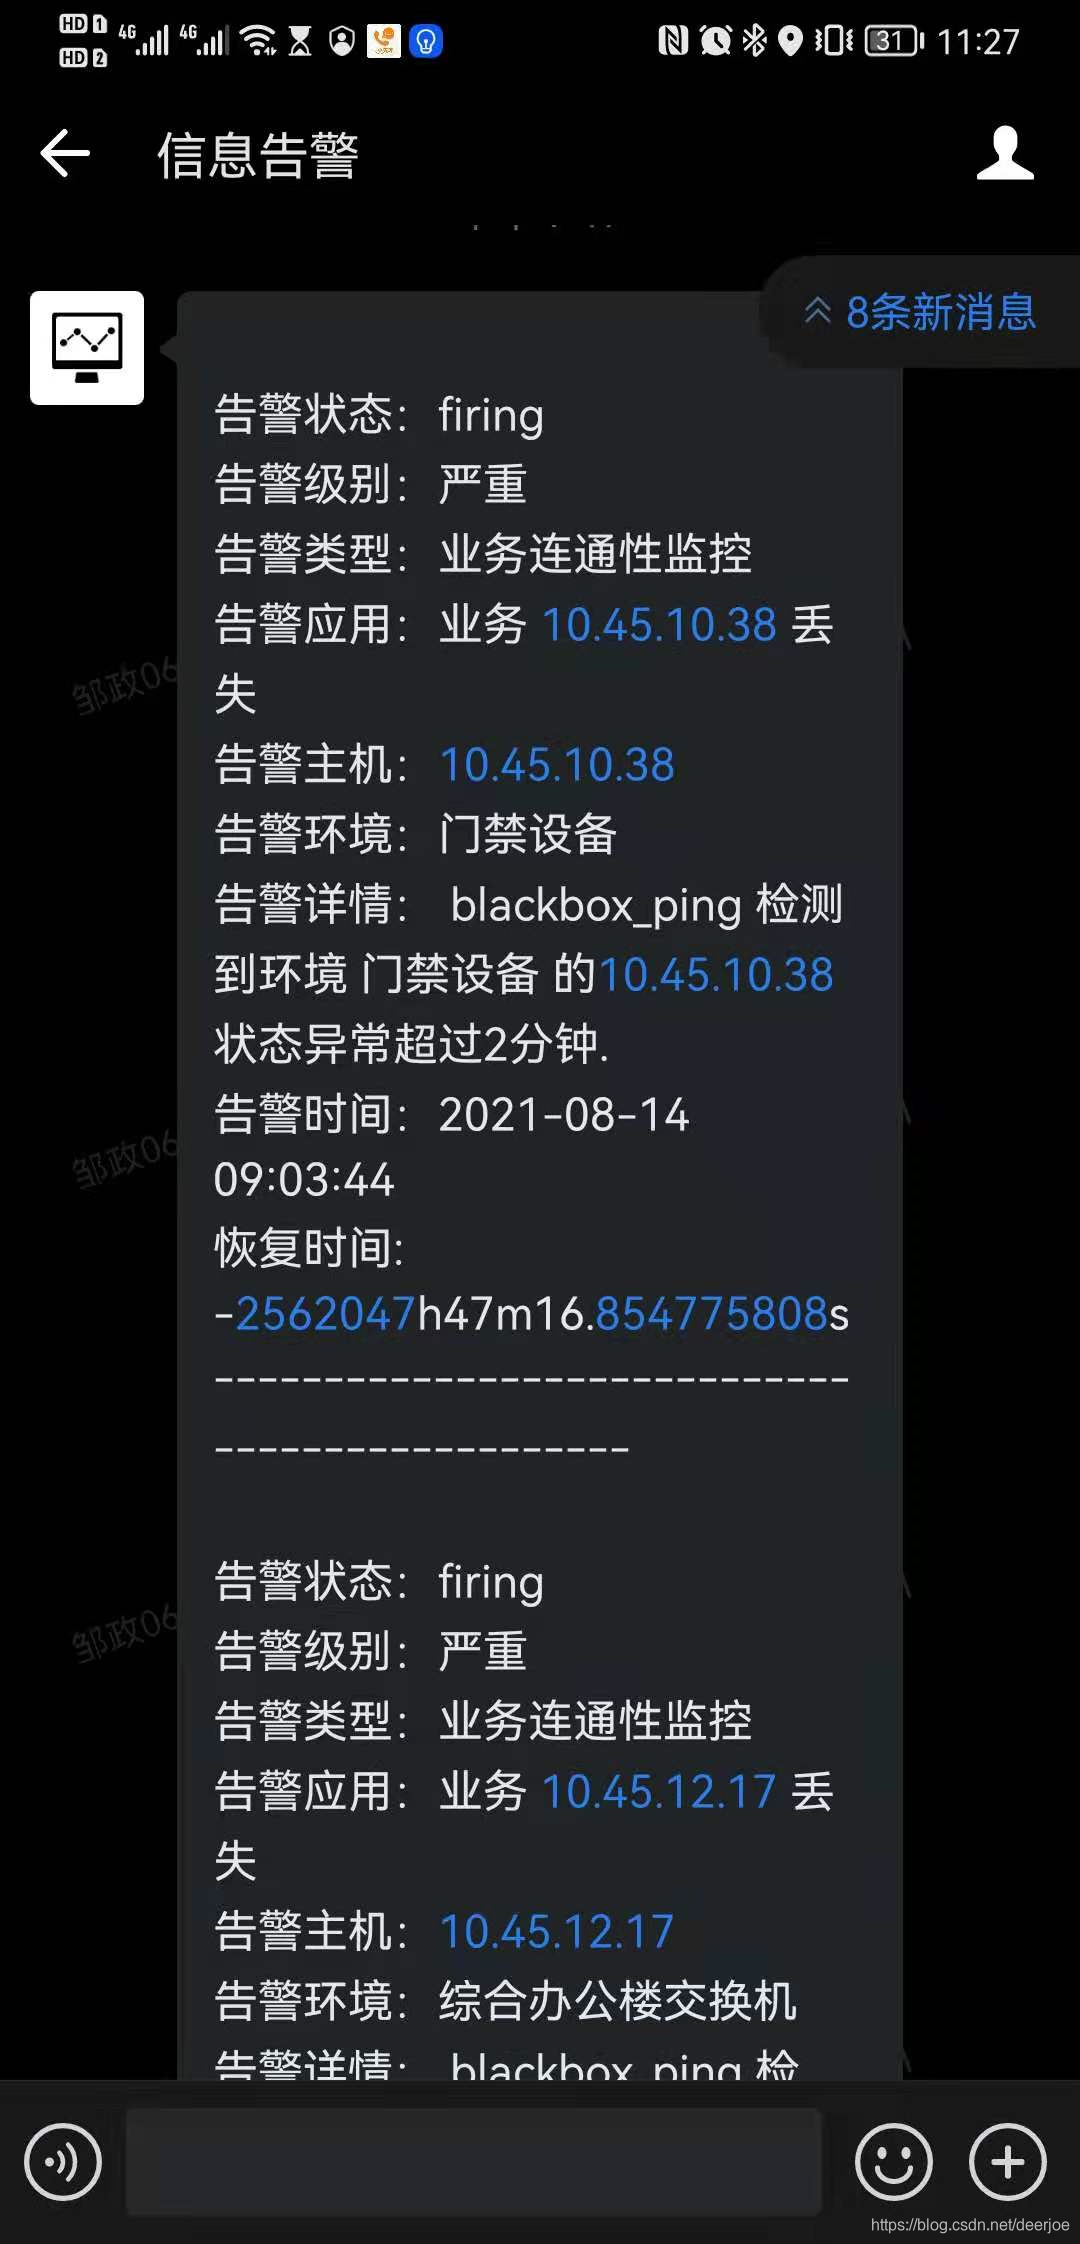
企业微信告警:
监控大屏:
4. Docker-compose配置解析
Docker-compose 可以参照https://github.com/vegasbrianc/prometheus.git上的docker-compose.yml进行修改
该docker-compose主要配置prometheus服务、alertmanager服务、Grafana服务以及需要代理部署的exporter。
prometheus服务:
注:可在docker-compose中配置命令行参数 --storage.tsdb.retention,时间不建议配太长,容易造成磁盘IO高
通过ip:9090端口访问
version: '3.7'

volumes:
    prometheus_data: {}
    grafana_data: {}

networks:
  front-tier:
  back-tier:

services:
  prometheus:
    image: prom/prometheus:v2.1.0
    volumes:
      - ./prometheus/:/etc/prometheus/
      - prometheus_data:/prometheus
    command:
      - '--config.file=/etc/prometheus/prometheus.yml'                     #定义prometheus配置文件在容器内的地址
      - '--storage.tsdb.path=/prometheus'                                  #定义prometheus数据在容器内的地址
      - '--storage.tsdb.retention=30d'                                     #定义prometheus保存周期
      - '--web.console.libraries=/usr/share/prometheus/console_libraries'
      - '--web.console.templates=/usr/share/prometheus/consoles'

    ports:
      - 9090:9090
    links:
      - cadvisor:cadvisor
      - alertmanager:alertmanager
#      - m3db:m3db
    depends_on:
      - cadvisor
#      - m3db:m3db
    networks:
      - back-tier
    restart: always
#  m3db:                                       预留m3db作为后端持久化存储
#    image: quay.io/m3db/m3dbnode:latest
#    volumes:
#      - ./m3db/:/var/lib/m3db
#    ports:
#      - 7201:7201
#      - 7203:7203
#      - 9003:9003
#    networks:
#      - back-tier
#    restart: always
#    deploy:
#      mode: global

...
alertmanager服务
通过ip:9093端口访问
...
  alertmanager:
    image: prom/alertmanager
    ports:
      - 9093:9093
    volumes:
      - ./alertmanager/:/etc/alertmanager/
    networks:
      - back-tier
    restart: always
    command:
      - '--config.file=/etc/alertmanager/config.yml'
      - '--storage.path=/alertmanager'

...
grafana服务
通过ip:3000端口访问
...
grafana:
    image: grafana/grafana
    user: "472"
    depends_on:
      - prometheus
    ports:
      - 3000:3000
    volumes:
      - grafana_data:/var/lib/grafana
      - ./grafana/provisioning/:/etc/grafana/provisioning/
    env_file:
      - ./grafana/config.monitoring
    networks:
      - back-tier
      - front-tier
    restart: always
5. Prometheus及Exporter配置
根据Exporter性质,代理部署的Exporter可直接配置在Docker-compose.yml,与prometheus同一个主机,实例部署需要每个实例上部署单独的Exporter。
建议每个Exporter都用Docker-compose进行纳管。
5.1 Prometheus 配置解析
Prometheus 配置位于/prometheus/prometheus.yml 下,主要配置参数可以参考https://prometheus.io/docs/prometheus/latest/configuration/configuration/
5.1.1 配置文件指标说明
- global: 全局配置(如果有内部单独设定,会覆盖这个参数)
- alerting: 告警插件定义。这里会设定alertmanager这个报警插件。
- rule_files: 告警规则。 按照设定参数进行扫描加载,用于自定义报警规则,其报警媒介和route路由由alertmanager插件实现。
- scrape_configs:采集配置。配置数据源,包含分组job_name以及具体target。采集配置又分为静态配置和服务发现
原始配置文件内容:
# 全局配置
global:
  scrape_interval:     15s #  默认全局每次数据收集的间隔为15s.
  evaluation_interval: 15s #  规则扫描时间间隔是15秒,默认不填写是 1分钟
  # scrape_timeout: 10s    #默认收集超时时间为10s

# 告警配置
alerting:
  alertmanagers:
  - scheme: http
    static_configs:
    - targets:
      - alertmanager:9093 # 告警配置目标设置应与docker-compose中的alertmanager service名称相同

#告警规则加载
rule_files:
  - 'alert.rules'
  # - "second_rules.yml"

# 采集配置(静态)
scrape_configs:
  - job_name: 'prometheus'            #独立部署配置
    static_configs:
    - targets:
      - localhost:9090

  - job_name: '其他区域交换机'              #代理部署配置需要配上,relabel_configs
    metrics_path: /snmp                   #metrics_path指的是exporter访问路径
    params:                               #exporter访问参数
      module: [if_mib]
    static_configs:
      - targets:
        - **.**.**.**
    relabel_configs:
      - source_labels: [__address__]
        target_label: __param_target
      - source_labels: [__param_target]
        target_label: instance
      - target_label: __address__
        replacement: **.**.**.**:9116  # 替换参数名称
#通过配置file服务发现 获取target 'test'
file_sd_configs:
    - files:
      - /etc/prometheus/file_config/host.json
5.1 node_exporter 配置
5.1.1 实例部署
node_exporter采用go语言开发,专门用来收集*NIX系统中硬件、系统指标。需要在每个实例主机上部署Docker-compose.yml如下:
version: '3.7'

services:
  node_exporter:
    image: prom/node_exporter
    volumes:
      - /proc:/host/proc:ro
      - /sys:/host/sys:ro
      - /:/rootfs:ro
    command:
      - '--path.procfs=/host/proc'
      - '--path.sysfs=/host/sys'
      - '--collector.filesystem.ignored-mount-points'
      - "^/(sys|proc|dev|host|etc|rootfs/var/lib/docker/containers|rootfs/var/lib/docker/overlay2|rootfs/run/docker/netns|rootfs/var/lib/docker/aufs)($$|/)"
    ports:
      - 9100:9100
    restart: always
可见,node_exporter默认开放端口为9100,运行后访问http://ip:9100/metrics,能够成功返回数据即可
配置参考:
–collector.diskstats.ignored-devices="^(ram|loop|fd|(h|s|v|xv)d[a-z]|nvme\d+n\d+p)\d+$"
#通过正则表达式忽略某些磁盘的信息收集–collector.filesystem.ignored-mount-points="^/(dev|proc|sys|var/lib/docker/.+)($|/)"
#通过正则表达式忽略某些文件系统挂载点的信息收集–collector.filesystem.ignored-fs-types="^(autofs|binfmt_misc|bpf|cgroup2?|configfs|debugfs|devpts|devtmpfs|fusectl|hugetlbfs|mqueue|nsfs|overlay|proc|procfs|pstore|rpc_pipefs|securityfs|selinuxfs|squashfs|sysfs|tracefs)$"
#通过正则表达式忽略某些文件系统类型的信息收集–collector.netclass.ignored-devices="^$"
#通过正则表达式忽略某些网络类的信息收集–collector.netdev.ignored-devices="^$"
#通过正则表达式忽略某些网络设备的信息收集–collector.netstat.fields="^$"
#通过正则表达式配置需要获取的网络状态信息–collector.vmstat.fields="^(oom_kill|pgpg|pswp|pg.fault)."
#通过正则表达式配置vmstat返回信息中需要收集的选项
5.1.2 采集配置
在prometheus.yml中添加Job,targets指向已运行node-expoter的主机
  - job_name: 'linux-node'
    static_configs:
      - targets:
        - 10.**.**.**:9100
        - 10.**.**.**:9100
  # 采集node exporter监控数据
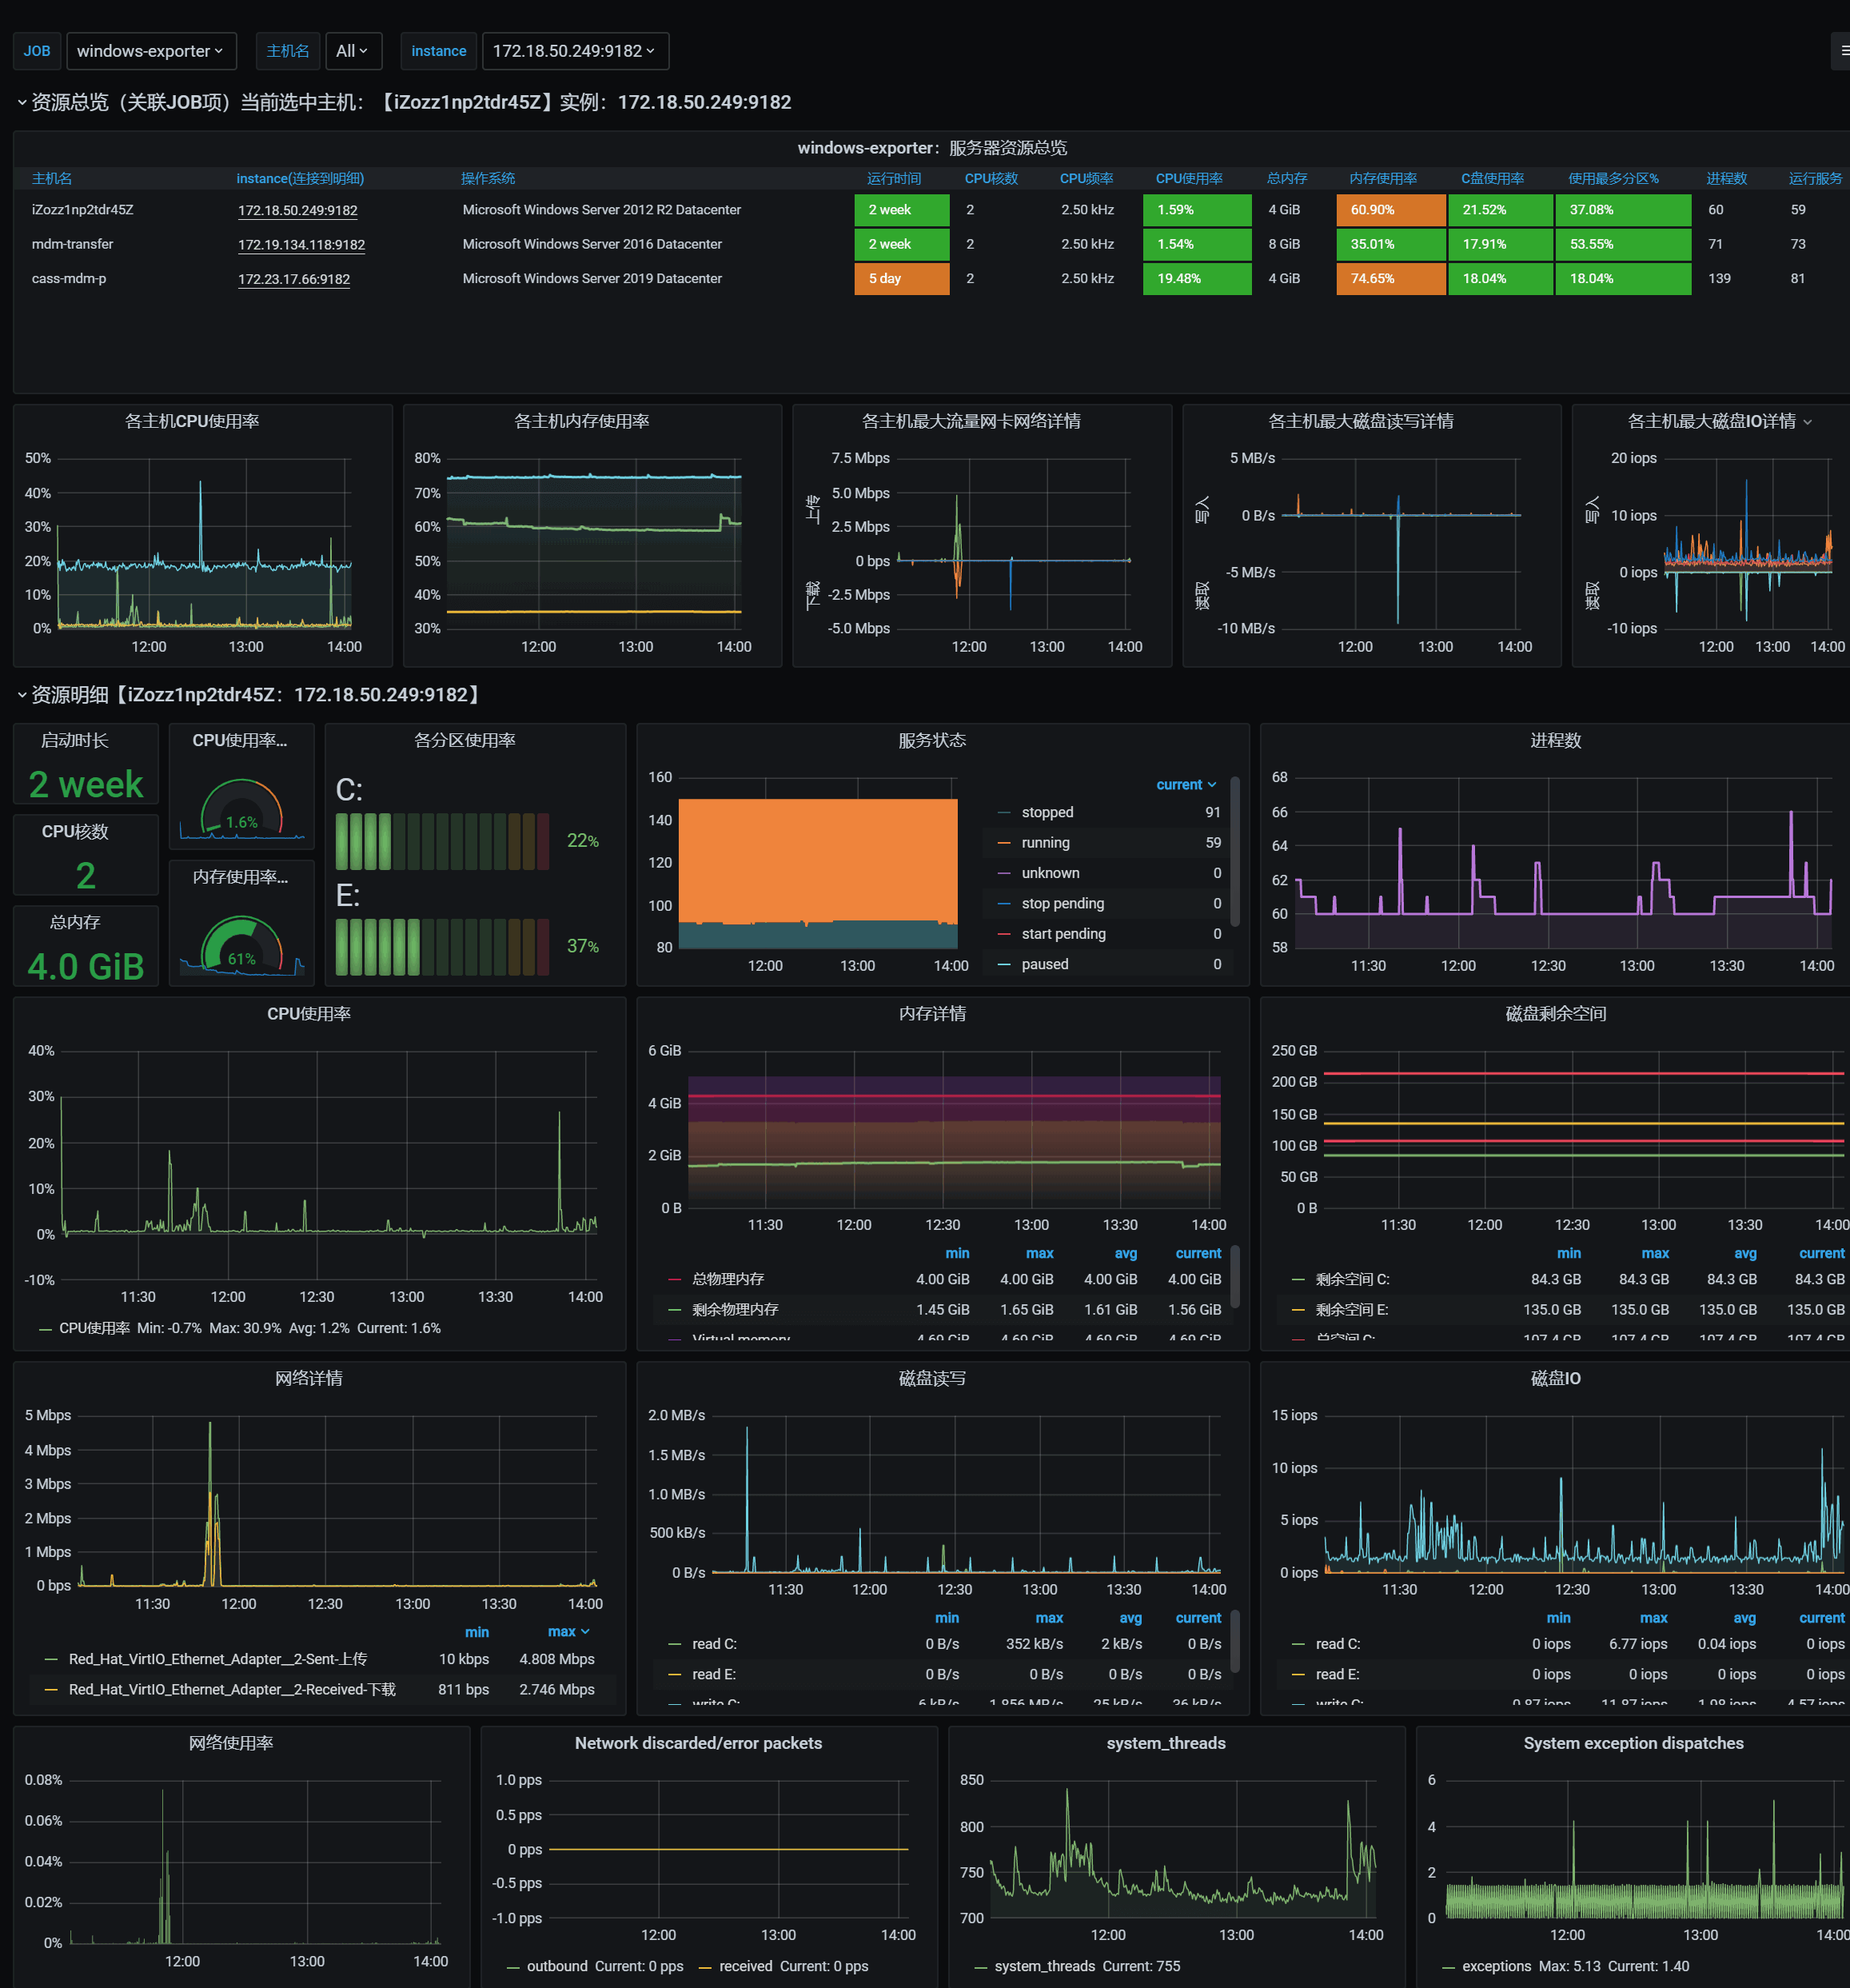
5.1.3 仪表板配置
1 Node Exporter for Prometheus Dashboard CN v20201010 by StarsL.cnhttps://grafana.com/grafana/dashboards/8919
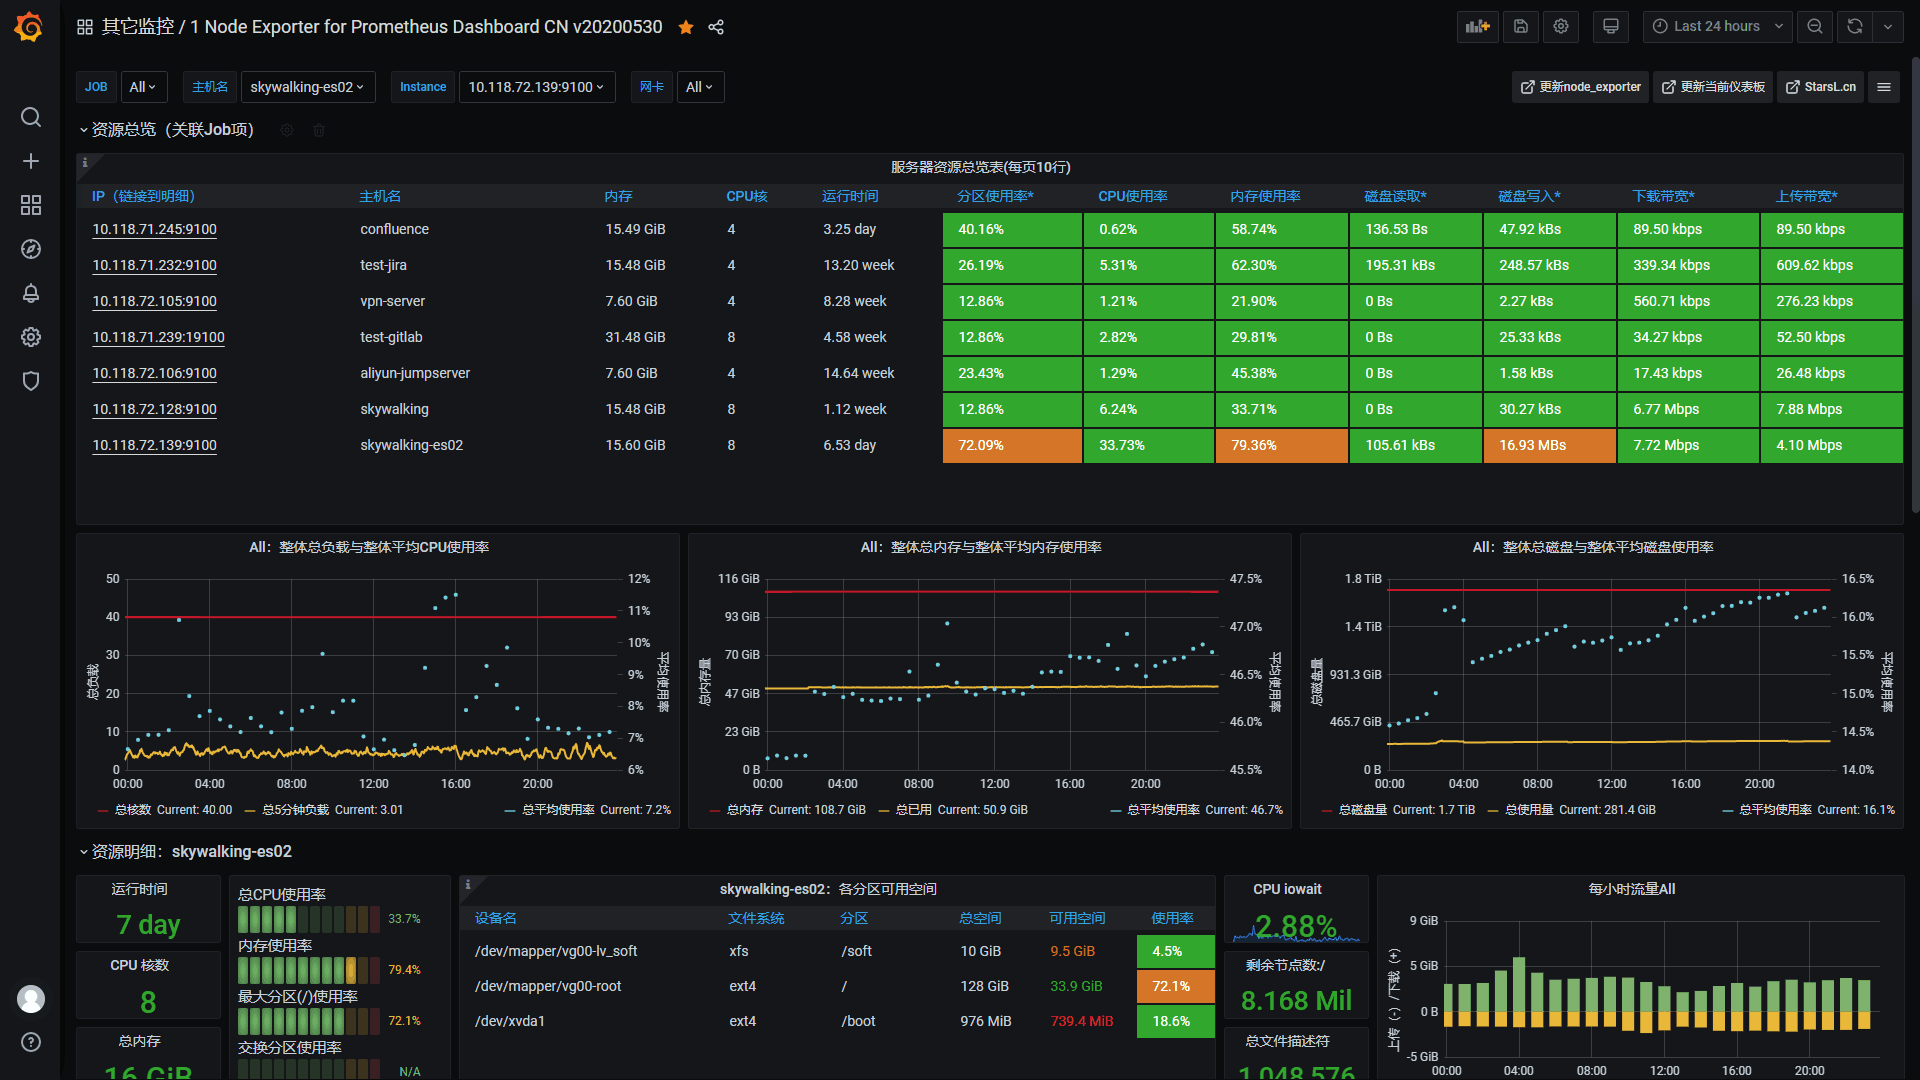
资源明细页截图 
注意事项:
导入看板后,请根据实际情况在看板右上角点击Dashboard settings–Variables设置好变量:
默认已经设置并关联好job,hostname,node这3个变量。
$node取值node_exporter的instance,IP:端口格式。大部分查询关联了这个变量,请确保该变量有效!$maxmount用来查询当前主机的最大分区,默认只获取ext.*和xfs类型的分区。
5.2 windows_exporter 配置
5.2.1 实例部署
windows_exporter,需要在每个Windows实例上部署,可以从https://github.com/prometheus-community/windows_exporter/releases/ 中下载msi文件进行安装,亦可以下载exe文件直接执行。
软件运行后访问http://ip:9182/metrics,能够成功返回数据即可。
**注意: ** windows_exporter 不能用于Win7及Windows 2008 R2 以前的版本。
wmi_exporter 宣布更名成windows_exporter后就不支持老版本的Windows。旧版本请下载windows_exporter 0.9.0(wmi_exporter)以前的版本(exe),新版本的指标为window开头,旧版本指标为wmi开头,相应的Dashboard需要跟着修改。
5.2.2 采集配置
同node_exporter
5.2.3 仪表板配置
1 windows_exporter for Prometheus Dashboard CN v20201012 by StarsL.cn
https://grafana.com/grafana/dashboards/10467
win2k系列的 wmi_exporter采用该仪表板
3 wmi_exporter 0.7.0+ for Prometheus 监控展示看板(windows监控)
https://grafana.com/grafana/dashboards/11230

5.3 blackbox_exporter 配置
5.3.1 实例部署
blackbox_exporter是代理部署,仅需部署单个实例,通过blackbox.yml告知blackbox_exporter启用哪些监听模块。通过Prometheus配置prometheus.yml实现具体业务探针。Blackbox由于其灵活性,可以探测http、ssh、dns、证书等,是使用率最高的一个模块。
Docker-compose.yml示例如下:
version: '3.7'

services:
  blackbox_exporter:
    image: prom/blackbox_exporter:master
    depends_on:
      - prometheus
    ports:
      - 9115:9115
    command:
      - '--config.file=/config/blackbox.yml'
    volumes:
      - ./exporter/blackbox.yml:/config/blackbox.yml
    networks:
      - back-tier
    restart: always
blackbox.yml配置如下:
modules:
    http_2xx:
      prober: http
      timeout: 10s
      http:
        preferred_ip_protocol: "ip4" ## 如果http监测是使用ipv4 就要写上,目前国内使用ipv6很少。
        tls: true
        tls_config:
          insecure_skip_verify: true     #因为是自签名证书,故配

    http_post_2xx_query: ## 用于post请求使用的模块)由于每个接口传参不同 可以定义多个module
                         ## 用于不同接口(例如此命名为http_post_2xx_query 用于监测query.action接口
      prober: http
      timeout: 15s
      http:
        preferred_ip_protocol: "ip4" ##使用ipv4
        method: POST
        headers:
          Content-Type: application/json ##header头
        body: '{"hmac":"","params":{"publicFundsKeyWords":"xxx"}}' ##传参
    tcp_connect:         ##  TCP模块
      prober: tcp
    pop3s_banner:
      prober: tcp
      tcp:
        query_response:
        - expect: "^+OK"
        tls: true
        tls_config:
          insecure_skip_verify: false
    ssh_banner:
      prober: tcp
      tcp:
        query_response:
        - expect: "^SSH-2.0-"
    irc_banner:
      prober: tcp
      tcp:
        query_response:
        - send: "NICK prober"
        - send: "USER prober prober prober :prober"
        - expect: "PING :([^ ]+)"
          send: "PONG ${1}"
        - expect: "^:[^ ]+ 001"
    icmp:          ##  icmp模块
      prober: icmp
      timeout: 5s
      icmp:
    dns_gdyd:      ##  dns模块
      prober: dns
      timeout: 5s
      dns:
        query_name: "phpoa.gdyd.com"  #检查指定DNS记录
        query_type: "A"
        valid_rcodes:
        - NOERROR
5.3.2 采集配置
由于blackbox_exporter属于代理配置,需要在每个Job下面增加标签重命名,否则所有被探测的实例都只会显示blackbox_exporter的ip
  - job_name: "blackbox_端口监控"

...
    relabel_configs:
      - source_labels: [__address__]
        target_label: __param_target
      - source_labels: [__param_target]
        target_label: instance
      - target_label: __address__
        replacement: 10.45.**.xx:9115
ICMP监控(Ping)
由于target很多,这里按照target进行分组,并附上labels标签env作为区分
  - job_name: 'blackbox_ping'
    scrape_interval: 5s
    metrics_path: /probe
    params:
      module: [icmp]  #ping
    static_configs:
      - targets:
        - 10.**.**.**
        labels:
          env: '门禁设备'
      - targets:
        - 10.**.**.**
        labels:
          env: '网络安全设备'
      - targets:
        - 10.**.**.**
        - 10.**.**.**
        - 10.**.**.**
        - 10.**.**.**
        labels:
          env: '综合办公楼交换机'
      - targets:
        - 10.**.**.**
        - 10.**.**.**
        - 10.**.**.**
        - 10.**.**.**
        - 10.**.**.**
        - 10.**.**.**
        labels:
          env: '中心机房交换机'
    relabel_configs:
      - source_labels: [__address__]
        target_label: __param_target
      - source_labels: [__param_target]
        target_label: instance
      - target_label: __address__
        replacement: 10.45.**.**:9115  # Blackbox exporter.
blackbox_端口监控
使用blackbox tcp_connect模块,相关模块配置在blackbox.yml
  - job_name: "blackbox_端口监控"
    scrape_interval: 5s
    metrics_path: /probe
    params:
      module: [tcp_connect] #调用tcp_connect模块
    static_configs:
      - targets:
        - '10.**.**.xx:8200'
        labels:
          env: 'SIS时序数据库'
      - targets:
        - '10.**.**.xx:1521'
        labels:
          env: 'Oracle数据库'
      - targets:
        - 10.**.**.xx:3306
        labels:
          env: 'Mysql数据库'
    relabel_configs:
      - source_labels: [__address__]
        target_label: __param_target
      - source_labels: [__param_target]
        target_label: instance
      - target_label: __address__
        replacement: 10.**.**.xx:9115 #blackbox_exporter ip
HTTP监控实例
相关模块配置在blackbox.yml,注意 insecure_skip_verify: true必须加上,否则自签证书的http监控会报无法连接。
modules:
    http_2xx:
      prober: http
      timeout: 10s
      http:
        preferred_ip_protocol: "ip4" ## 如果http监测是使用ipv4 就要写上,目前国内使用ipv6很少。
        tls: true
        tls_config:
          insecure_skip_verify: true     #因为是自签名证书,故配该选项
prometheus.yml
  - job_name: 'blackbox_HTTP监控'
    scrape_interval: 45s
    metrics_path: /probe
    params:
      module: [http_2xx]  # Look for a HTTP 200 response.
    static_configs:
      - targets:
        - http://10.45.**.**
        - http://phpoa.gdyd.com/
        - https://www.baidu.com
        - https://mail.dms.yudean.com
        - http://eip.itc.gdyd.com/static/d/realtimeload.html
        - https://mobile.gdphdc.com:***/lead_adapter/portal/login.lead

        labels:
          env: 'HTTP业务'
    relabel_configs:
      - source_labels: [__address__]
        target_label: __param_target
      - source_labels: [__param_target]
        target_label: instance
      - target_label: __address__
        replacement: 10.**.**.**:9115  # The blackbox exporter's real hostname:port.
DNS监控配置
dns监控需要告知blackbox指定的域名解析,若域名解析成功,证明dns正常。blackbox.yaml配置如下
    dns_gdyd:      ##  dns模块
      prober: dns
      timeout: 5s
      dns:
        query_name: "phpoa.gdyd.com"  #检查指定DNS A记录
        query_type: "A"
        valid_rcodes:
        - NOERROR
prometheus.yml
  - job_name: "blackbox_dns"
    scrape_interval: 5s
    static_configs:
    metrics_path: /probe
    params:
      module: [dns_gdyd]
    static_configs:
      - targets:
        - 10.45.**.**
        - 10.45.**.**
        labels:
          env: '集团DNS业务'
    relabel_configs:
      - source_labels: [__address__]
        target_label: __param_target
      - source_labels: [__param_target]
        target_label: instance
      - target_label: __address__
        replacement: 10.**.**.**:9115
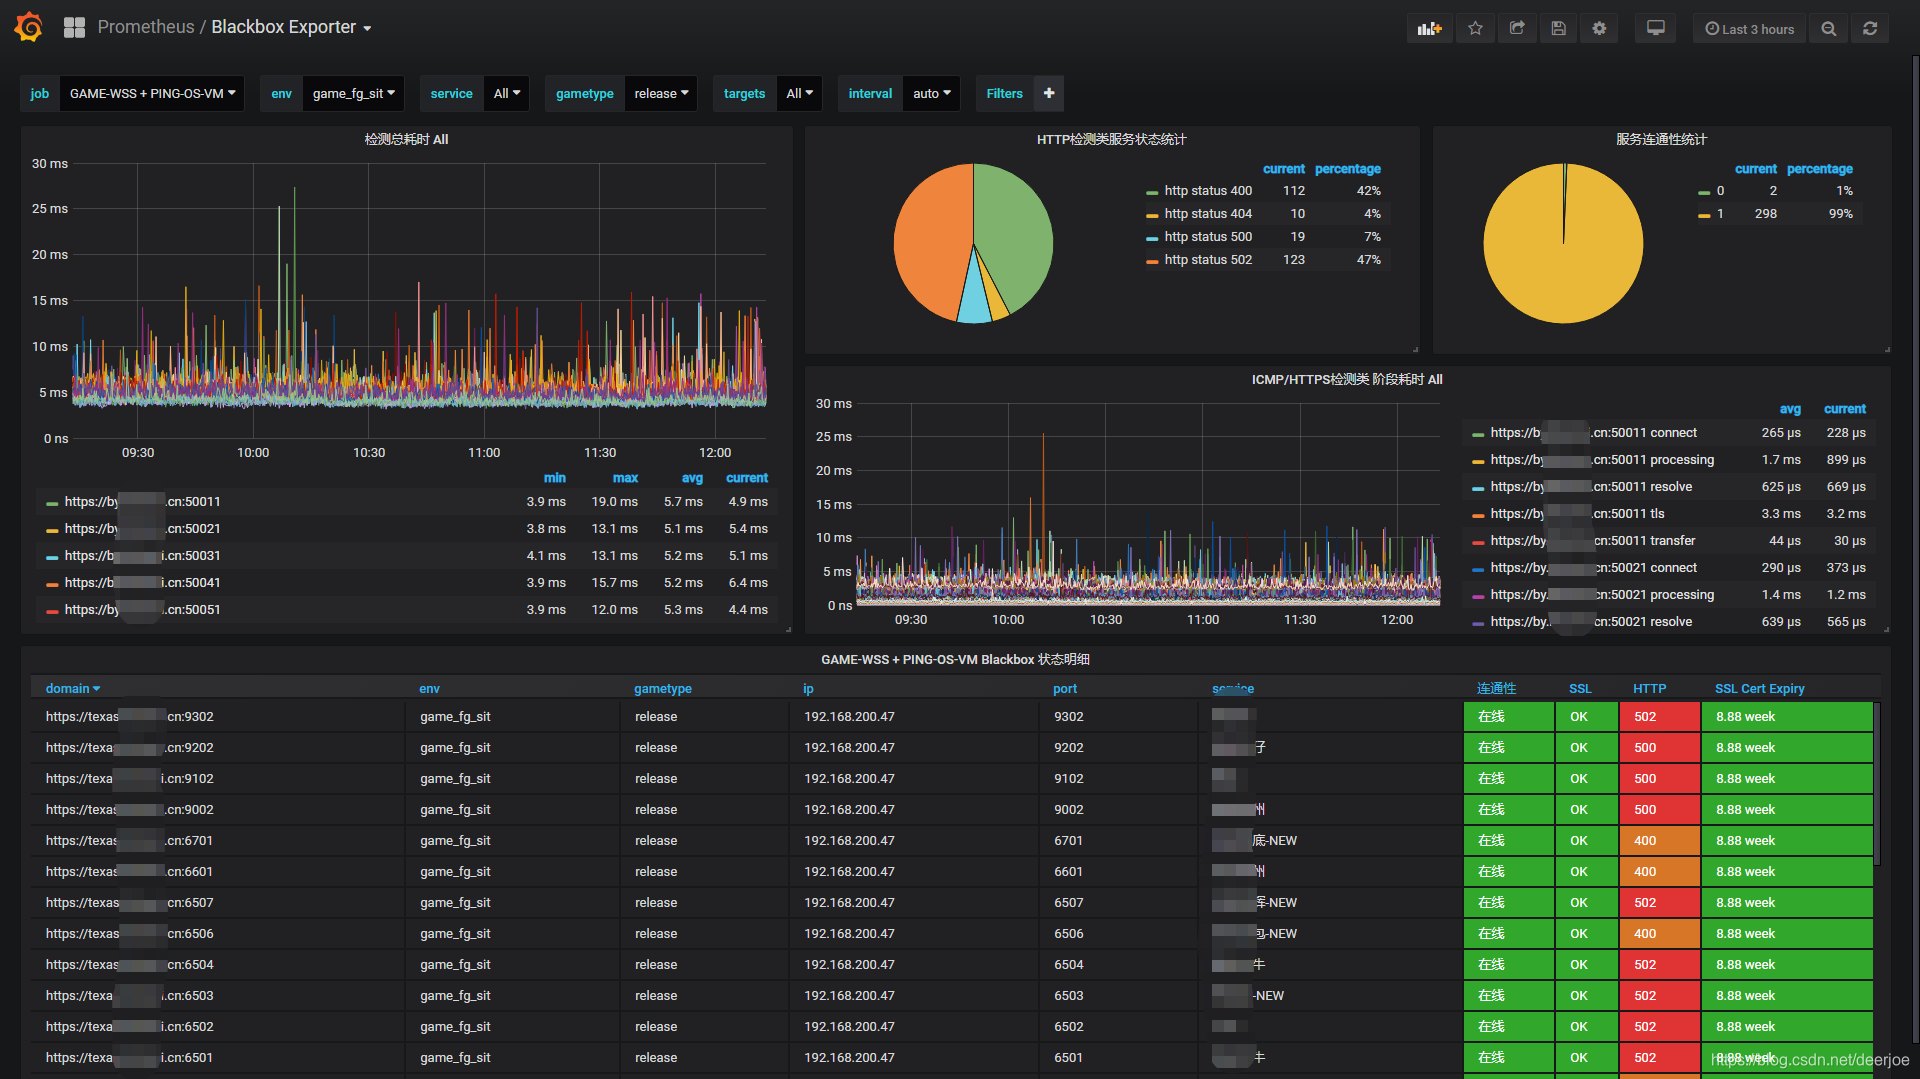
5.3.3 仪表板配置
2 Blackbox Exporter 0.14 for Prometheus 监控展示看板by StarsL.cn
https://grafana.com/grafana/dashboards/9965
目前在使用的TCP,ICMP,HTTPS服务状态监控 Prometheus Blackbox Exporter,在一个看板里面展示,做了展示效果的优化,支持多服务同时展示,需要使用的可以参考下,记得根据自己的实际情况修改下变量。
记得安装饼图插件
5.4 snmp_exporter 配置
snmp_exporter的配置为snmp.yml,该配置需要用SNMP Exporter Config Generator来生成。
5.4.1 实例部署
-
用Docker方式使用SNMP Exporter Config Generator生成snmp.yml,Generator位于snmp_exporter/generator 内
#克隆snmp_exporter项目 git clone https://github.com/prometheus/snmp_exporter.git #创建mibs文件夹 cd snmp_exporter/generator mkdir mibs -
将交换机的mib文件放入mib文件夹内。
收集 MIBs
- Cisco: ftp://ftp.cisco.com/pub/mibs/v2/v2.tar.gz
- APC: https://download.schneider-electric.com/files?p_File_Name=powernet432.mib
- Servertech: ftp://ftp.servertech.com/Pub/SNMP/sentry3/Sentry3.mib
- Palo Alto PanOS 7.0 enterprise MIBs: https://www.paloaltonetworks.com/content/dam/pan/en_US/assets/zip/technical-documentation/snmp-mib-modules/PAN-MIB-MODULES-7.0.zip
- Arista Networks: https://www.arista.com/assets/data/docs/MIBS/ARISTA-ENTITY-SENSOR-MIB.txt https://www.arista.com/assets/data/docs/MIBS/ARISTA-SW-IP-FORWARDING-MIB.txt https://www.arista.com/assets/data/docs/MIBS/ARISTA-SMI-MIB.txt
- Synology: https://global.download.synology.com/download/Document/Software/DeveloperGuide/Firmware/DSM/All/enu/Synology_MIB_File.zip
- MikroTik: http://download2.mikrotik.com/Mikrotik.mib
- UCD-SNMP-MIB (Net-SNMP): http://www.net-snmp.org/docs/mibs/UCD-SNMP-MIB.txt
- Ubiquiti Networks: http://dl.ubnt-ut.com/snmp/UBNT-MIB http://dl.ubnt-ut.com/snmp/UBNT-UniFi-MIB https://dl.ubnt.com/firmwares/airos-ubnt-mib/ubnt-mib.zip
这是一个很全的mib库:https://github.com/librenms/librenms/tree/master/mibs
-
使用snmptranslate查看MIB相关oid
snmptranslate -Tz -m mib文件 -
修改generator.yml,提供模块列表。最简单的模块只是一个名称和一组要遍历的 OID。
modules: if_mib: walk: - 1.3.6.1.4.1.41475 #自定义oid version: 2 auth: community: **** #snmp团体名密码 -
生成snmp.yml。
make mibs
docker build -t snmp-generator .
docker run -ti \
  -v "${PWD}:/opt/" \
  snmp-generator generate
使用docker-compose启动smnp_exporter
version: '3.7'

services:
  snmp_exporter:
    image: prom/snmp_exporter-linux-amd64
    depends_on:
      - prometheus
    ports:
      - 9116:9116
    volumes:
      - ./exporter/snmp.yml:/etc/snmp_exporter/snmp.yml
    networks:
      - back-tier
    restart: always
至此已完成smnp实例部署。
5.4.2 采集配置
  - job_name: 'BJ-BG-Center-3750-A'  # 交换机类型的名称表示采用Job做区分,然后多类交换机写多个Job对应即可
    static_configs:
      - targets:
        - '192.168.4.1'  # 交换机的IP地址
    metrics_path: /snmp
    params:
      module: [if_mib] # 如果是其他设备,可以采用其他模块,比如cisco_wlc AP设备, ddwrt 软路由等等
    relabel_configs:
      - source_labels: [__address__]
        target_label: __param_target
      - source_labels: [__param_target]
        target_label: instance
      - target_label: __address__
        replacement: 10.**.**.**:9116
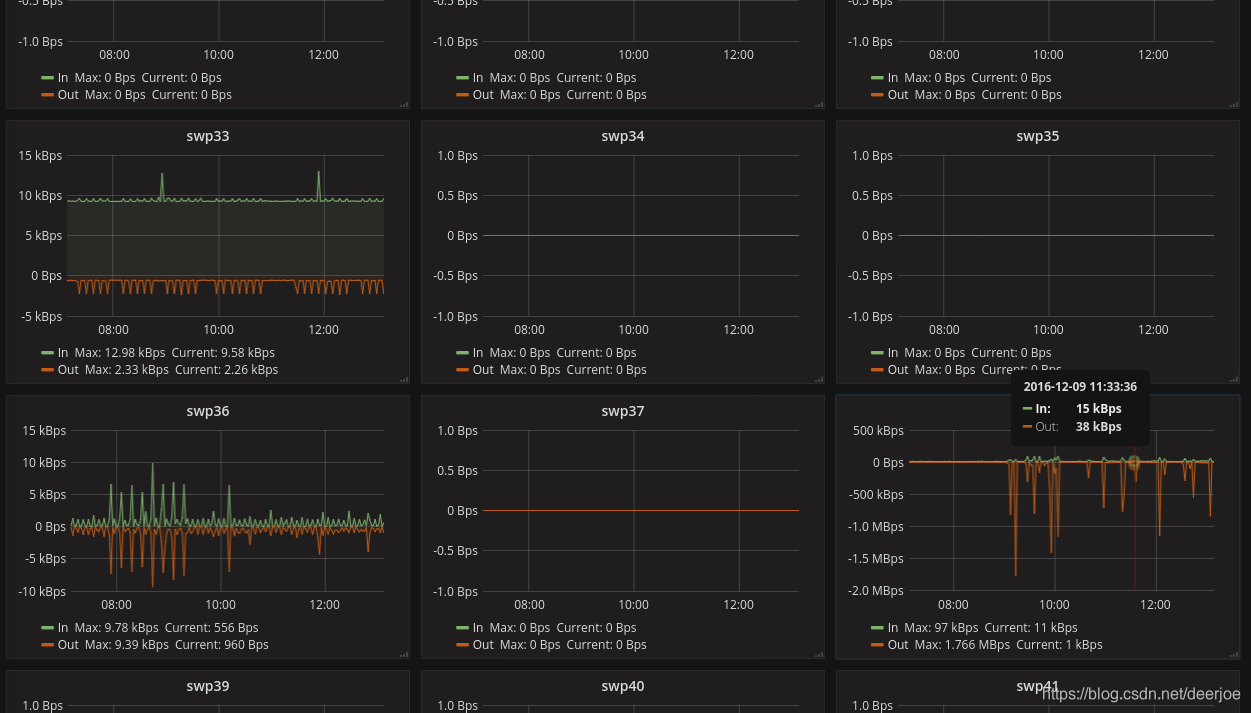
5.4.3 仪表板配置
可根据这个仪表板做一下修改
https://grafana.com/grafana/dashboards/1124
5.5 vmware_exporter 配置
5.5.1 实例部署
vmware_exporter属于实例部署exporter,可以向其传递环境变量或配置文件。传递环境变量需要大写,传递配置文件需要在命令行中增加 -c config.yml ,以下采用外挂环境变量文件进行传参
version: '3.7'
services:
  vmware_exporter:
    image: pryorda/vmware_exporter
    depends_on:
      - prometheus
    ports:
      - 9272:9272
    env_file:
      - ./exporter/vmware_exporter.config
    networks:
      - back-tier
    restart: always
vmware_exporter.config 如下
VSPHERE_USER=administrator@vsphere.local  #vsphere用户名
VSPHERE_PASSWORD=****                     #vsphere密码
VSPHERE_HOST=10.**.**.**                  #vsphere 地址
VSPHERE_IGNORE_SSL=True                   # 忽略证书错误
VSPHERE_SPECS_SIZE=2000
其他环境变量及配置说明如下:
| 环境变量 | 配置方式 | 默认 | 描述 |
|---|---|---|---|
VSPHERE_HOST | config, env, get_param | n/a | vsphere server地址 |
VSPHERE_USER | config, env | n/a | vsphere User |
VSPHERE_PASSWORD | config, env | n/a | vsphere Password |
VSPHERE_SPECS_SIZE | config, env | 5000 | Size of specs list for query stats function |
VSPHERE_IGNORE_SSL | config, env | False | 忽略证书错误 |
VSPHERE_FETCH_CUSTOM_ATTRIBUTES | config, env | False | 是否获取自定义属性 |
VSPHERE_FETCH_TAGS | config, env | False | 是否获取自定义标签 |
VSPHERE_FETCH_ALARMS | config, env | False | 是否获取告警 |
VSPHERE_COLLECT_HOSTS | config, env | True | 是否获取主机信息 |
VSPHERE_COLLECT_DATASTORES | config, env | True | 是否获取存储信息 |
VSPHERE_COLLECT_VMS | config, env | True | 是否获取虚拟机信息 |
VSPHERE_COLLECT_VMGUESTS | config, env | True | 是否获取虚拟机guest信息 |
VSPHERE_COLLECT_SNAPSHOTS | config, env | True | 是否获取快照信息 |
详情参见:https://github.com/pryorda/vmware_exporter
5.5.2 采集配置
- job_name: vmware_export
    metrics_path: /metrics
    static_configs:
    - targets:
      - vcenter01
      - vcenter02
      - vcenter03
    relabel_configs:
    - source_labels: [__address__]
      target_label: __param_target
    - source_labels: [__param_target]
      target_label: instance
    - target_label: __address__
      replacement: exporter_ip:9272
5.6 oracle_exporter 配置
略,实验证明oracle_exporter对公司内Oracle 10版本来说不太稳定,隔一段时间后会挂,且对Oracle数据库具有一定的压力。后放弃对Oracle的监控,可参考https://github.com/iamseth/oracledb_exporter
5.7 ceph-mgr配置
5.7.1 实例部署
在Ceph Luminous之前的版本,可以使用第三方的Prometheus exporterceph_exporter。
Ceph Luminous 12.2.1的mgr中自带了Prometheus插件,内置了 Prometheus ceph exporter,可以使用Ceph mgr内置的exporter作为Prometheus的target。需要进入mgr节点输入命令
# 启用Ceph的Prometheus插件
ceph mgr module enable prometheus
5.7.2 采集配置
  - job_name: 'ceph_exporter'
    static_configs:
    - targets: ['10.**.**.**:9283']
      labels:
        instance: ceph
        cluster: ceph
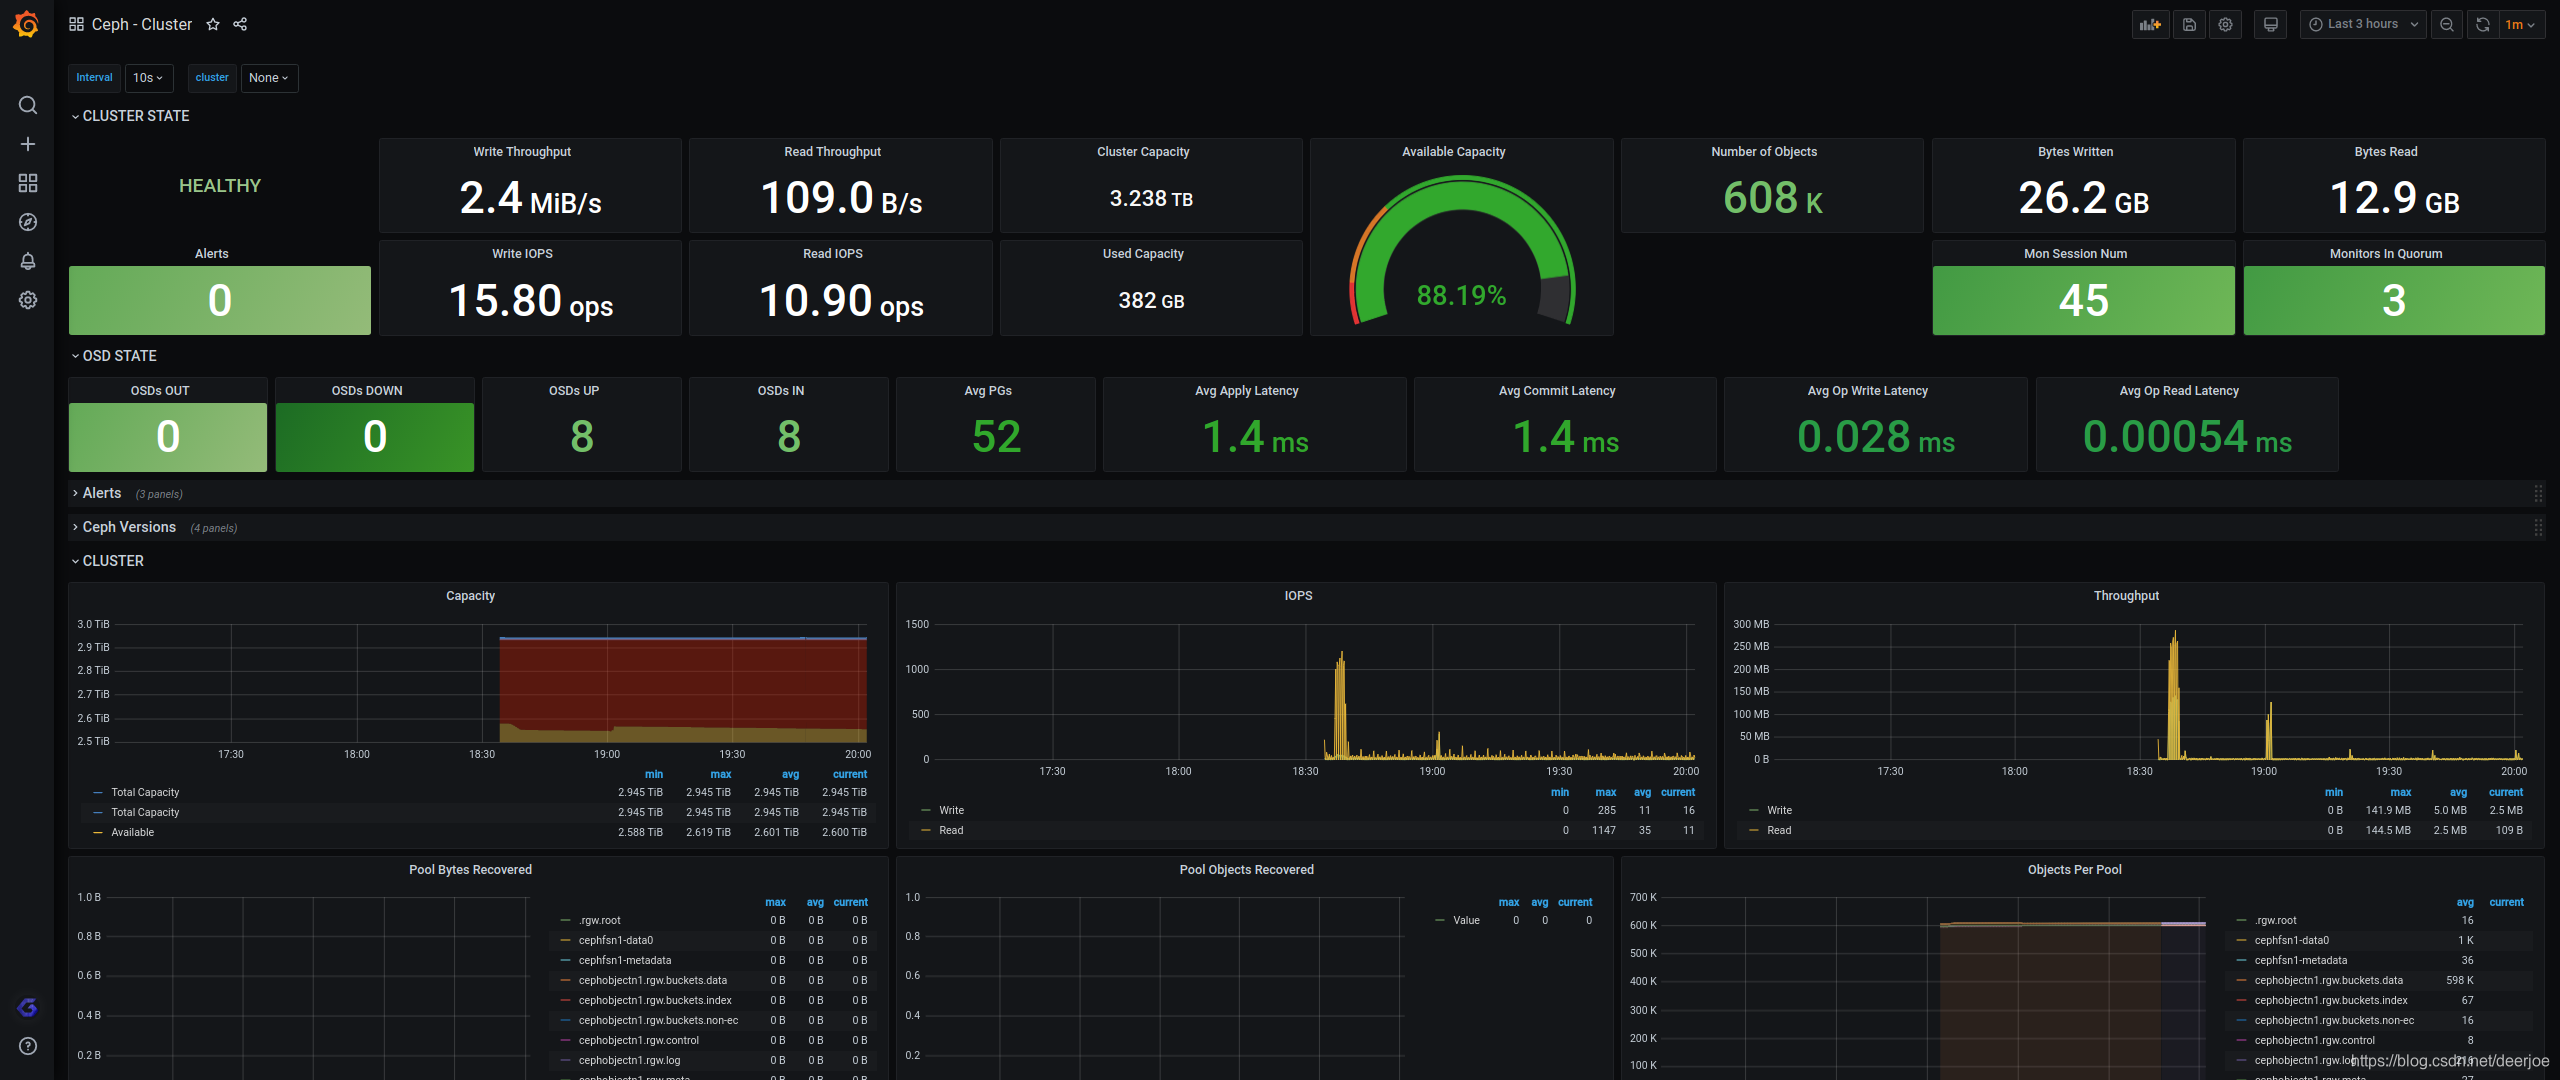
5.7.3 仪表板配置
https://grafana.com/grafana/dashboards/2842
5.8 容器监控配置
为了解决docker stats的问题(存储、展示),谷歌开源了cadvisor不仅可以搜集一台机器上所有运行的容器信息,还提供基础查询界面和http接口,方便其他组件如Prometheus进行数据抓取,cAdvisor可以对节点机器上的资源及容器进行实时监控和性能数据采集,包括CPU使用情况、内存使用情况、网络吞吐量及文件系统使用情况,Cadvisor使用Go语言开发,利用Linux的cgroups获取容器的资源使用信息,在K8S中集成在Kubelet里作为默认启动项,官方标配。
5.8.1 实例配置
在有docker的主机上,执行以下命令
docker run \
  -v=/:/rootfs:ro \
  -v=/var/run:/var/run:rw \
  -v=/sys:/sys:ro \
  -v=/var/lib/docker/:/var/lib/docker:ro \
  -v=/dev/disk/:/dev/disk:ro \
  -p=8765:8080 \
  -d \
  --name=cadvisor \
  google/cadvisor:latest
注意:
在Ret Hat,CentOS, Fedora 等发行版上需要传递如下参数,因为 SELinux 加强了安全策略:
–privileged=true
启动后访问:http://127.0.0.1:8765查看页面,/metric查看指标
5.8.2 采集配置
  - job_name: 'cadvisor'
    scrape_interval: 5s
    static_configs:
      - targets:
        - 10.**.**.**:8765
5.8.3 仪表盘配置
Docker monitoring with node selectionby Nazar
https://grafana.com/grafana/dashboards/8321

5.9 Java监控配置
5.9.1 实例配置
Java监控需要运行Jmx_exporter,其原理是在Java运行的时候调用-javaagent参数,指定jar 运行。
- jmx_prometheus_javaagent-0.16.1.jar 适用于 Java >= 7.
- jmx_prometheus_javaagent-0.16.1_java6.jar 适用于 Java 6.
java -javaagent:./jmx_prometheus_javaagent-0.16.1.jar=端口名称:config.yaml -jar springboot.jar
Tips:一般的Java中间件都会引用系统环境变量JAVA_OPTIONS,可以将-javaagent参数写入JAVA_OPTIONS中
#Windows 环境变量写法
JAVA_OPTIONS=%JAVA_OPTIONS%;-javaagent:c:\jmx_prometheus_javaagent-0.16.1.jar=8083:c:\config.yaml
#Linux 环境变量写法
JAVA_OPTIONS=$JAVA_OPTIONS./jmx_prometheus_javaagent-0.16.1.jar=8083:config.yaml
config.yaml 可根据github上的示例,根据不同中间件来配置。
github上已有常见的weblogic、tomcat的配置,直接引用即可
https://github.com/prometheus/jmx_exporter/tree/master/example_configs
5.9.2 采集配置
采集配置根据参数中暴露的端口定义即可
  - job_name: 'java'
    scrape_interval: 5s
    static_configs:
      - targets:
        - 10.**.**.**:8083
5.9.3 仪表盘配置
JMX Overview by rogerw
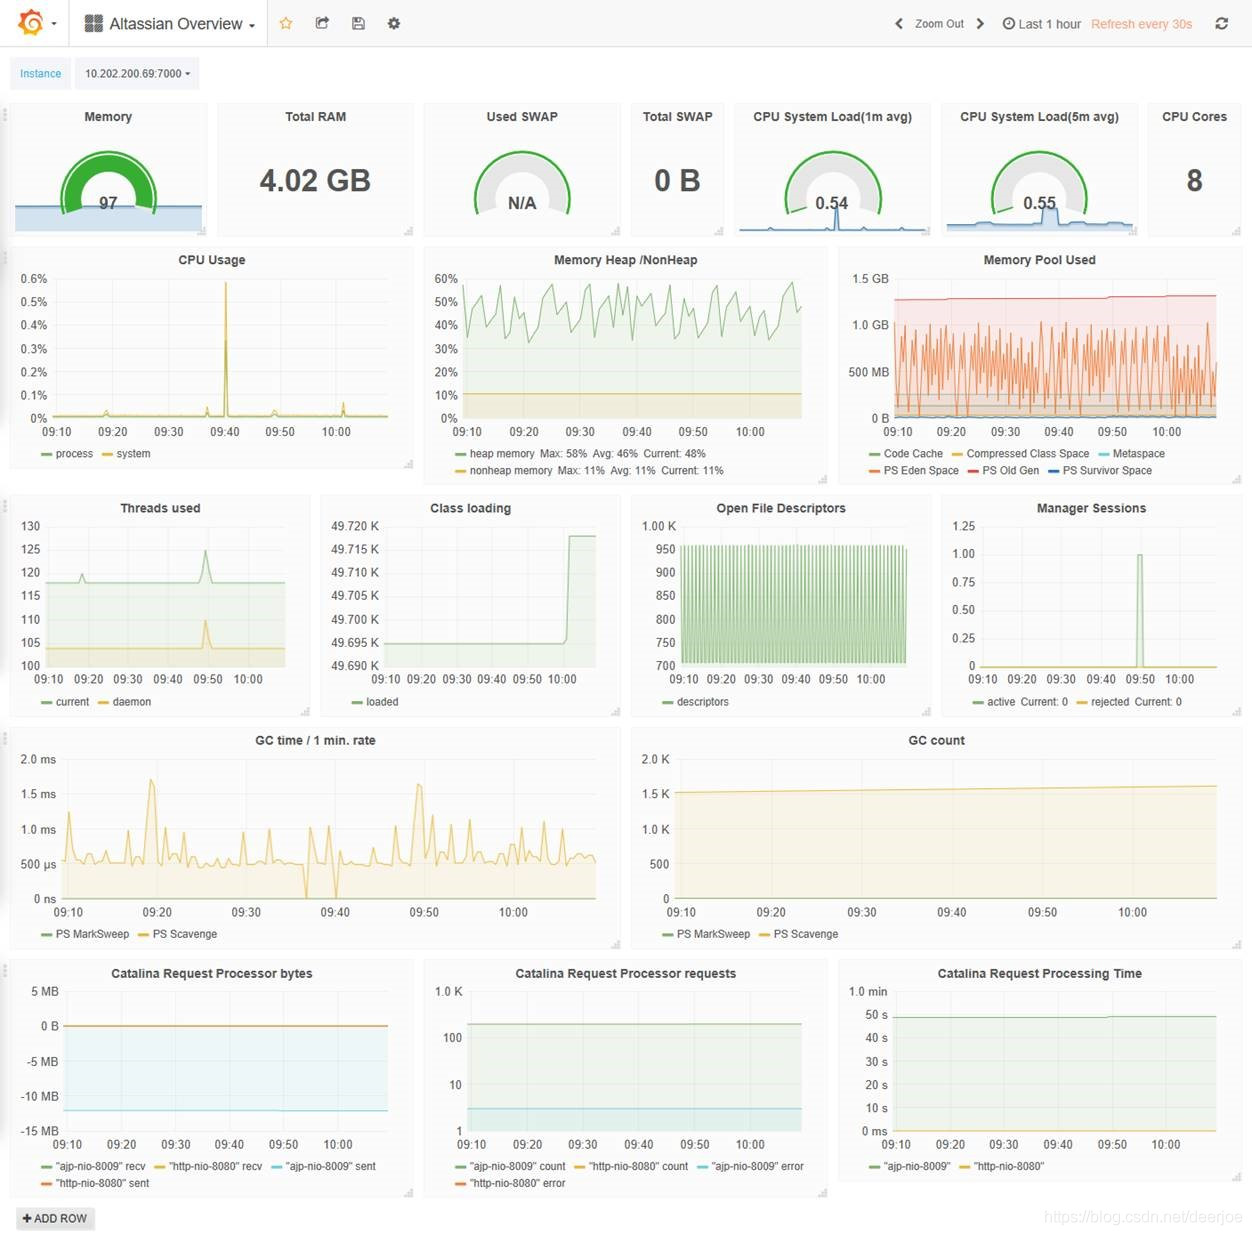
https://grafana.com/grafana/dashboards/3457
6. 告警配置解析
6.1 alertmanager配置
config.yml
global:
  resolve_timeout: 5m               # 在没有报警的情况下声明为已解决的时间
  # 配置邮件发送信息
templates:
 - '/etc/alertmanager/wechat.tmpl'  #告警模板
route:

  # 将传入的报警中有这些标签的分为一个组.
  # 比如, cluster=A 和 alertname=LatencyHigh 会分成一个组.
  group_by: ['alertname']

  # 指分组创建多久后才可以发送压缩的警报,也就是初次发警报的延时.
  # 这样会确保第一次通知的时候, 有更多的报警被压缩在一起.
  group_wait: 10s

  # 当第一个通知发送,等待多久发送压缩的警报
  group_interval: 10s

  # 默认的接收器
  receiver: 'wechat'
receivers:
 - name: 'wechat'					# 子节点 - 微信
   wechat_configs:
   - corp_id: 'xxxxx'                 # 企业微信corpid
     to_party: '13'                  # 组ID
     agent_id: '1000015'            # agentid
     api_secret: 'xxxxxxxxxxxxxxxxxxx'             # 企业微信corp secret
     send_resolved: true			# 告警解除后否发送通知
告警模板
wechat.tmpl,该文件采用go temple解析模板
{{ define "wechat.default.message" }}{{ range $i, $alert :=.Alerts }}
告警状态:{{   .Status }}
告警级别:{{ $alert.Labels.severity }}
告警类型:{{ $alert.Labels.alertname }}
告警应用:{{ $alert.Annotations.summary }}
告警主机:{{ $alert.Labels.instance }}
告警环境:{{ $alert.Labels.env }}
告警详情:{{ $alert.Annotations.description }}
告警时间:{{ (.StartsAt.Add 28800e9).Format "2006-01-02 15:04:05" }}  #UTC时间需要增加基础时间StartsAt.Add 28800e9
恢复时间: {{ (.EndsAt.Sub .StartsAt) }}
------------------------------------------------
{{ end }}{{ end }}
6.2 告警规则
告警规则可以参照https://awesome-prometheus-alerts.grep.to/ ,这里根据公司需求收集并修改汉化了一下。
6.2.1 业务连通性告警
groups:
- name: 业务连通性监控
  rules:

  # Alert for any instance that is unreachable for >5 minutes.
  - alert: 业务连通性监控
    expr: probe_success == 0
    for: 2m
    labels:
      severity: 严重
    annotations:
      summary: "业务 {{ $labels.instance }} 丢失"
      description: " {{ $labels.job }} 检测到环境 {{ $labels.env }} 的{{ $labels.instance }}状态异常超过2分钟."

  - alert: HTTP业务连通性监控
    expr: probe_http_status_code <= 199 OR probe_http_status_code >= 400
    for: 2m
    labels:
      severity: 严重
    annotations:
      summary: "HTTP业务 {{ $labels.instance }} 异常"
      description: "{{ $labels.job }} 检测到环境 {{ $labels.env }} 的{{ $labels.instance }}状态异常超过2分钟."
6.2.2 SSL证书告警
- name: SSL证书监控
  rules:

  - alert: 证书30天提醒
    expr: probe_ssl_earliest_cert_expiry-time()< 86400 * 30
    for: 1d
    labels:
      severity: 提醒
    annotations:
      summary: "业务证书SSL {{ $labels.instance }} 即将过期"
      description: " {{ $labels.job }} 检测到环境 {{ $labels.env }} 的{{ $labels.instance }} SSL证书过期时间小于30天."
  - alert: 证书15天提醒
    expr: probe_ssl_earliest_cert_expiry-time()< 86400 * 15
    for: 1d
    labels:
      severity: 告警
    annotations:
      summary: "业务证书SSL {{ $labels.instance }} 即将过期"
      description: " {{ $labels.job }} 检测到环境 {{ $labels.env }} 的{{ $labels.instance }} SSL证书过期时间小于15天."


  - alert: 证书过期提醒
    expr: probe_ssl_earliest_cert_expiry-time()<= 0
    for: 1d
    labels:
      severity: 严重
    annotations:
      summary: "业务证书SSL {{ $labels.instance }} 过期"
      description: " {{ $labels.job }} 检测到环境 {{ $labels.env }} 的{{ $labels.instance }} SSL证书过期."
6.2.3 虚拟机告警
- name: 虚拟主机告警
  rules:

  # Alert for any instance that is unreachable for >2 minutes.
  - alert: vSphere主机内存使用率超上限
    expr: vmware_host_memory_usage/vmware_host_memory_max*100>85
    for: 20m
    labels:
      severity: 告警
    annotations:
      summary: "vSphere主机 {{ $labels.host_name }} 主机内存使用率超高限85%"
      description: " {{ $labels.job }}\n检测到环境vSphere主机 {{ $labels.host_name }} 主机内存使用率超高限85% 超过20分钟.\n 当前值 = {{ $value }}"
  - alert: vSphere主机内存使用率超下限
    expr: vmware_host_memory_usage/vmware_host_memory_max*100<20
    for: 20m
    labels:
      severity: 告警
    annotations:
      summary: "vSphere主机 {{ $labels.host_name }} 主机内存使用率超限20%"
      description: " {{ $labels.job }}检测到\n环境vSphere主机 {{ $labels.host_name }} 主机内存使用率超低限10% 超过20分钟.\n 当前值 = {{ $value }}"

- name: 虚拟机告警
  rules:

  # Alert for any instance that is unreachable for >2 minutes.
  - alert: 虚拟机CPU使用率超上限
    expr: vmware_vm_cpu_usagemhz_average/vmware_vm_max_cpu_usage*100>80
    for: 30m
    labels:
      severity: 告警
    annotations:
      summary: "虚拟机 {{ $labels.vm_name }} 上的CPU使用率超高限80%"
      description: " {{ $labels.job }}检测到\n {{ $labels.host_name }} 中的虚机 {{ $labels.vm_name }} CPU使用率超高限80%超过30分钟.\n 当前值 = {{ $value }}"

  - alert: 虚拟机内存使用率超上限
    expr: (vmware_vm_mem_active_average/ vmware_vm_mem_consumed_average)*100>90
    for: 30m
    labels:
      severity: 告警
    annotations:
      summary: "vSphere主机 {{ $labels.host_name }} 主机内存使用率超90%"
      description: " {{ $labels.job }}检测到\n {{ $labels.host_name }} 中的虚机 {{ $labels.vm_name }} 内存使用率超90% 超过30分钟.n\ 当前值 = {{ $value }}"
6.2.4 Linux主机告警
- name: Linux主机告警
  rules:
  - alert: 主机内存超限>90%
    expr: node_memory_MemAvailable_bytes / node_memory_MemTotal_bytes * 100 < 10
    for: 5m
    labels:
      severity: 告警
    annotations:
      summary: "{{ $labels.instance }}主机内存超限>90%"
      description: "{{ $labels.instance }} 主机内存超限(< 10% left)\n  当前值 = {{ $value }}\n "


  - alert: HostMemoryUnderMemoryPressure
    expr: rate(node_vmstat_pgmajfault[1m]) > 1000
    for: 5m
    labels:
      severity: 告警
    annotations:
      summary: "Host memory under memory pressure (instance {{ $labels.instance }})"
      description: "The node is under heavy memory pressure. High rate of major page faults\n  当前值 = {{ $value }}\n  LABELS: {{ $labels }}"


  - alert: 主机磁盘空间不足
    expr: (node_filesystem_avail_bytes{mountpoint="/rootfs"}  * 100) / node_filesystem_size_bytes{mountpoint="/rootfs"} < 10
    for: 5m
    labels:
      severity: 告警
    annotations:
      summary: "{{ $labels.instance }}主机磁盘空间不足"
      description: "{{ $labels.instance }} 主机磁盘空间不足(< 10% 剩余)\n  当前值 = {{ $value }}\n "


  - alert: 主机磁盘Inodes不足
    expr: node_filesystem_files_free{mountpoint ="/rootfs"} / node_filesystem_files{mountpoint ="/rootfs"} * 100 < 10
    for: 5m
    labels:
      severity: 告警
    annotations:
      summary: "{{ $labels.instance }}主机磁盘Inodes不足"
      description: "{{ $labels.instance }} 主机磁盘Inodes不足(< 10% 剩余)\n  当前值 = {{ $value }}\n"


  - alert: 主机CPU负载高
    expr: 100 - (avg by(instance) (irate(node_cpu_seconds_total{mode="idle"}[5m])) * 100) > 80
    for: 5m
    labels:
      severity: 告警
    annotations:
      summary: "{{ $labels.instance }}主机CPU负载高"
      description: "{{ $labels.instance }} 主机CPU负载高\n  当前值 = {{ $value }}\n"


  # 1000 context switches is an arbitrary number.
  # Alert threshold depends on nature of application.
  # Please read: https://github.com/samber/awesome-prometheus-alerts/issues/58
  - alert: 主机CPU上下文切换高
    expr: (rate(node_context_switches_total[5m])) / (count without(cpu, mode) (node_cpu_seconds_total{mode="idle"})) > 10000
    for: 5m
    labels:
      severity: 告警
    annotations:
      summary: "{{ $labels.instance }}主机CPU上下文切换高"
      description: "{{ $labels.instance }}主机CPU上下文切换高 (> 2000 / s)\n 当前值 =  {{ $value }}\n  "


  - alert: 主机Swap空间满
    expr: (1 - (node_memory_SwapFree_bytes / node_memory_SwapTotal_bytes)) * 100 > 80
    for: 5m
    labels:
      severity: 告警
    annotations:
      summary: "{{ $labels.instance }}主机Swap空间满"
      description: "{{ $labels.instance }}主机Swap空间满 (>80%)\n  当前值  = {{ $value }}\n "


  - alert: 主机过热
    expr: node_hwmon_temp_alarm == 1
    for: 5m
    labels:
      severity: 严重
    annotations:
      summary: "{{ $labels.instance }} 主机过热"
      description: "{{ $labels }}主机过热\n  当前值  = {{ $value }} \n "


  - alert: HostRaidDiskFailure
    expr: node_md_disks{state="fail"} > 0
    for: 5m
    labels:
      severity: 告警
    annotations:
      summary: "Host RAID disk failure (instance {{ $labels.instance }})"
      description: "At least one device in RAID array on {{ $labels.instance }} failed. Array {{ $labels.md_device }} needs attention and possibly a disk swap\n  当前值 = {{ $value }}\n  LABELS: {{ $labels }}"


  - alert: 主机OomKill检测
    expr: increase(node_vmstat_oom_kill[5m]) > 0
    for: 5m
    labels:
      severity: 告警
    annotations:
      summary: "检测到主机{{ $labels.instance }}发生OoM kill"
      description: "OOM kill detected\n  当前值 = {{ $value }}\n "
6.2.5 Windows主机告警
- name: Windows主机告警
  rules:
  - alert: Windows 服务告警
    expr: windows_service_status{status="ok"} != 1
    for: 5m
    labels:
      severity: 严重
    annotations:
      summary: "Windows服务告警状态告警 (instance {{ $labels.instance }})"
      description: "Windows Service state is not OK\n  当前值 = {{ $value }}\n  LABELS: {{ $labels }}"

  - alert: Windows CPU使用率告警
    expr: 100 - (avg by (instance) (rate(windows_cpu_time_total{mode="idle"}[2m])) * 100) > 80
    for: 5m
    labels:
      severity: 告警
    annotations:
      summary: "Windows使用率告警 (instance {{ $labels.instance }})"
      description: "CPU使用率超过 80%\n  当前值 = {{ $value }}\n  LABELS: {{ $labels }}"

  - alert: Windows 内存使用率告警
    expr: 100 * (windows_os_physical_memory_free_bytes) / windows_cs_physical_memory_bytes > 90
    for: 5m
    labels:
      severity: 告警
    annotations:
      summary: "Windows Server memory Usage (instance {{ $labels.instance }})"
      description: "内存使用率超过 90%\n  当前值 = {{ $value }}\n  LABELS: {{ $labels }}"

  - alert: Windows 磁盘使用率告警
    expr: 100.0 - 100 * ((windows_logical_disk_free_bytes{} / 1024 / 1024 ) / (windows_logical_disk_size_bytes{} / 1024 / 1024)) > 80
    for: 5m
    labels:
      severity: 严重
    annotations:
      summary: "Windows 磁盘使用率告警 (instance {{ $labels.instance }})"
      description: "磁盘使用率告警超过 80%\n  当前值 = {{ $value }}\n  LABELS: {{ $labels }}"


- name: Windows 2k 主机告警
  rules:
  - alert: Windows 2k 服务告警
    expr: wmi_service_status{status="ok"} != 1
    for: 5m
    labels:
      severity: 严重
    annotations:
      summary: "Windows 2k 服务告警状态告警 (instance {{ $labels.instance }})"
      description: "Windows Service state is not OK\n  当前值 = {{ $value }}\n  LABELS: {{ $labels }}"

  - alert: Windows 2k CPU使用率告警
    expr: 100 - (avg by (instance) (rate(wmi_cpu_time_total{mode="idle"}[2m])) * 100) > 80
    for: 5m
    labels:
      severity: 告警
    annotations:
      summary: "Windows 2k 使用率告警 (instance {{ $labels.instance }})"
      description: "CPU使用率超过 80%\n  当前值 = {{ $value }}\n  LABELS: {{ $labels }}"

  - alert: Windows 2k 内存使用率告警
    expr: 100 * (wmi_os_physical_memory_free_bytes) / wmi_cs_physical_memory_bytes > 90
    for: 5m
    labels:
      severity: 告警
    annotations:
      summary: "Windows  2k Server memory Usage (instance {{ $labels.instance }})"
      description: "内存使用率超过 90%\n  当前值 = {{ $value }}\n  LABELS: {{ $labels }}"

  - alert: Windows 磁盘使用率告警
    expr: 100.0 - 100 * ((wmi_logical_disk_free_bytes{} / 1024 / 1024 ) / (wmi_logical_disk_size_bytes{} / 1024 / 1024)) > 90
    for: 5m
    labels:
      severity: 严重
    annotations:
      summary: "Windows 2k 磁盘使用率告警 (instance {{ $labels.instance }})"
      description: "磁盘使用率告警超过 90%\n  当前值 = {{ $value }}\n  LABELS: {{ $labels }}"
6.2.6 Ceph告警
- name: Ceph告警
  rules:
  - alert: Ceph状态
    expr: ceph_health_status != 0
    for: 5m
    labels:
      severity: 严重
    annotations:
      summary: "Ceph 状态不健康 (instance {{ $labels.instance }})"
      description: "Ceph 状态不健康 \n  当前值 = {{ $value }}\n  LABELS: {{ $labels }}"

  - alert: Ceph管理节点时间不同步
    expr: abs(ceph_monitor_clock_skew_seconds) > 0.2
    for: 5m
    labels:
      severity: 告警
    annotations:
      summary: "Ceph管理节点时间不同步 (instance {{ $labels.instance }})"
      description: "监测到Ceph管理节点时间不同步. 请检查时间设置\n  当前值 = {{ $value }}\n  LABELS: {{ $labels }}"

  - alert: Ceph管理节点空间不足
    expr: ceph_monitor_avail_percent < 10
    for: 5m
    labels:
      severity: 告警
    annotations:
      summary: "Ceph管理节点 low space (instance {{ $labels.instance }})"
      description: "Ceph管理节点空间不足.\n  当前值 = {{ $value }}\n  LABELS: {{ $labels }}"

  - alert: CephOsd宕机
    expr: ceph_osd_up == 0
    for: 5m
    labels:
      severity: 严重
    annotations:
      summary: "Ceph OSD Down (instance {{ $labels.instance }})"
      description: "Ceph Object Storage Daemon Down\n  当前值 = {{ $value }}\n  LABELS: {{ $labels }}"

  - alert: CephOsd高延时
    expr: ceph_osd_perf_apply_latency_seconds > 10
    for: 5m
    labels:
      severity: 告警
    annotations:
      summary: "Ceph OSD 高延时 (instance {{ $labels.instance }})"
      description: "Ceph Object Storage Daemon 高延时.\n  当前值 = {{ $value }}\n  LABELS: {{ $labels }}"

  - alert: CephOsd容量不足
    expr: ceph_osd_utilization > 90
    for: 5m
    labels:
      severity: 告警
    annotations:
      summary: "Ceph OSD 容量不足 (instance {{ $labels.instance }})"
      description: "Ceph Object Storage Daemon 容量不足. 请增加磁盘.\n  当前值 = {{ $value }}\n  LABELS: {{ $labels }}"

  - alert: CephOsd权重调整时间过长
    expr: ceph_osd_weight < 1
    for: 5m
    labels:
      severity: 告警
    annotations:
      summary: "Ceph OSD 权重调整超时 (instance {{ $labels.instance }})"
      description: "Ceph Object Storage Daemon 权重调整时间过长.\n  当前值 = {{ $value }}\n  LABELS: {{ $labels }}"

  - alert: CephPg宕机
    expr: ceph_pg_down > 0
    for: 5m
    labels:
      severity: 严重
    annotations:
      summary: "Ceph PG down (instance {{ $labels.instance }})"
      description: "Ceph placement groups 状态为 down. 请确认数据完整性.\n  当前值 = {{ $value }}\n  LABELS: {{ $labels }}"

  - alert: CephPgIncomplete
    expr: ceph_pg_incomplete > 0
    for: 5m
    labels:
      severity: 严重
    annotations:
      summary: "Ceph PG 不完整 (instance {{ $labels.instance }})"
      description: "Ceph placement groups 状态为 incomplete. 请确认数据完整性.\n  当前值 = {{ $value }}\n  LABELS: {{ $labels }}"

  - alert: CephPg回填满
    expr: ceph_pg_backfill_toofull > 0
    for: 5m
    labels:
      severity: 告警
    annotations:
      summary: "Ceph PG 回填满 (instance {{ $labels.instance }})"
      description: "Ceph placement groups 位于已经满了的 Object Storage Daemon .PGs不可用. 请检查 OSDs, 更改权重或重新配置CRUSH规则.\n  当前值 = {{ $value }}\n  LABELS: {{ $labels }}"
6.2.7 容器告警
- name: 数据库告警
  rules:
  - alert: Oracle数据库Down
    expr: oracledb_up !=1
    for: 2m
    labels:
      severity: 严重
    annotations:
      summary: "主数据库 (instance {{ $labels.instance }})宕机"
      description: "主数据库 (instance {{ $labels.instance }})宕机"

- name: 容器告警

  rules:
  - alert: 容器Killed
    expr: time() - container_last_seen > 60
    for: 5m
    labels:
      severity: 告警
    annotations:
      summary: "容器 killed (instance {{ $labels.instance }})"
      description: "容器被 killed \n  当前值 = {{ $value }}\n  LABELS: {{ $labels }}"


  - alert: 容器Volume使用率高
    expr: (1 - (sum(container_fs_inodes_free) BY (instance) / sum(container_fs_inodes_total) BY (instance)) * 100) > 80
    for: 5m
    labels:
      severity: 告警
    annotations:
      summary: "容器Volume使用率高 (instance {{ $labels.instance }})"
      description: "容器Volume使用率高于 80%\n  当前值 = {{ $value }}\n  LABELS: {{ $labels }}"

  - alert: 容器Volume IO 高
    expr: (sum(container_fs_io_current) BY (instance, name) * 100) > 80
    for: 5m
    labels:
      severity: 告警
    annotations:
      summary: "容器Volume IO 高 (instance {{ $labels.instance }})"
      description: "容器Volume IO高于 80%\n  当前值 = {{ $value }}\n  LABELS: {{ $labels }}"

  - alert: 容器CPU频率限制高
    expr: rate(container_cpu_cfs_throttled_seconds_total[3m]) > 1
    for: 5m
    labels:
      severity: 告警
    annotations:
      summary: "容器CPU频率限制高 (instance {{ $labels.instance }})"
      description: "容器CPU频率被限制\n  当前值 = {{ $value }}\n  LABELS: {{ $labels }}"

助力广东及东莞地区开发者,代码托管、在线学习与竞赛、技术交流与分享、资源共享、职业发展,成为松山湖开发者首选的工作与学习平台
更多推荐


 1
1 0
0- 0


 已为社区贡献1条内容

所有评论(0)