
手把手教你封装各种vue+echarts图表封装(含中国省市区地图)
setChartOption.js 地图数据处理函数var colorOption = ['#3aa0ff',' #36cbcb','#4dcb73','#fad337','#f2637b','#975fe4','#e7bcf3','#8378ea','#3aa0ff',' #36cbcb','#4dcb73','#fad337','#f2637b','#975fe4','#e7bcf3','#8
·

安装
npm i echarts@4.6.0以下是各种图表组件封装代码
柱状图 BarChart

        <bar-chart
          style="height: 520px"
          @showList="showBarProList"
          :title="'项目实施部门分布'"
          :data="projectOrgDistribution"
        />
<template>
<div ref="myChart" class="myChart"></div>
</template>
<script>
import { setTransverseBarChart } from './setChartOption'
const echarts = require('echarts/lib/echarts')
require('echarts/lib/chart/bar')
require('echarts/lib/component/title')
require('echarts/lib/component/legend')
require('echarts/lib/component/tooltip')
export default {
name: 'BarChart',
props: {
data: {
type: Array,
required: true,
default: null
},
height: {
type: Number,
required: false,
default: null
},
title: {
type: String,
default: null
},
x: {
type: String,
default: null
},
y: {
type: String,
default: null
}
},
watch: {
data() {
this.getChartData()
}
},
mounted() {
this.getChartData()
},
activated() {
this.getChartData()
},
deactivated() {
if (!this.chart) {
return
}
this.chart.dispose()
this.chart = null
window.removeEventListener('resize', this.chartResize)
},
beforeDestroy() {
if (!this.chart) {
return
}
this.chart.dispose()
this.chart = null
window.removeEventListener('resize', this.chartResize)
},
methods: {
setTransverseBarChart,
getChartData() {
this.chart = echarts.init(this.$refs.myChart)
let options = {}
options = this.setTransverseBarChart(this.title, this.data)
this.chart.setOption(options)
const that = this
this.chart.on('click', function(params) {
if (params.componentType === 'series') {
that.$emit('showList', params)
}
})
window.addEventListener('resize', this.chartResize)
},
chartResize() {
this.chart.resize()
}
}
}
</script>
<style lang="less" scoped>
.myChart {
width: 100%;
background: white;
padding: 15px;
height: 100%;
}
</style>
柱线图 BarLineChart

<template>
  <div ref="myChart" class="myChart"></div>
</template>

<script>
import { setBarLineChartOption } from './setChartOption'
const echarts = require('echarts/lib/echarts')
require('echarts/lib/chart/bar')
require('echarts/lib/chart/line')
require('echarts/lib/component/title')
require('echarts/lib/component/legend')
require('echarts/lib/component/tooltip')
export default {
  name: 'BarChart',
  props: {
    data: {
      type: Object || Array,
      required: true,
      default: null
    },
    title: {
      type: String,
      default: null
    },
    x: {
      type: String,
      default: null
    },
    y: {
      type: String,
      default: null
    },
    lengendList: {
      type: Array,
      required: true,
      default: () => []
    },
    clickAuth: {
      type: Boolean,
      default: false
    }
  },
  watch: {
    data() {
      this.getChartData()
    }
  },
  mounted() {
    this.getChartData()
  },
  activated() {
    this.getChartData()
  },
  deactivated() {
    window.removeEventListener('resize', this.chartResize)
  },
  beforeDestroy() {
    if (!this.chart) {
      return
    }
    this.chart.dispose()
    this.chart = null
    window.removeEventListener('resize', this.chartResize)
  },
  methods: {
    setBarLineChartOption,
    getChartData() {
      const that = this
      this.chart = echarts.init(this.$refs.myChart)
      let options = {}
      options = this.setBarLineChartOption(this.title, this.data, this.lengendList)
      // 双y轴对齐
      options.yAxis[0].max = Math.ceil(Math.max.apply(null, options.series[0].data) / 5) * 5
      options.yAxis[0].interval = Math.ceil(Math.max.apply(null, options.series[0].data) / 5)
      options.yAxis[1].max = Math.ceil(Math.max.apply(null, options.series[1].data) / 5) * 5
      options.yAxis[1].interval = Math.ceil(Math.max.apply(null, options.series[1].data) / 5)
      options.yAxis[0].min = 0
      options.yAxis[1].min = 0
      this.chart.setOption(options)
      this.chart.on('click', function(params) {
        if (!this.clickAuth) return
        if (params.componentType === 'series') {
          that.$emit('showList', params.data)
        }
      })
      window.addEventListener('resize', this.chartResize)
    },
    chartResize() {
      this.chart.resize()
    }
  }
}
</script>

<style lang="less" scoped>
.myChart {
  width: 100%;
  background: white;
  height: 100%;
}
</style>
中国地图和点击显示省市区地图 ChinaProvinceMapChart
实现中国及省市区地图请使用echarts5以下的版本,博主使用的是echarts 4.6.0版本 ,echarts5无省市区配置


          <map-chart
            style="height: 850px;width:100%"
            class="map-chart"
            :height="800"
            :data="projectAddressDistribution"
            :title="'项目地区分布'"
            :isShowProvinceMap="isShowProvinceMap"
            @showProvince="showProvince"
            :searchForm="searchChartForm"
          />
<template>
<!-- -->
<div class="echarts" ref="map">
<div>
<div :style="{ height: height + 'px' }" id="myEchart" v-show="!isShowProvinceMap"></div>
<div :style="{ height: height + 'px' }" id="provinceMap" v-show="isShowProvinceMap"></div>
</div>
</div>
</template>
<script>
import { setMapChartOption, setProvinceMap } from './setChartOption'
import { getProAreaDistribution } from '@/api/pmo/dataCenter/projectReport'
import { mapGetters } from 'vuex'
// 西藏新疆青海贵州 根据后端省市区名称不一致做调整
import './province/xizang.js'
import './province/xinjiang.js'
import './province/qinghai.js'
import './province/guizhou.js'
import echarts from 'echarts'
require('echarts/map/js/china.js') // 引入中国地图数据
// 以下34个省份
require('echarts/map/js/province/anhui.js')
require('echarts/map/js/province/aomen.js')
require('echarts/map/js/province/beijing.js')
require('echarts/map/js/province/chongqing.js')
require('echarts/map/js/province/fujian.js')
require('echarts/map/js/province/gansu.js')
require('echarts/map/js/province/guangdong.js')
require('echarts/map/js/province/guangxi.js')
// require('echarts/map/js/province/guizhou.js')
require('echarts/map/js/province/hainan.js')
require('echarts/map/js/province/hebei.js')
require('echarts/map/js/province/heilongjiang.js')
require('echarts/map/js/province/henan.js')
require('echarts/map/js/province/hubei.js')
require('echarts/map/js/province/hunan.js')
require('echarts/map/js/province/jiangsu.js')
require('echarts/map/js/province/jiangxi.js')
require('echarts/map/js/province/jilin.js')
require('echarts/map/js/province/liaoning.js')
require('echarts/map/js/province/neimenggu.js')
require('echarts/map/js/province/ningxia.js')
// require('echarts/map/js/province/qinghai.js')
require('echarts/map/js/province/shandong.js')
require('echarts/map/js/province/shanghai.js')
require('echarts/map/js/province/shanxi.js')
require('echarts/map/js/province/shanxi1.js')
require('echarts/map/js/province/sichuan.js')
require('echarts/map/js/province/taiwan.js')
require('echarts/map/js/province/tianjin.js')
require('echarts/map/js/province/xianggang.js')
// require('echarts/map/js/province/xinjiang.js')
// require('echarts/map/js/province/xizang.js')
require('echarts/map/js/province/yunnan.js')
require('echarts/map/js/province/zhejiang.js')
export default {
name: 'MapChart',
props: {
height: {
type: Number,
required: false,
default: 0
},
width: {
type: Number,
required: false,
default: 0
},
data: {
type: Array,
required: true
},
title: {
type: String,
default: null
},
isShowProvinceMap: {
type: Boolean,
default: false
},
searchForm: {
type: Object,
default: () => {}
}
},
data() {
return {
echartsWidth: 0,
chart: null,
provinceChart: null,
provinceData: [],
provinceList: [],
echarts: null
}
},
computed: {
...mapGetters(['address'])
},
watch: {
data() {
this.init()
},
isShowProvinceMap(val) {
if (val) {
//div节点显示再加载地图
this.init()
}
}
},
mounted() {
// this.init()
},
activated() {
// this.init()
},
deactivated() {
window.removeEventListener('resize', this.chartResize)
},
beforeDestroy() {
this.destroy()
},
methods: {
showProvinceMap() {
this.$emit('showProvince', false)
},
async init() {
if (!this.address.length) {
await this.$store.dispatch('getAddress')
}
this.chinaConfigure()
window.addEventListener('resize', this.chartResize)
this.makeProvinceData()
},
destroy() {
if (this.chart) {
this.chart.clear()
this.chart.dispose()
this.chart = null
window.removeEventListener('resize', this.chartResize)
}
if (this.provinceChart) {
this.provinceChart.clear()
this.provinceChart.dispose()
this.provinceChart = null
window.removeEventListener('resize', this.provinceChartResize)
}
},
makeProvinceData() {
const List = []
this.address.map(item => {
const obj = {}
obj.name = item.name
if (item.children && item.children.length) {
item.children.map(v => {
if (v.children) {
delete v.children
}
return v
})
}
obj.children = item.children || []
List.push(obj)
})
this.provinceList = List
console.log(' this.provinceList: ', this.provinceList)
},
async chinaConfigure() {
const that = this
let queryProvinceName
if (!this.chart) {
this.chart = echarts.init(document.getElementById('myEchart'))
}
// const data = this.data
console.log('this.data: ', this.data)
const chineData = setMapChartOption(this.title, this.data)
console.log('chineData: ', chineData)
chineData.series[0].layoutCenter = ['50%', '50%']
chineData.series[0].layoutSize = '200%'
this.chart.setOption(chineData)
this.chart.off('click') // 避免click事件重复触发
this.chart.on('click', async function(params) {
// 如果不是直辖市 拼接省
const cityStr = '北京天津上海重庆'
const regionStr = '新疆内蒙古西藏澳门香港宁夏'
if (params.name && regionStr.includes(params.name)) {
switch (params.name) {
case '新疆':
queryProvinceName = '新疆维吾尔自治区'
break
case '内蒙古':
queryProvinceName = '内蒙古自治区'
break
case '西藏':
queryProvinceName = '西藏自治区'
break
case '澳门':
queryProvinceName = '澳门特别行政区'
break
case '香港':
queryProvinceName = '香港特别行政区'
break
case '宁夏':
queryProvinceName = '宁夏回族自治区'
break
}
} else if (params.name && !cityStr.includes(params.name)) {
queryProvinceName = params.name + '省'
// 如果是直辖市不展示具体区域
} else if (cityStr.includes(params.name)) {
return
// queryProvinceName = params.name
}
that.chart.showLoading()
await that.getSelectedProvinceData(queryProvinceName)
await that.showProvinveMap(params.name)
})
this.$forceUpdate()
},
async showProvinveMap(mapType) {
if (!this.provinceChart) {
this.provinceChart = echarts.init(document.getElementById('provinceMap'))
this.provinceChart.off('click') // 避免click事件重复触发
window.addEventListener('resize', this.provinceChartResize)
}
const data = setProvinceMap(this.title, this.provinceData, mapType)
console.log('data: ', data)
if (mapType === '海南') {
// 由于海南地图包括南海及南海诸岛在内的大片区域,所以显示海南地图时,要将地图放大,并设置海南岛居中显示
data.series[0].center = [109.844902, 19.0392]
data.series[0].layoutCenter = ['50%', '50%']
data.series[0].layoutSize = '600%'
} else {
// 非显示海南时,将设置的参数恢复默认值
data.series[0].center = undefined
data.series[0].layoutCenter = ['50%', '50%']
data.series[0].layoutSize = '100%'
}
this.provinceChart.setOption(data)
this.chart.hideLoading()
},
async getSelectedProvinceData(provinceName) {
const that = this
const params = JSON.parse(JSON.stringify(this.searchForm))
params.provinceName = provinceName
const initProvinceData = this.provinceList.filter(item => item.name.includes(provinceName))
const List = []
if (initProvinceData.length) {
initProvinceData[0].children.map(item => {
item.name = item.name ? item.name.toString() : item.name
List.push({
name: item.name,
value: 0
})
})
}
await getProAreaDistribution(params).then(res => {
that.$emit('showProvince', true)
const resData = res.data || []
resData.forEach(element => {
element.value = element.value ? Number(element.value) : 0
})
List.map((item, index) => {
resData.map((v, i) => {
if (v.name === item.name) {
item.value = v.value
}
})
return item
})
this.provinceData = List
})
},
chartResize() {
if (!this.chart) {
return
}
this.chart.resize()
},
provinceChartResize() {
this.provinceChart.resize()
}
}
}
</script>
<style lang="less" scoped>
.echarts {
position: relative;
padding: 15px;
}
.backBtn {
position: absolute;
top: 100px;
right: 0;
}
</style>
线图 LineChart
      <line-chart
          :title="'项目活跃分层趋势'"
          :isSingle="false"
          :color="['#ff3333', '#1890ff', '#98D87D', '#f59a23']"
          :namelt="['休眠', '低活跃', '稳定', '高活跃']"
          :data="[
            projectDormancyActivityList,
            projectLowActivityList,
            projectStableActivityList,
            projectHighActivityList
          ]"
          class="h100"
          style="height: 520px"
        />
<template>
<div ref="myChart" class="myChart"></div>
</template>
<script>
import { setLineChartOption, setMulLineChartOption } from './setChartOption'
const echarts = require('echarts/lib/echarts')
require('echarts/lib/chart/line')
require('echarts/lib/component/title')
require('echarts/lib/component/legend')
require('echarts/lib/component/tooltip')
export default {
name: 'LineChart',
props: {
data: {
type: Array,
required: true,
default: null
},
type: {
type: String,
default: null
},
title: {
type: String,
default: null
},
namelt: {
type: Array,
default: null
},
isSingle: {
type: Boolean,
default: true
},
loading: {
type: Boolean,
default: false
},
isMul: {
type: Boolean,
default: false
},
color: {
type: Array,
default: null
}
},
watch: {
data() {
this.getChartData()
}
},
mounted() {
this.getChartData()
},
activated() {
this.getChartData()
},
deactivated() {
window.removeEventListener('resize', this.chartResize)
},
beforeDestroy() {
if (!this.chart) {
return
}
this.chart.dispose()
this.chart = null
window.removeEventListener('resize', this.chartResize)
},
methods: {
setLineChartOption,
setMulLineChartOption,
getChartData() {
if (!this.chart) {
this.chart = echarts.init(this.$refs.myChart)
}
let options = {}
if (this.isSingle) {
options = this.setLineChartOption(this.type, this.data, this.color)
} else {
options = this.setMulLineChartOption('clue', this.data, this.namelt, this.color, this.isMul, this.title)
}
this.chart.setOption(options)
window.addEventListener('resize', this.chartResize)
},
chartResize() {
this.chart.resize()
}
}
}
</script>
<style lang="less" scoped>
.myChart {
width: 100%;
background: white;
height: 100%;
padding: 15px;
}
</style>

饼图 PieChart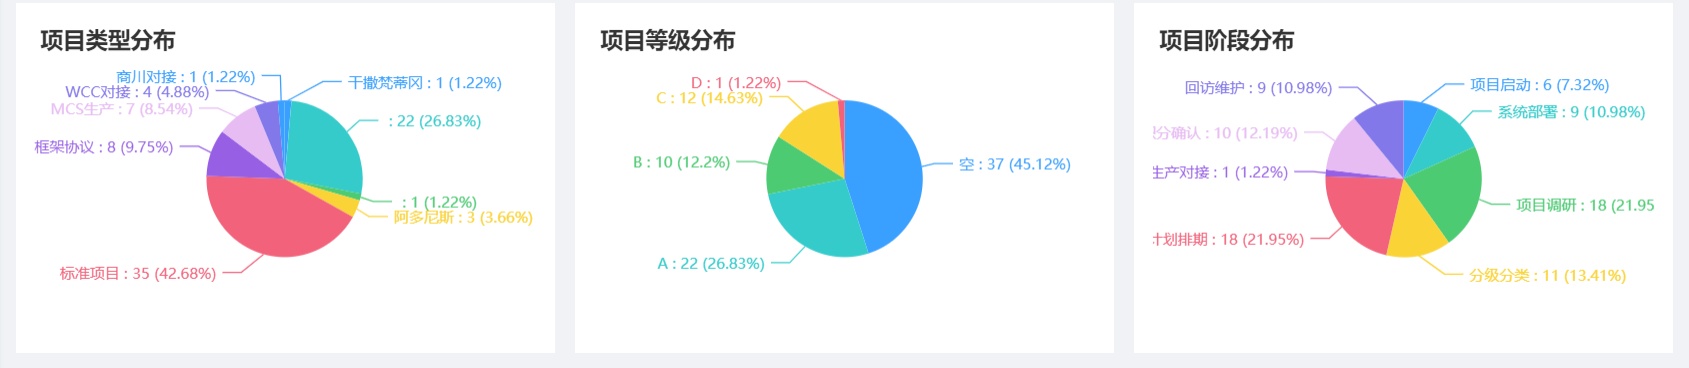
<pie-chart @showList="showProList" :title="'风险等级分布'" :data="riskProjectCollection" />
<template>
  <div ref="myChart" class="chart" style=""></div>
</template>

<script>
import { setPieChartOption } from './setChartOption'
const echarts = require('echarts/lib/echarts')
require('echarts/lib/chart/pie')
require('echarts/lib/component/title')
require('echarts/lib/component/legend')
require('echarts/lib/component/tooltip')
export default {
  name: 'PieChart',
  props: {
    data: {
      type: Array,
      required: true,
      default: null
    },
    title: {
      type: String,
      default: null
    }
  },
  watch: {
    data() {
      this.getChartData()
    }
  },
  mounted() {
    this.getChartData()
  },
  activated() {
    this.getChartData()
  },
  deactivated() {
    window.removeEventListener('resize', this.chartResize)
  },
  beforeDestroy() {
    if (!this.chart) {
      return
    }
    this.chart.dispose()
    this.chart = null
    window.removeEventListener('resize', this.chartResize)
  },
  methods: {
    setPieChartOption,
    getChartData() {
      this.chart = echarts.init(this.$refs.myChart)
      let options = {}
      options = this.setPieChartOption(this.title, this.data)
      options.series[0].layoutCenter = ['50%', '50%']
      // options.series[0].layoutSize = '80%'
      this.chart.setOption(options)
      const that = this
      this.chart.on('click', function(params) {
        const data = params
        if (params.componentType === 'series') {
          data.title = this.title
          that.$emit('showList', data)
        }
      })
      window.addEventListener('resize', this.chartResize)
    },
    chartResize() {
      this.chart.resize()
    }
  }
}
</script>

<style lang="less" scoped>
.chart {
  background: white;
  min-height: 280px;
  padding: 15px;
}
</style>
setChartOption.js 处理数据生成地图渲染配置
const colorOption = [
  '#3aa0ff',
  ' #36cbcb',
  '#4dcb73',
  '#fad337',
  '#f2637b',
  '#975fe4',
  '#e7bcf3',
  '#8378ea',
  '#3aa0ff',
  ' #36cbcb',
  '#4dcb73',
  '#fad337',
  '#f2637b',
  '#975fe4',
  '#e7bcf3',
  '#8378ea',
  '#3aa0ff',
  ' #36cbcb',
  '#4dcb73',
  '#fad337',
  '#f2637b',
  '#975fe4',
  '#e7bcf3',
  '#8378ea'
]

const tooltipOption = {
  backgroundColor: 'white',
  padding: 12,
  textStyle: {
    color: 'rgba(0,0,0,.65)'
  },
  extraCssText: 'box-shadow: 0 4px 12px 0 rgba(0,0,0,.1);'
}

const xAxisOption = {
  type: 'category',
  axisTick: {
    alignWithLabel: true,
    lineStyle: {
      color: '#BFBFBF'
    }
  },
  axisLine: {
    lineStyle: {
      color: '#BFBFBF'
    }
  },
  axisLabel: {
    color: 'rgba(0,0,0,.65)',
    fontSize: 12,
    lineHeight: 17
  }
}

const yAxisOption = {
  type: 'value',
  axisLine: {
    show: false
  },
  axisTick: {
    show: false
  },
  axisLabel: {
    margin: 4,
    color: 'rgba(0,0,0,.65)',
    fontSize: 12,
    lineHeight: 17
  },
  splitLine: {
    lineStyle: {
      color: '#E9E9E9',
      type: 'dashed'
    }
  }
}


export function setMulLineChartOption(type, data, namelt, color, isMul, title) {
  const series = []
  let yAxis = []
  data.forEach((item, index) => {
    series.push({
      name: namelt[index],
      data: item.map(item => Number(item.value)),
      type: 'line',
      label: {
        normal: {
          show: true,
          position: 'top'
        }
      }
    })
    if (isMul) {
      if (data.length === 2 && index === data.length - 1) {
        series[data.length - 1].yAxisIndex = 1
      }
    }
  })
  if (isMul) {
    namelt.forEach((item, index) => {
      yAxis.push({
        ...yAxisOption,
        name: item,
        type: 'value'
      })
    })
  } else {
    yAxis = yAxisOption
  }
  return {
    title: {
      text: title,
      left: 'left'
    },
    color: color,
    tooltip: {
      trigger: 'axis'
    },
    grid: {
      left: '8%',
      right: '3%'
    },
    xAxis: {
      ...xAxisOption,
      data: data[0].map(item => item.name),
      axisPointer: {
        lineStyle: {
          color: 'rgba(0,0,0,0.1)'
        }
      }
    },
    legend: {
      data: namelt
    },
    // yAxis: yAxisOption,
    yAxis: yAxis,
    series: series
  }
}
export function setPieChartOption(title, data) {
  let datas = []
  if (!data || !data.length) {
    datas.push({
      name: '空',
      typeId: '-1',
      value: 0
    })
  } else {
    datas = data.filter(item => Number(item.value))
  }
  return {
    title: {
      text: title
    },
    color: colorOption,
    tooltip: {
      confine: true,
      trigger: 'item',
      formatter: '{b} : {c}
占比:{d}%'
    },
    grid: {
      top: 2
    },
    series: [
      {
        name: this.title,
        type: 'pie',
        radius: '50%', // 饼图 []数组即为环形图
        center: ['50%', '50%'], // 设置居中
        minAngle: 5,
        avoidLabelOverlap: true,
        label: {
          align: 'left',
          formatter: '{b} : {c} ({d}%)',
          textStyle: {
            fontSize: 12
          }
        },
        emphasis: {
          label: {
            show: true,
            fontSize: '12',
            fontWeight: 'bold'
          }
        },
        labelLine: {
          show: true
        },
        data: datas
      }
    ]
  }
}

export function setBarChartOption(title, data) {
  return {
    title: {
      text: title
    },
    color: colorOption,
    tooltip: {
      trigger: 'item',
      formatter: '{b} : {c}'
    },
    xAxis: {
      ...yAxisOption,
      axisLine: {
        show: true,
        lineStyle: {
          color: '#BFBFBF'
        }
      },
      axisLabel: {
        ...yAxisOption.axisLabel
      }
    },
    yAxis: {
      type: 'category',
      data: data.map(item => item.name),
      ...xAxisOption,
      axisLabel: { interval: 0, color: 'rgba(0,0,0,.65)' }
      // axisPointer: {
      //   type: 'shadow',
      //   shadowStyle: {
      //     color: 'rgba(0,0,0,0.05)'
      //   }
      // }
    },
    grid: { left: 80, right: 10, bottom: '10%', containLabel: false },
    series: [
      {
        name: title,
        type: 'bar',
        barMaxWidth: 30,
        orient: 'horizontal',
        radius: [10, 110],
        roseType: 'area',
        data: data.map(item => item.value)
      }
    ]
  }
}
// 横向柱状图图表
export function setTransverseBarChart(title, data) {
  let max = 0
  const xAxisList = []
  const dataList = []
  if (data && data.length) {
    data.map(item => {
      max = Math.max(max, Number(item.value))
      xAxisList.push(item.name)
      dataList.push(Number(item.value))
    })
  }

  return {
    title: {
      text: title
    },
    color: colorOption,
    tooltip: {
      trigger: 'item',
      formatter: '{b} : {c}'
    },
    grid: {
      left: 60,
      y2: 100
    },
    xAxis: [
      {
        type: 'category',
        data: xAxisList,
        // height: 50,
        axisLabel: {
          interval: 0,
          height: 250,
          formatter: function(value) {
            console.log('value: ', value)
            return value.split('').join('\n')
          },
          color: 'rgba(0,0,0,.65)'
        },
        axisTick: {
          alignWithLabel: true
        },
        axisLine: {
          lineStyle: {
            color: '#BFBFBF'
          }
        }
      }
    ],
    yAxis: [
      {
        type: 'value',
        name: '',
        min: 0,
        // max: max,
        // interval: 'auto',
        axisLabel: {
          formatter: '{value}',
          color: 'rgba(0,0,0,.65)'
        },
        axisLine: {
          lineStyle: {
            color: '#BFBFBF'
          }
        },
        splitLine: {
          show: true,
          lineStyle: {
            type: 'dashed'
          }
        }
      }
    ],
    series: [
      {
        name: title,
        type: 'bar',
        barWidth: 45,
        label: {
          show: true,
          position: 'top'
        },
        data: dataList
      }
    ]
  }
}

// 双y轴 柱线图
export function setBarLineChartOption(title, data, legendList) {
  let xAxisList = []
  const seriesData1 = []
  const seriesData2 = []
  if (data.List && data.List.length) {
    data.List[0].map(item => {
      xAxisList.push(item.name)
      seriesData1.push(Number(item.value))
    })
    data.List[1].map(item => {
      seriesData2.push(Number(item.value))
    })
  }
  return {
    grid: {
      top: '15%',
      left: 50
      // containLabel: true
    },
    title: {
      text: title
    },
    color: colorOption,
    tooltip: {
      // trigger: 'item',
      // formatter: `{b}
{a} : {c}`
      formatter: function(params) {
        params.seriesName = params.seriesName === '收款金额' ? '收款金额(万元)' : params.seriesName
        if (params.value) {
          return `${params.name}
 ${params.seriesName}: ${params.value}`
        } else {
          return `${params.name}
 ${params.seriesName}:  0`
        }
      }
    },
    legend: {
      x: 'center',
      y: 'bottom',
      itemWidth: 25,
      data: legendList || []
    },
    xAxis: [
      {
        type: 'category',
        data: xAxisList || [],
        axisLabel: {
          formatter: '{value}',
          // formatter: function (value) {
          //   return value.split('').join('\n')
          // },
          // lineHeight: 20,
          color: 'rgba(0,0,0,.65)'
        },
        axisLine: {
          lineStyle: {
            color: '#BFBFBF'
          }
        }
      }
    ],
    yAxis: [
      // 两个y轴
      {
        type: 'value',
        name: legendList[0] === '收款金额' ? '收款金额(万元)' : legendList[0],
        min: 0,
        // interval: 'auto',
        nameGap: 25, //坐标轴名称与轴线之间的距离
        axisLabel: {
          formatter: '{value}',
          color: 'rgba(0,0,0,.65)'
        },
        axisLine: {
          lineStyle: {
            color: '#BFBFBF'
          }
        },
        splitLine: {
          show: true,
          lineStyle: {
            type: 'dashed'
          }
        }
      },
      {
        type: 'value',
        name: legendList[1],
        min: 0,
        // interval: 'auto',
        nameGap: 25, //坐标轴名称与轴线之间的距离
        axisLabel: {
          formatter: '{value}',
          color: 'rgba(0,0,0,.65)'
        },
        axisLine: {
          lineStyle: {
            color: '#BFBFBF'
          }
        },
        splitLine: {
          show: true,
          lineStyle: {
            type: 'dashed'
          }
        }
      }
    ],
    series: [
      {
        name: legendList[0], // 收款金额
        type: 'bar',
        yAxisIndex: '0',
        boundaryGap: true,
        barWidth: 45,
        /* 设置柱状图颜色 */
        itemStyle: {
          normal: {
            color: 'rgba(24, 144, 255, 0.847)',
            width: 20,
            /* 信息显示方式 */
            label: {
              show: true,
              // position: 'center',
              // formatter: '{b}\n{c}',
              position: 'top'
            }
          }
        },
        data: seriesData2
      },
      //折线设置
      {
        name: legendList[1],
        type: 'line',
        yAxisIndex: '1',
        label: {
          show: true,
          position: 'top'
          // position: 'right'
        },
        itemStyle: {
          /* 设置折线颜色 */
          normal: {
            color: 'rgb(152, 216, 125)'
          }
        },
        data: seriesData1
      }
    ]
  }
}
export function setMapChartOption(title, data) {
  let max = 0
  data.forEach(item => {
    max = Math.max(max, item.value)
    var areaName = item.name.replace(/省|市|自治区|特别行政区|壮族|回族|维吾尔/g, '')
    item.name = areaName
  })
  return {
    // 进行相关配置
    title: {
      text: title,
      left: 'left'
    },
    tooltip: {
      // formatter: '{b}\n{c}',
      formatter: function(params) {
        if (params.value) {
          return params.name + ' : ' + params.value
        } else {
          return params.name + ' : ' + '0'
        }
      }
    }, // 鼠标移到图里面的浮动提示框
    dataRange: {
      show: true,
      min: 0,
      max: max || 1000,
      text: ['High', 'Low'],
      realtime: true,
      calculable: true,
      inRange: {
        color: ['#add5fb', '#65b2fb', '#178efd']
      }
    },
    geo: {
      // 这个是重点配置区
      map: 'china', // 表示中国地图
      // roam: true,
      label: {
        normal: {
          show: true, // 是否显示对应地名
          borderColor: 'rgba(0, 0, 0, 0.1)',
          textStyle: {
            color: 'rgba(0,0,0,0.4)'
          },
          // areaColor: '#ededed' // 地图背景色
          areaColor: '#ededed' // 地图背景色
        }
      },
      itemStyle: {
        normal: {
          areaColor: '#fff',
          borderColor: 'rgba(0, 0, 0, 0.3)'
        },
        emphasis: {
          areaColor: '#178efd',
          shadowOffsetX: 0,
          shadowOffsetY: 0,
          shadowBlur: 20,
          borderWidth: 0,
          shadowColor: 'rgba(0, 0, 0, 0.1)'
        }
      }
    },
    series: [
      {
        type: 'scatter',
        coordinateSystem: 'geo' // 对应上方配置
      },
      {
        name: title, // 浮动框的标题
        type: 'map',
        geoIndex: 0,
        data: data
      }
    ]
  }
}

// 省市区地区图表
export function setProvinceMap(title, data, mapType) {
  let max = 0
  data.forEach(item => {
    max = Math.max(max, item.value)
  })
  data.forEach(item => {
    item.value = Number(item.value) ? Number(item.value) : 0
  })
  return {
    title: {
      text: title,
      subtext: ''
      // x: 'center'
    },
    tooltip: {
      // formatter: '{b}\n{c}',
      formatter: function(params) {
        if (params.value) {
          return params.name + ' : ' + params.value
        } else {
          return params.name + ' : ' + '0'
        }
      }
    },
    // 左侧小导航图标
    visualMap: {
      min: 0,
      text: ['高', '低'],
      inRange: {
        // color: ['#3398DB']
        color: ['white']
      }
    },
    dataRange: {
      show: true,
      min: 0,
      max: max || 1000,
      text: ['High', 'Low'],
      realtime: false,
      calculable: true,
      inRange: {
        color: ['white', '#add5fb', '#178efd']
        // '#65b2fb',
      }
    },
    // 配置属性
    series: [
      {
        name: title,
        type: 'map',
        mapType: mapType,
        roam: true,
        label: {
          normal: {
            show: true, // 省份名称
            borderColor: 'rgba(0, 0, 0, 0.1)',
            textStyle: {
              color: 'rgba(0,0,0,0.4)'
            },
            areaColor: 'white' // 地图背景色
          },
          emphasis: {
            show: true,
            emphasis: {
              areaColor: '#178efd',
              shadowOffsetX: 0,
              shadowOffsetY: 0,
              shadowBlur: 20,
              borderWidth: 0,
              shadowColor: 'rgba(0, 0, 0, 0.1)'
            }
          }
        },
        data: data || []
      }
    ]
  }
}
export default {
  setLineChartOption,
  setPieChartOption,
  setMulLineChartOption,
  setBarChartOption,
  setMapChartOption,
  setBarLineChartOption,
  setTransverseBarChart,
  setProvinceMap
}
总结
给大家分享一下开发echarts的思路:
1.首先找到合适的示例,在echarts官网可以线上运行
https://echarts.apache.org/examples/zh/index.html
2.熟悉echarts配置项,解决一些配置问题
https://echarts.apache.org/zh/option.html#title
echarts开发中的一些坑没更新 ,有问题可以在评论区联系博主

前往低代码交流专区
更多推荐

 1
1 0
0- 0


 已为社区贡献19条内容

所有评论(0)