uniapp中使用echarts,通过renderjs模式封装echarts,兼容APP和H5,一篇就够了!
一、UniApp中使用renderjs1 为什么要使用 renderjs某些h5端使用的插件涉及到大量的dom操作,无法跨端使用。受限于框架视图层与逻辑层的分离而导致的通信折损,而导致的页面动画不流畅。2 renderjs解决了哪些问题renderjs是一种可以直接运行在视图层(webview)中的js技术,可以在视图层操作dom。直接运行在视图层,解决了视图层与逻辑层频繁通信导致的性能折损,让动
一、UniApp中使用renderjs
1 为什么要使用 renderjs
-
某些h5端使用的插件涉及到大量的dom操作,无法跨端使用。
-
受限于框架视图层与逻辑层的分离而导致的通信折损,而导致的页面动画不流畅。
2 renderjs解决了哪些问题
- renderjs是一种可以直接运行在视图层(webview)中的js技术,可以在视图层操作dom。
- 直接运行在视图层,解决了视图层与逻辑层频繁通信导致的性能折损,让动画更流畅。
3 兼容性
| App | H5 |
|---|---|
| 2.5.5+支持 | ✔ |
4 使用方式
设置 script 节点的 lang 为 renderjs
<script module="test" lang="renderjs">
    export default {
        mounted() {
            // ...
        },
        methods: {
            // ...
        }
    }
</script>
5 注意事项
- 目前仅支持内联使用。
- 不要直接引用大型类库,推荐通过动态创建 script 方式引用。
- 可以使用 vue 组件的生命周期不可以使用 App、Page 的生命周期
- 视图层和逻辑层通讯方式与 WXS 一致,另外可以通过 this.$ownerInstance 获取当前组件的 ComponentDescriptor 实例。
- 观测更新的数据在视图层可以直接访问到。
- APP 端视图层的页面引用资源的路径相对于根目录计算,例如:./static/test.js。
- APP 端可以使用 dom、bom API,不可直接访问逻辑层数据,不可以使用 uni 相关接口(如:uni.request)
- H5 端逻辑层和视图层实际运行在同一个环境中,相当于使用 mixin 方式,可以直接访问逻辑层数据。
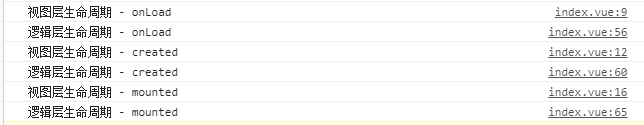
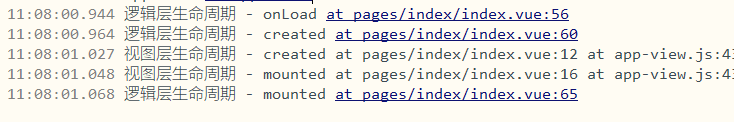
6 renderjs模块内的生命周期
<!--
	H5:所有 UNI 框架的生命周期都可使用
	APP:仅可使用 VUE 组件生命周期
	视图层与逻辑层可以重复定义生命周期,都会执行。
-->

<!-- 逻辑层 -->
<script>
	export default {
        onLoad() {
			console.log('逻辑层生命周期 - onLoad');
		},
		created() {
			console.log('逻辑层生命周期 - created');
		},
		mounted() {
			console.log('逻辑层生命周期 - mounted');
        }
    }
</script>

<!-- 视图层 -->
<script module="moduleName" lang="renderjs" type="module" >
	export default {
        onLoad() {
			console.log('视图层生命周期 - onLoad'); // 页面生命周期 APP 不会执行 H5 会执行
		},
		created() {
			console.log('视图层生命周期 - created'); // 组件生命周期 H5 APP 都会执行,重复定义也会执行,不会被覆盖。
		},
		mounted() {
			console.log('视图层生命周期 - mounted'); // 组件生命周期 H5 APP 都会执行,重复定义也会执行,不会被覆盖。
        }
    }
</script>
7 renderjs模块内的this指向
<!-- 逻辑层 -->
<script>
	export default {
        data() {
            return {
                str:"逻辑层的数据模型"
            }
        },
        methods: {
            test() {
				return "调用逻辑层的方法"
			}
        }
    }
</script>

<!-- 视图层 -->
<script module="moduleName" lang="renderjs" type="module" >
	export default {
		mounted() {
			console.log("尝试获取逻辑层的数据模型",this.str) // H5端可正常打印 APP打印undefined
			console.log("尝试调用逻辑层的方法",this.test()) // H5端可正常调用 APP端报错
        }
    }
</script>


8 视图层和逻辑层的通信方式
视图层可以通过this.$ownerInstance.callMethod('方法名', 传的值) 来和逻辑层进行通信
代码中 :变量名="变量值" :change:变量名=”renderjs模块上的方法“
change就是监听定义的变量发生改变---->触发视图层上的方法----->通过this.$ownerInstance.callMethod('方法名', 传的值)给页面传参---->页面接收值---->渲染页面
示例代码:
<template>
	<view>
		<!-- 监听变量 operation 的变化,operation 发生改变时,调用 test 模块的 loadOperation 方法 -->
		<view :operation="operation" :change:operation="test.loadOperation">
			<!-- 调用 test 模块的 clicked 变量 -->
			test模块:{{test.clicked}}
		</view>
		<br />
		<view>您总共点击了 {{total}} 次</view>
		<br />
		<button @click="onClick">点击</button>
	</view>

</template>

<script>
	export default {
		data() {
			return {
				operation: true,
				total:0,
			}
		},
		methods: {
			onClick(e){
				this.operation = !this.operation
			},
			/**
			 * 接收 renderjs 传过来的数据
			 * @param {Object} data
			 */
			reciveMessage(data) {
				this.total = data;
			}
		}
	}
</script>
<script module="test" lang="renderjs">
	export default {
		data() {
			return {
				clicked: false,
				count: 0
			}
		},
		methods: {
			loadOperation(newValue, oldValue, ownerInstance, instance) {
				// 数据变更
				console.log(newValue,oldValue,ownerInstance,instance)
				this.clicked = newValue;
				// 向uni-app页面组件发送信息
				this.sendMsg();
			},
			sendMsg() {
				// 向页面传参
				this.$ownerInstance.callMethod('reciveMessage', ++this.count)
			},
		}
	}
</script>
<style>

</style>
二、Uniapp中结合renderJS使用echarts
1.echarts引入方式(通过动态创建script方式引用)
html使用echarts的方式:
1.为 ECharts 准备一个具备高宽的 DOM 容器。
<body>
    <!-- 为 ECharts 准备一个具备大小(宽高)的 DOM -->
    <div id="main" style="width: 600px;height:400px;"></div>
</body>
2.通过 echarts.init 方法初始化一个 echarts 实例
 // 基于准备好的dom,初始化echarts实例
 var myChart = echarts.init(document.getElementById('main'));
3.通过 setOption 方法生成一个简单的柱状图,
// 指定图表的配置项和数据
        var option = {
            title: {
                text: 'ECharts 入门示例'
            },
            tooltip: {},
            legend: {
                data:['销量']
            },
            xAxis: {
                data: ["衬衫","羊毛衫","雪纺衫","裤子","高跟鞋","袜子"]
            },
            yAxis: {},
            series: [{
                name: '销量',
                type: 'bar',
                data: [5, 20, 36, 10, 10, 20]
            }]
        };
// 使用指定的配置项和数据显示图表。
 myChart.setOption(option);
renderjs使用echarts的方式:(同html的使用方式大致相同)
1.为 ECharts 准备一个具备高宽的 DOM 容器。
<view class="content">
		<view id="echarts" style="width:100%;height:300rpx"></view>
</view>
2.引入renderjs, 动态引入echarts。原生操作dom 。将echarts引入
3.script标签上的onload事件加载完成后初始化echarts 实例
4.通过 setoption方法生成
<script module="echarts" lang="renderjs">
	let myChart
	export default {
		mounted() {
			if (typeof window.echarts === 'function') {
				myChart = echarts.init(document.getElementById('echarts'))
				// 观测更新的数据在 view 层可以直接访问到
				myChart.setOption(this.option)
			} else {
				// 动态引入较大类库避免影响页面展示
				const script = document.createElement('script')
				// view 层的页面运行在 www 根目录,其相对路径相对于 www 计算
				script.src = 'static/echarts.js'
                //script标签的onload事件都是在外部js文件被加载完成并执行完成后才被触发的
				script.onload = ()=>{
					myChart = echarts.init(document.getElementById('echarts'),)
					myChart.setOption(this.option)
				}
				document.head.appendChild(script)
			}
		},
		methods: {

		}
	}
</script>
三、echarts的主题配置与封装
1.主题配置
主题配置是全局控制echarts的样式
在echarts官网可以可视化定制配置,然后导出json或者js文件。
配置的具体方法:
JS版本
下载或复制以下的主题保存至 *.js 文件;
将该文件在 HTML 中引用;
使用 echarts.init(dom, 'customed') 创建图表,第二个参数即为 *.js 文件中注册的主题名字。
json版本
下载或复制以下的主题保存至 *.json 文件;
读取该 JSON 文件,并使用 obj = JSON.parse(data) 将其转换成对象;
调用 echarts.registerTheme('customed', obj) 注册主题;
使用 echarts.init(dom, 'customed') 创建图表,第二个参数即为刚才注册的主题名字。
在uniapp中可以直接建一个js文件,modules.exports一个对象。然后页面引入使用
// 通用配置项
module.exports = {
    "color": [
        "#5470c6",
        "#91cc75",
        "#fac858",
        "#ee6666",
        "#73c0de",
        "#3ba272",
        "#fc8452",
        "#9a60b4",
        "#ea7ccc"
    ],
    "backgroundColor": "rgba(0, 0, 0, 0)",
    "textStyle": {},
    "title": {
        "textStyle": {
            "color": "#464646"
        },
        "subtextStyle": {
            "color": "#6E7079"
        }
    },
    ....
    ....
    ....
 }
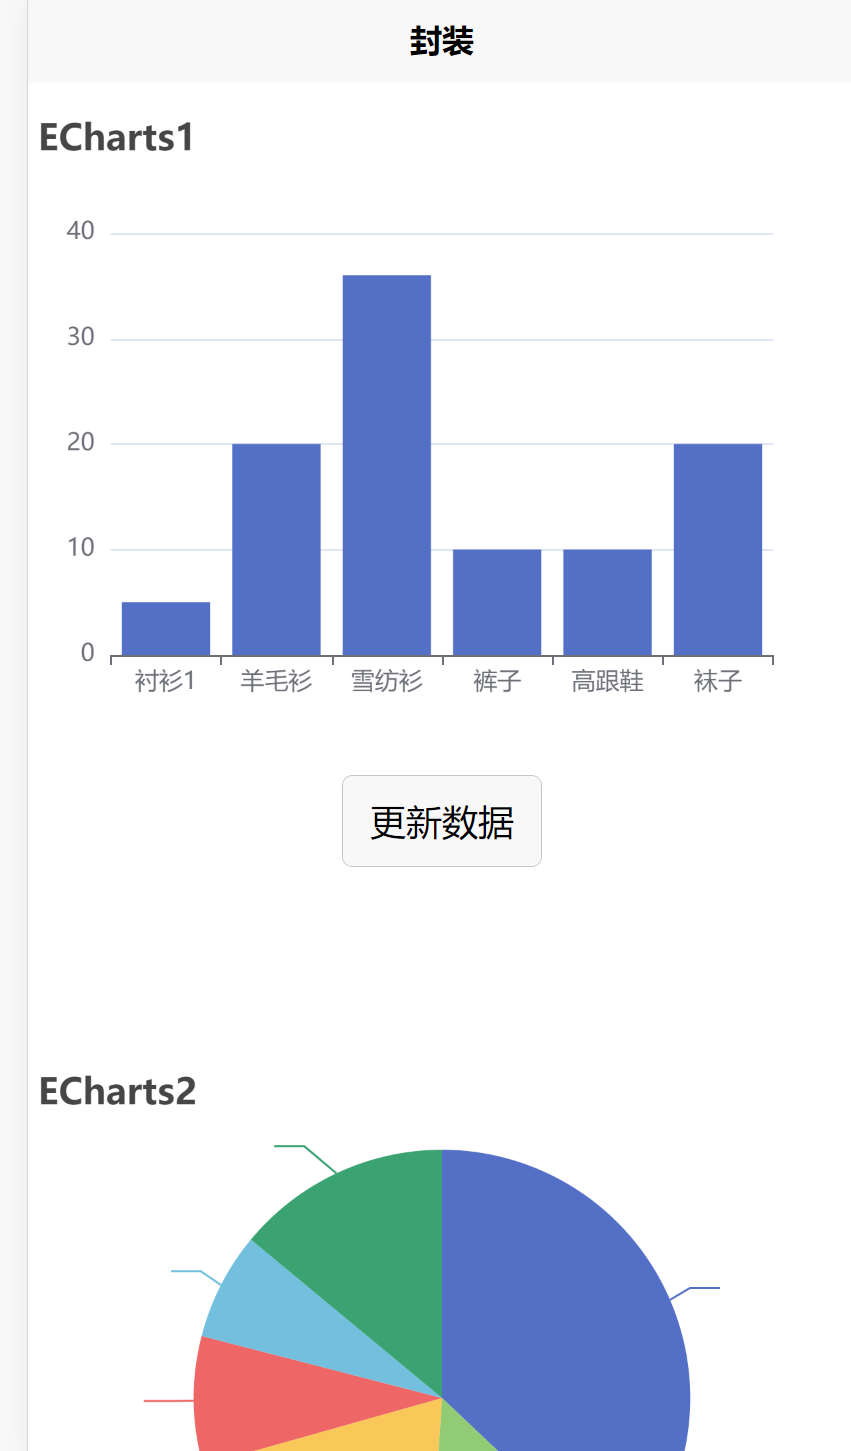
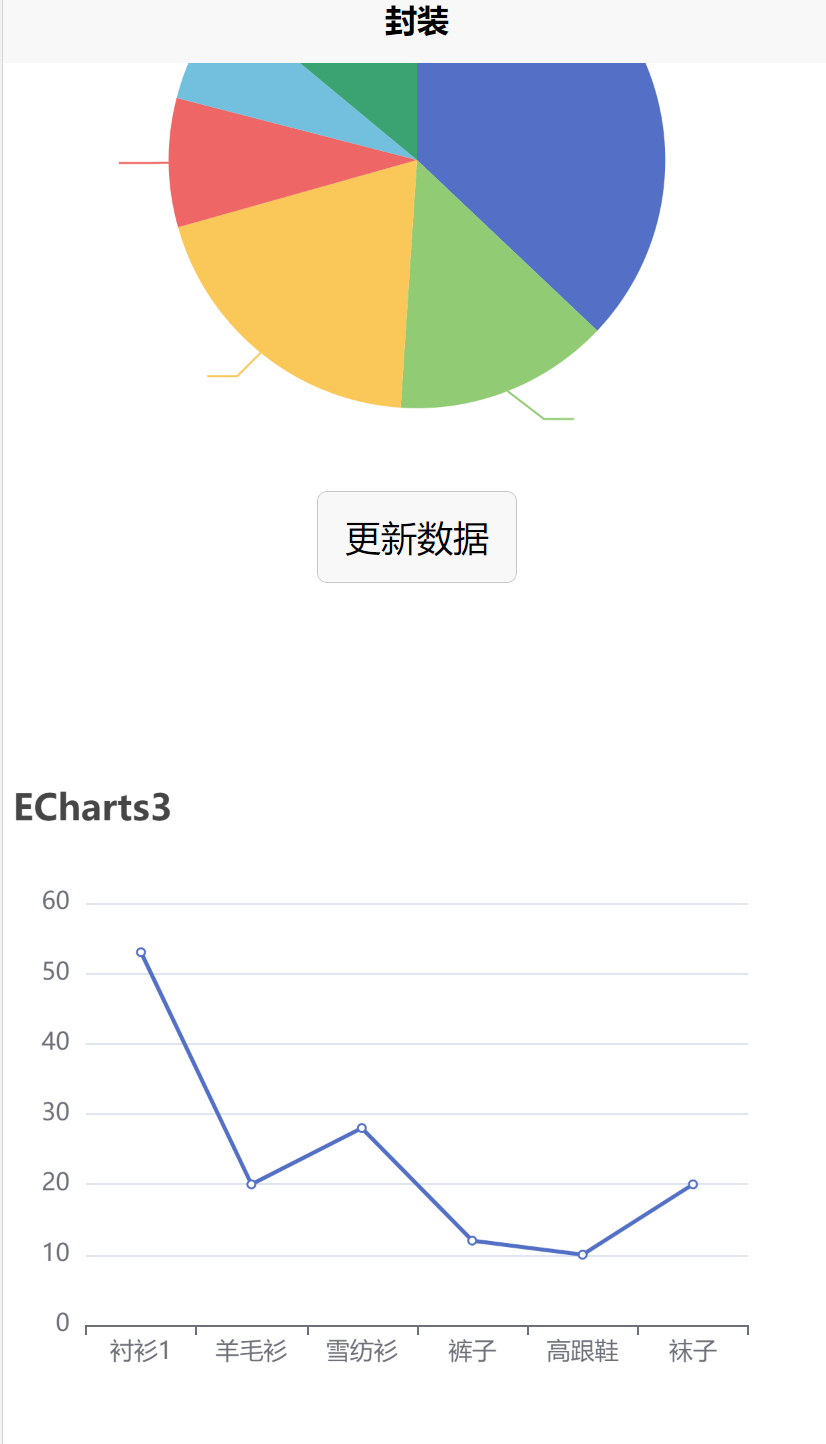
2.使用renderJS封装echarts,实现主题配置
实现效果:一个组件,可以实现不同的图表功能,样式可以全局配置,避免option样式过多
实现思路:
1.在同个页面使用多个图表,id名必须不一致
2.option配置项需改成传参形式
3.主题配置文件
主要代码如下:
<template>
	<view class="content">
		<!-- #ifdef APP-PLUS || H5 -->
		<view @click="echarts.onClick" :prop="optionData" :style="{width:moduleParam.width,height:moduleParam.height}" :change:prop="echarts.updateEcharts"  :moduleParam="moduleParam" :change:moduleParam="echarts.upmoduleParam" :id="moduleParam.id" class="echarts" ></view>
		<!-- <button @click="changeOption">更新数据</button> -->
		<!-- #endif -->
		<!-- #ifndef APP-PLUS || H5 -->
		<view>非 APP、H5 环境不支持</view>
		<!-- #endif -->
	</view>
</template>
<script>

	export default {
		data() {
			return {

			}
		},
		props:{
			moduleParam:{
				type:Object,
				default:()=>{
					id: "myCharts";
					width: "100%";
					height: "300rpx"
				}
			},
			optionData:{
				type:Object,
				default:()=>{}
			}
		},
		onLoad() {

		},
		methods: {
			changeOption() {
				// 父组件刷新数据
				this.$emit("changeOption")
			},
			onViewClick(options) {
				this.$emit("getClickData",options)
			}
		}
	}
</script>

<script module="echarts" lang="renderjs">
	import echartsConfig from '@/common/echarts-config.js'
	let myChart
	export default {
		data(){
			return{
				clickData:null
			}
		},
		mounted() {
			if (typeof window.echarts === 'function') {
				this.initEcharts()
			} else {
				// 动态引入较大类库避免影响页面展示
				const script = document.createElement('script')
				// view 层的页面运行在 www 根目录,其相对路径相对于 www 计算
				script.src = 'static/echarts.min.js'
				script.onload = this.initEcharts.bind(this)
				document.head.appendChild(script)
			}
		},
		methods: {
			initEcharts(){
				echarts.registerTheme('echartsConfig',echartsConfig )  //注册主题
				myChart = echarts.init(document.getElementById(this.moduleParam.id),"echartsConfig")
				// 观测更新的数据在 view 层可以直接访问到
				myChart.setOption(this.optionData)
				// 点击传参
				myChart.on('click', params => {
					// console.log(params)
					this.clickData = params
				})
			},
			updateEcharts(newValue, oldValue, ownerInstance, instance) {
				// 监听 service 层数据变更
				console.log(newValue)
				myChart = echarts.init(document.getElementById(this.moduleParam.id),"echartsConfig")
				myChart.setOption(newValue)
			},
			upmoduleParam(newvalue,oldvalue){},
			onClick(event, ownerInstance) {
				// console.log(this.clickData)
				if(!this.clickData){
					return
				}
				ownerInstance.callMethod('onViewClick',{
					value:this.clickData.value,
					name:this.clickData.name,
					dataIndex:this.clickData.dataIndex,
					seriesName:this.clickData.seriesName
				})
				// 上次点击数据置空
				this.clickData = null
			}
		}
	}
</script>

<style>
	.content {
		display: flex;
		flex-direction: column;
		align-items: center;
		justify-content: center;
	}

	.echarts {
		width: 100%;
		height: 600rpx;
	}
</style>
主题配置文件
// 通用配置项
module.exports = {
    "color": [
        "#5470c6",
        "#91cc75",
        "#fac858",
        "#ee6666",
        "#73c0de",
        "#3ba272",
        "#fc8452",
        "#9a60b4",
        "#ea7ccc"
    ],
    "backgroundColor": "rgba(0, 0, 0, 0)",
    "textStyle": {},
    "title": {
        "textStyle": {
            "color": "#464646"
        },
        "subtextStyle": {
            "color": "#6E7079"
        }
    },
    "line": {
        "itemStyle": {
            "borderWidth": 1
        },
        "lineStyle": {
            "width": 2
        },
        "symbolSize": 4,
        "symbol": "emptyCircle",
        "smooth": false
    },
    "radar": {
        "itemStyle": {
            "borderWidth": 1
        },
        "lineStyle": {
            "width": 2
        },
        "symbolSize": 4,
        "symbol": "emptyCircle",
        "smooth": false
    },
    "bar": {
        "itemStyle": {
            "barBorderWidth": 0,
            "barBorderColor": "#ccc"
        }
    },
    "pie": {
        "itemStyle": {
            "borderWidth": 0,
            "borderColor": "#ccc"
        }
    },
    "scatter": {
        "itemStyle": {
            "borderWidth": 0,
            "borderColor": "#ccc"
        }
    },
    "boxplot": {
        "itemStyle": {
            "borderWidth": 0,
            "borderColor": "#ccc"
        }
    },
    "parallel": {
        "itemStyle": {
            "borderWidth": 0,
            "borderColor": "#ccc"
        }
    },
    "sankey": {
        "itemStyle": {
            "borderWidth": 0,
            "borderColor": "#ccc"
        }
    },
    "funnel": {
        "itemStyle": {
            "borderWidth": 0,
            "borderColor": "#ccc"
        }
    },
    "gauge": {
        "itemStyle": {
            "borderWidth": 0,
            "borderColor": "#ccc"
        }
    },
    "candlestick": {
        "itemStyle": {
            "color": "#eb5454",
            "color0": "#47b262",
            "borderColor": "#eb5454",
            "borderColor0": "#47b262",
            "borderWidth": 1
        }
    },
    "graph": {
        "itemStyle": {
            "borderWidth": 0,
            "borderColor": "#ccc"
        },
        "lineStyle": {
            "width": 1,
            "color": "#aaa"
        },
        "symbolSize": 4,
        "symbol": "emptyCircle",
        "smooth": false,
        "color": [
            "#5470c6",
            "#91cc75",
            "#fac858",
            "#ee6666",
            "#73c0de",
            "#3ba272",
            "#fc8452",
            "#9a60b4",
            "#ea7ccc"
        ],
        "label": {
            "color": "#eee"
        }
    },
    "map": {
        "itemStyle": {
            "normal": {
                "areaColor": "#eee",
                "borderColor": "#444",
                "borderWidth": 0.5
            },
            "emphasis": {
                "areaColor": "rgba(255,215,0,0.8)",
                "borderColor": "#444",
                "borderWidth": 1
            }
        },
        "label": {
            "normal": {
                "textStyle": {
                    "color": "#000"
                }
            },
            "emphasis": {
                "textStyle": {
                    "color": "rgb(100,0,0)"
                }
            }
        }
    },
    "geo": {
        "itemStyle": {
            "normal": {
                "areaColor": "#eee",
                "borderColor": "#444",
                "borderWidth": 0.5
            },
            "emphasis": {
                "areaColor": "rgba(255,215,0,0.8)",
                "borderColor": "#444",
                "borderWidth": 1
            }
        },
        "label": {
            "normal": {
                "textStyle": {
                    "color": "#000"
                }
            },
            "emphasis": {
                "textStyle": {
                    "color": "rgb(100,0,0)"
                }
            }
        }
    },
    "categoryAxis": {
        "axisLine": {
            "show": true,
            "lineStyle": {
                "color": "#6E7079"
            }
        },
        "axisTick": {
            "show": true,
            "lineStyle": {
                "color": "#6E7079"
            }
        },
        "axisLabel": {
            "show": true,
            "textStyle": {
                "color": "#6E7079"
            }
        },
        "splitLine": {
            "show": false,
            "lineStyle": {
                "color": [
                    "#E0E6F1"
                ]
            }
        },
        "splitArea": {
            "show": false,
            "areaStyle": {
                "color": [
                    "rgba(250,250,250,0.2)",
                    "rgba(210,219,238,0.2)"
                ]
            }
        }
    },
    "valueAxis": {
        "axisLine": {
            "show": false,
            "lineStyle": {
                "color": "#6E7079"
            }
        },
        "axisTick": {
            "show": false,
            "lineStyle": {
                "color": "#6E7079"
            }
        },
        "axisLabel": {
            "show": true,
            "textStyle": {
                "color": "#6E7079"
            }
        },
        "splitLine": {
            "show": true,
            "lineStyle": {
                "color": [
                    "#E0E6F1"
                ]
            }
        },
        "splitArea": {
            "show": false,
            "areaStyle": {
                "color": [
                    "rgba(250,250,250,0.2)",
                    "rgba(210,219,238,0.2)"
                ]
            }
        }
    },
    "logAxis": {
        "axisLine": {
            "show": false,
            "lineStyle": {
                "color": "#6E7079"
            }
        },
        "axisTick": {
            "show": false,
            "lineStyle": {
                "color": "#6E7079"
            }
        },
        "axisLabel": {
            "show": true,
            "textStyle": {
                "color": "#6E7079"
            }
        },
        "splitLine": {
            "show": true,
            "lineStyle": {
                "color": [
                    "#E0E6F1"
                ]
            }
        },
        "splitArea": {
            "show": false,
            "areaStyle": {
                "color": [
                    "rgba(250,250,250,0.2)",
                    "rgba(210,219,238,0.2)"
                ]
            }
        }
    },
    "timeAxis": {
        "axisLine": {
            "show": true,
            "lineStyle": {
                "color": "#6E7079"
            }
        },
        "axisTick": {
            "show": true,
            "lineStyle": {
                "color": "#6E7079"
            }
        },
        "axisLabel": {
            "show": true,
            "textStyle": {
                "color": "#6E7079"
            }
        },
        "splitLine": {
            "show": false,
            "lineStyle": {
                "color": [
                    "#E0E6F1"
                ]
            }
        },
        "splitArea": {
            "show": false,
            "areaStyle": {
                "color": [
                    "rgba(250,250,250,0.2)",
                    "rgba(210,219,238,0.2)"
                ]
            }
        }
    },
    "toolbox": {
        "iconStyle": {
            "normal": {
                "borderColor": "#999"
            },
            "emphasis": {
                "borderColor": "#666"
            }
        }
    },
    "legend": {
        "textStyle": {
            "color": "#333"
        }
    },
    "tooltip": {
        "axisPointer": {
            "lineStyle": {
                "color": "#ccc",
                "width": 1
            },
            "crossStyle": {
                "color": "#ccc",
                "width": 1
            }
        }
    },
    "timeline": {
        "lineStyle": {
            "color": "#DAE1F5",
            "width": 2
        },
        "itemStyle": {
            "normal": {
                "color": "#A4B1D7",
                "borderWidth": 1
            },
            "emphasis": {
                "color": "#FFF"
            }
        },
        "controlStyle": {
            "normal": {
                "color": "#A4B1D7",
                "borderColor": "#A4B1D7",
                "borderWidth": 1
            },
            "emphasis": {
                "color": "#A4B1D7",
                "borderColor": "#A4B1D7",
                "borderWidth": 1
            }
        },
        "checkpointStyle": {
            "color": "#316bf3",
            "borderColor": "fff"
        },
        "label": {
            "normal": {
                "textStyle": {
                    "color": "#A4B1D7"
                }
            },
            "emphasis": {
                "textStyle": {
                    "color": "#A4B1D7"
                }
            }
        }
    },
    "visualMap": {
        "color": [
            "#bf444c",
            "#d88273",
            "#f6efa6"
        ]
    },
    "dataZoom": {
        "handleSize": "undefined%",
        "textStyle": {}
    },
    "markPoint": {
        "label": {
            "color": "#eee"
        },
        "emphasis": {
            "label": {
                "color": "#eee"
            }
        }
    }
}
页面引用:
<template>
	<view class="content">
		<dom-echart :moduleParam="moduleParam1" :optionData="option"  @changeOption="changeOption()"></dom-echart>
		<dom-echart :moduleParam="moduleParam2" :optionData="option1" @changeOption="changeOption1()"></dom-echart>
		<dom-echart :moduleParam="moduleParam3" :optionData="option2" @changeOption="changeOption2()"></dom-echart>
	</view>
</template>

<script>
	import domEchart from './index/index.vue'
	export default {
		components:{
			domEchart
		},
		data() {
			return {
				moduleParam1:{
					id:"moId1",
				},
				moduleParam2:{
					id:"moId2",
				},
				moduleParam3:{
					id:"moId3",
				},
				option: {
					title: {
						text: 'ECharts1'
					},
					xAxis: {
						data: ["衬衫1", "羊毛衫", "雪纺衫", "裤子", "高跟鞋", "袜子"]
					},
					yAxis: {},
					series: [{
						name: '销量',
						type: 'bar',
						data: [5, 20, 36, 10, 10, 20]
					}]
				},
				option1: {
					title: {
						text: 'ECharts2'
					},
					series: [{
						name: '销量',
						type: 'pie',
						data: [53, 20, 28, 12, 10, 20]
					}]
				},
				option2: {
					title: {
						text: 'ECharts3'
					},
					xAxis: {
						data: ["衬衫1", "羊毛衫", "雪纺衫", "裤子", "高跟鞋", "袜子"]
					},
					yAxis: {},
					series: [{
						name: '销量',
						type: 'line',
						data: [53, 20, 28, 12, 10, 20]
					}]
				}
				}
		},
		onLoad() {

		},
		methods: {
			changeOption(){
				const data = this.option.series[0].data
				// 随机更新示例数据
				data.forEach((item, index) => {
					data.splice(index, 1, Math.random() * 40)
				})
			},

			changeOption1(){
				const data = this.option1.series[0].data
				// 随机更新示例数据
				data.forEach((item, index) => {
					data.splice(index, 1, Math.random() * 40)
				})
			},
			changeOption2(){
				const data = this.option2.series[0].data
				// 随机更新示例数据
				data.forEach((item, index) => {
					data.splice(index, 1, Math.random() * 40)
				})
			}
		}
	}
</script>

<style>
</style>
实现效果
dome源码请移步gitee:https://gitee.com/shen-miaoxin/uniapp-renderjs-echarts
点个小星星~

为开发者提供学习成长、分享交流、生态实践、资源工具等服务,帮助开发者快速成长。
更多推荐


 7
7 0
0- 0


 已为社区贡献1条内容

所有评论(0)