
STATA学习笔记:分组统计和分组回归
STATA学习笔记:分组统计和分组回归1. 分组统计(1)对一个类别变量进行统计时tabulate命令tabulate oneway//for one-way tables of frequenciestabulate twoway//for two-way tables of frequenciesgraph bar命令graph baryvars [if] [in] [weight] [, o
STATA学习笔记:分组统计和分组回归
1. 分组统计
(1)对一个类别变量进行统计时
tabulate命令
tabulate oneway
//for one-way tables of frequencies
tabulate twoway
//for two-way tables of frequencies
graph bar命令
graph bar yvars [if] [in] [weight] [, options]
*graph bar draws vertical bar charts.
*In a vertical bar chart, the y axis is numerical,
*and the x axis is categorical.
graph hbar yvars [if] [in] [weight] [, options]
*graph hbar draws horizontal bar charts.
*In a horizontal bar chart, the numerical axis is still called the y axis,
*and the categorical axis is still
*called the x axis, but y is presented horizontally, and x vertically.
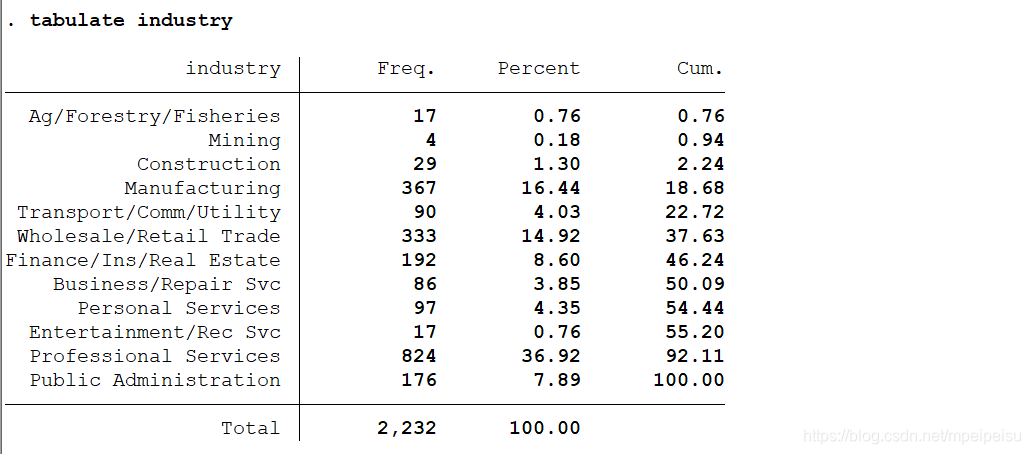
sysuse nlsw88.dta, clear
tabulate industry
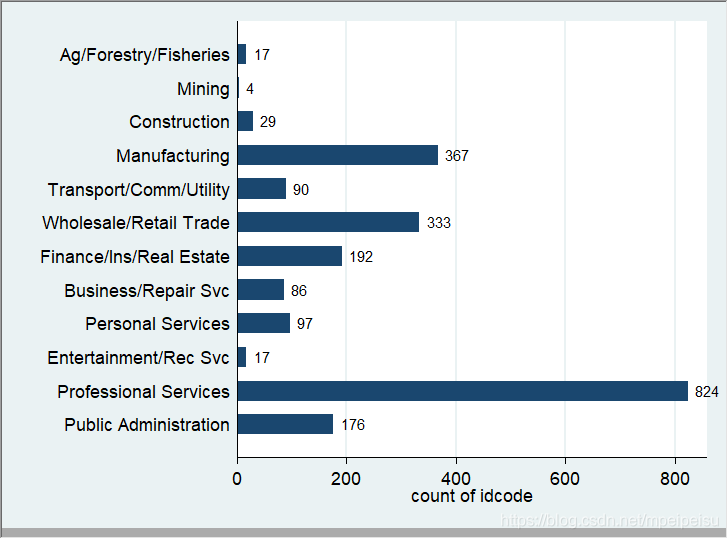
graph bar (count) idcode,over (industry)

graph hbar (count) idcode,over (industry) blabel(bar,position(outside))
//blabel选项为添加
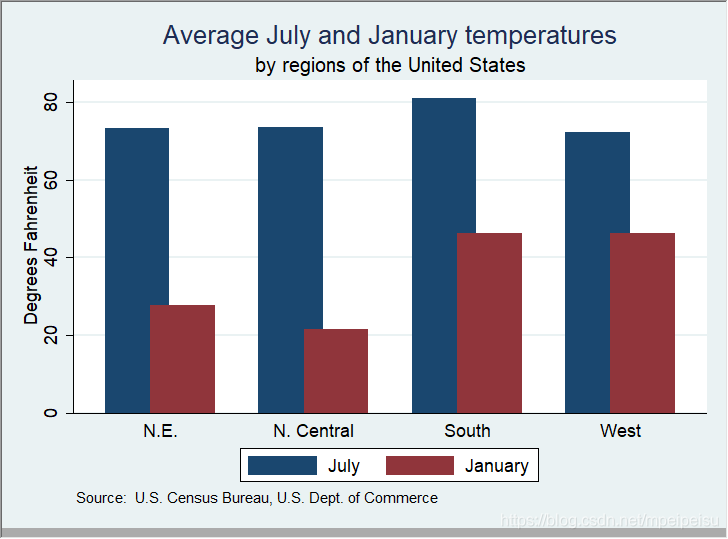
sysuse citytemp
graph bar (mean) tempjuly tempjan, over(region)   ///
bargap(-30)   ///
legend( label(1 "July") label(2 "January") )   ///
ytitle("Degrees Fahrenheit")   ///
title("Average July and January temperatures")   ///
subtitle("by regions of the United States")   ///
note("Source:  U.S. Census Bureau, U.S. Dept. of Commerce")
graph pie命令
graph pie,over(industry)
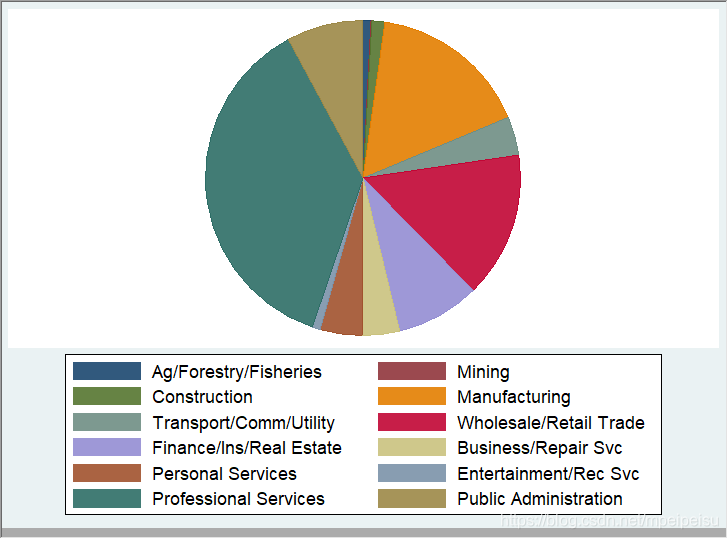
graph pie,over(industry) sort
//按照饼块大小排序,更清晰

(2)对多个类别变量进行统计时
tabulate命令
sysuse nlsw88.dta, clear
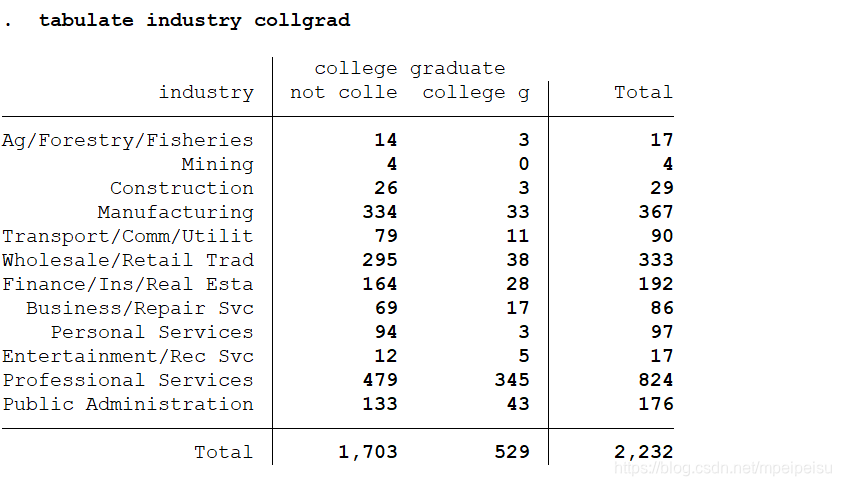
tabulate industry collgrad
//显示每一个行业下没有大学文凭和有大学文凭的妇女的人数
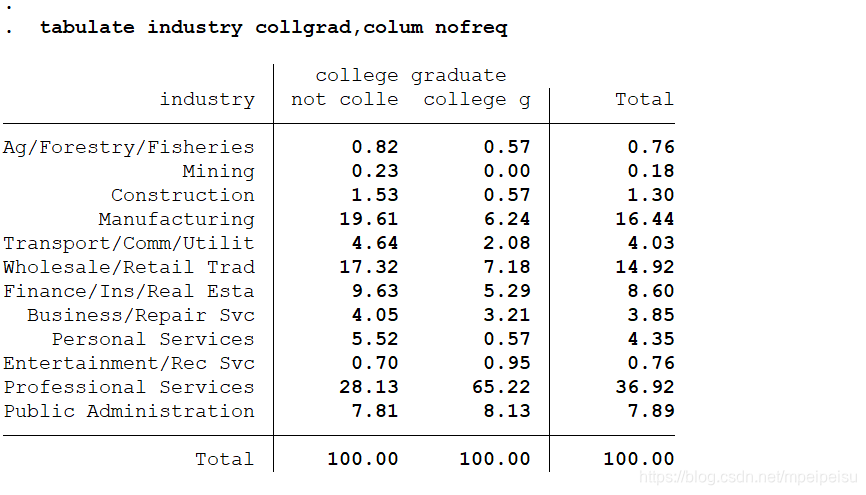
tabulate industry collgrad,colum nofreq
//不显示frequency,计算每一个行业下的有文凭的妇女和没有文凭的妇女分别占妇女总人数的比重
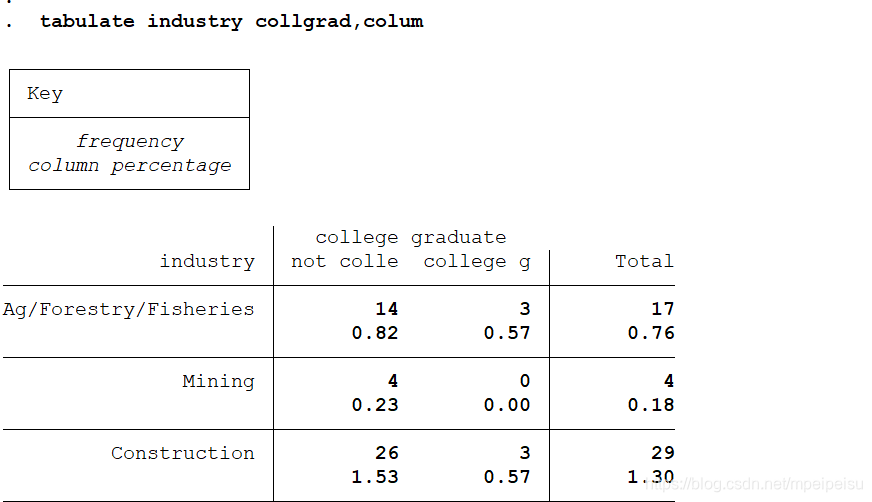
 tabulate industry collgrad,colum
 //既显示人数,也显示比重
sysuse nlsw88.dta, clear
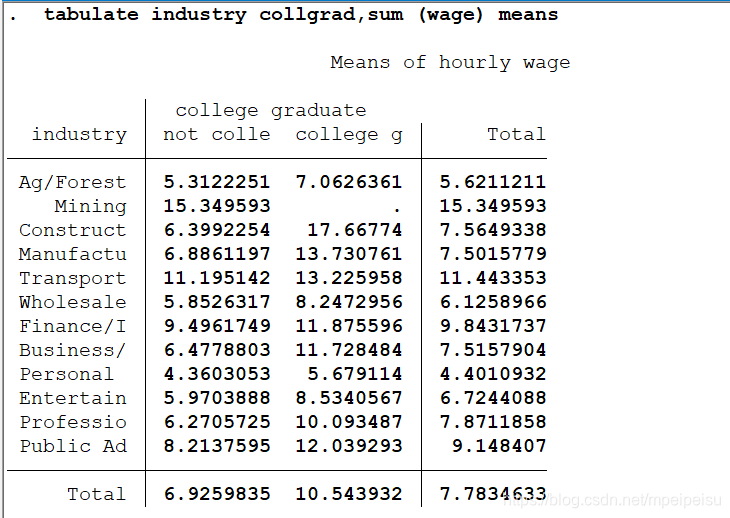
tabulate industry collgrad,sum (wage) means
//以行业和是否大学毕业作为分组依据,统计每一组的wage均值
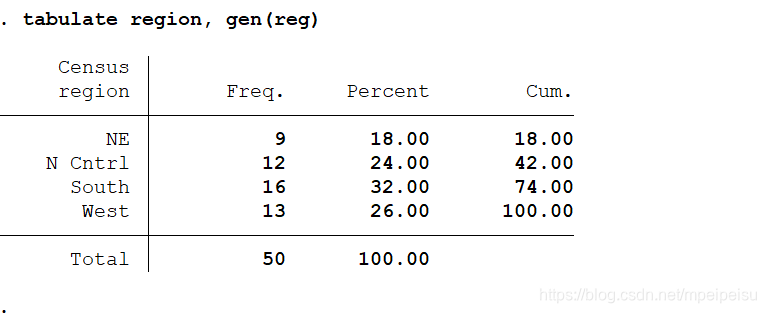
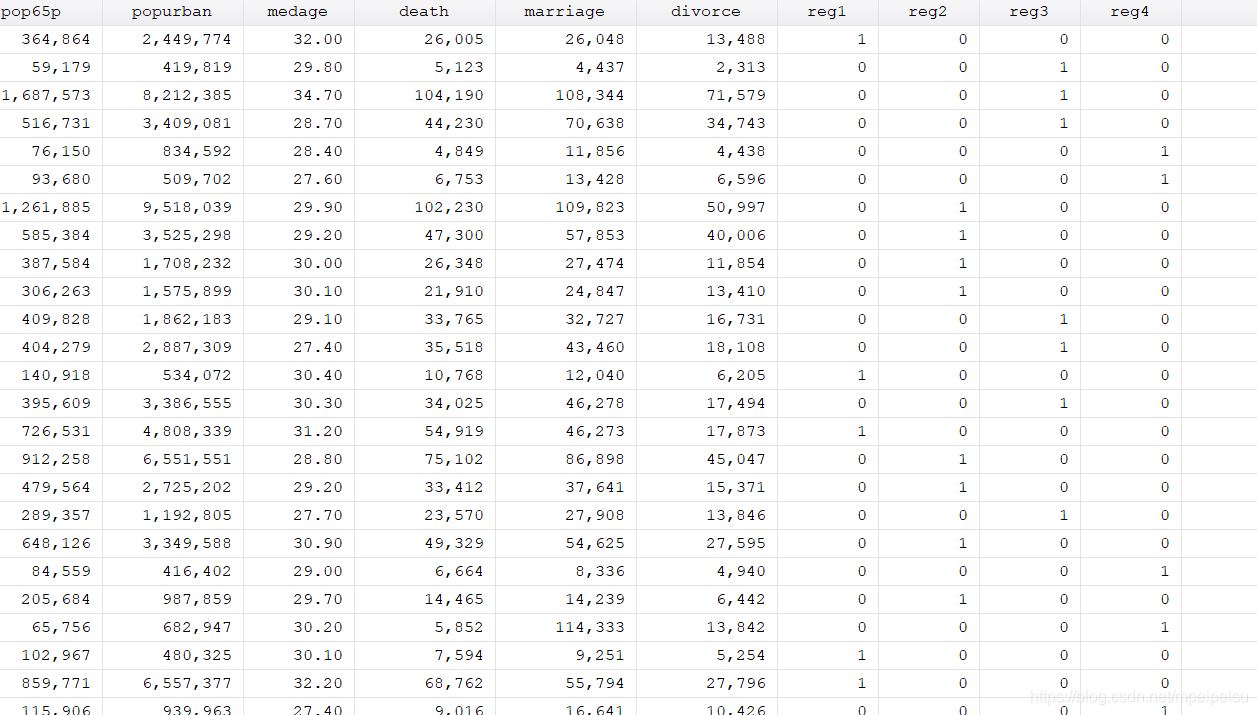
sysuse census
tabulate region, gen(reg)
//基于地区分组,对每个地区分别产生一个虚拟变量reg
graph bar命令
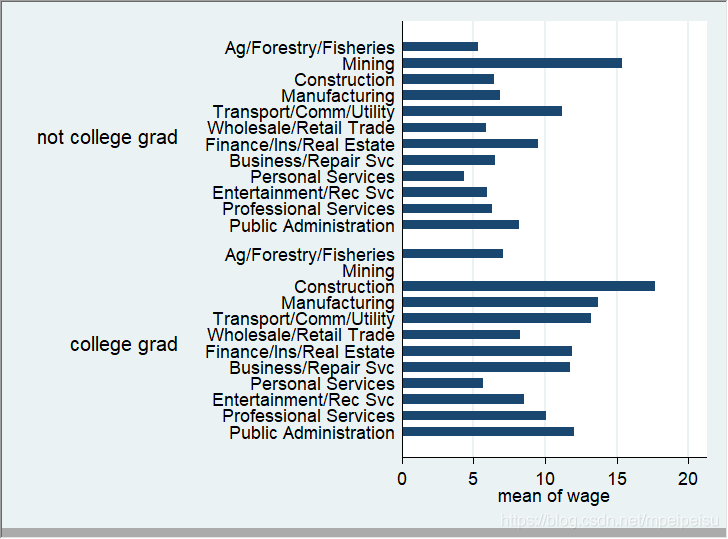
sysuse nlsw88.dta, clear
graph hbar (mean) wage, over(industry) over(collgrad)
//graph bar基于两个类别变量分组时,要用两个over
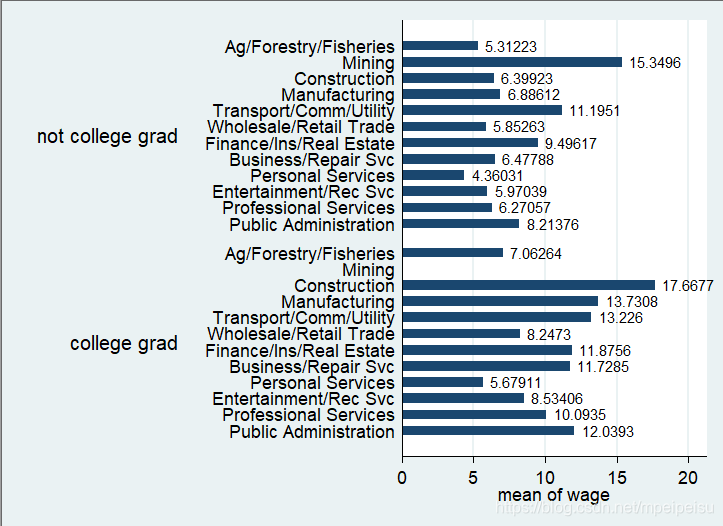
sysuse nlsw88.dta, clear
graph hbar (mean) wage, over(industry) over(collgrad)  ///
blabel(bar, position(outside))
//注意:当使用“///”对一条过长的命令进行分行时,每一行末尾的“///”和该行最后的字母之间要有两个空格以上的距离
外部命令tabplot
Description
tabplot plots a table of numerical values (for example, frequencies, fractions, or percents) in graphical form as a bar chart.  It is mainly intended
for representing contingency tables for one, two, or three categorical variables.  It also has uses for producing multiple histograms and graphs for
general one-, two-, or three-way tables.
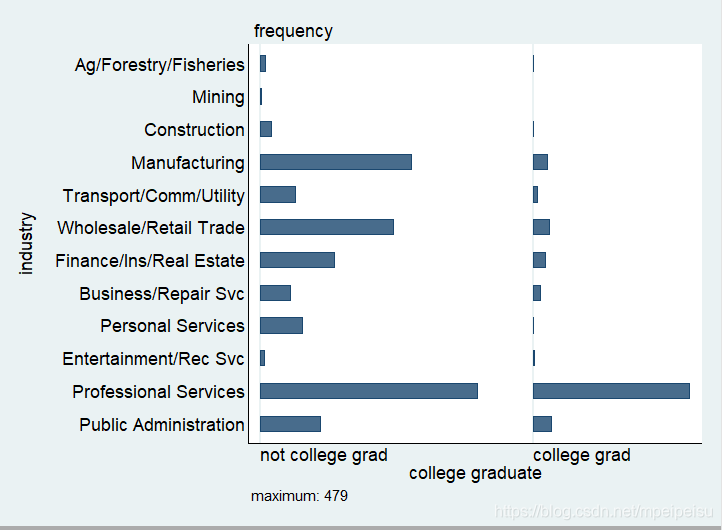
tabplot industry collgrad
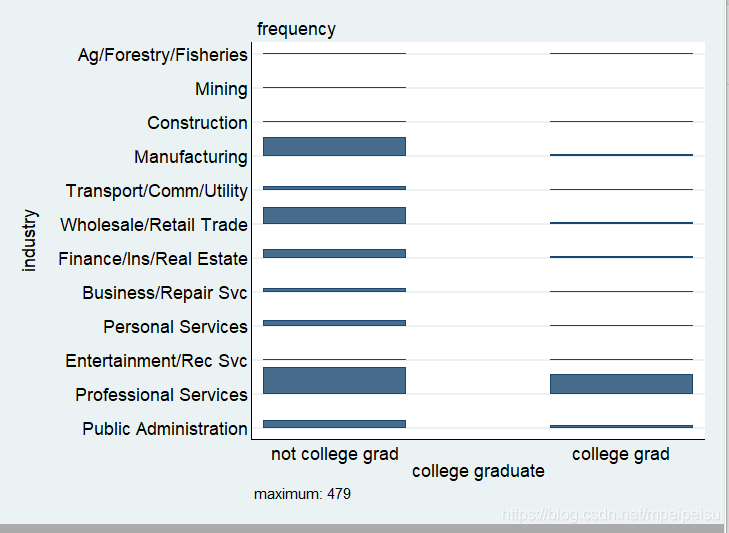
tabplot industry collgrad, horizontal
选项showval
showval specifies that numeric values be shown beneath (or if horizontal is specified, to the left of) bars.
tabplot, showval(offset(#))
//specifies an offset between the base (or left-hand edge) of the bar
//and the position of the numeric value.  Default is 0.1
//with two variables or 0.02 with one variable.
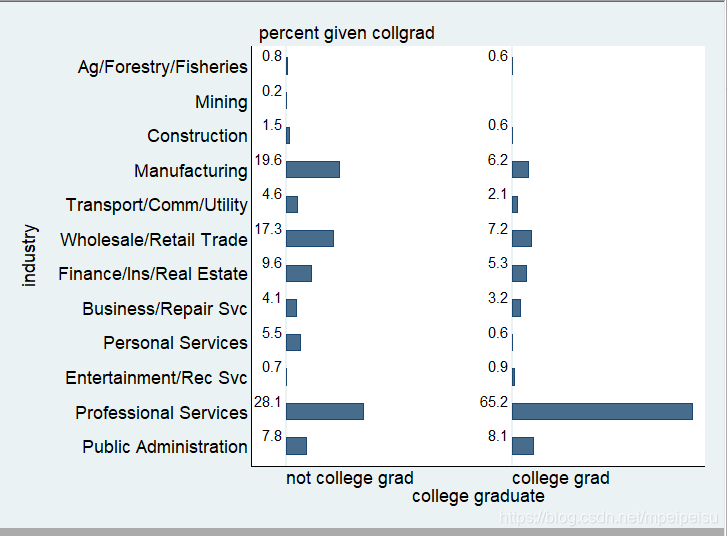
tabplot, percent()
选项percent
percent(varlist) indicates that all frequencies should be shown as percents (with sum 100) of the total frequency for each distinct category defined by the combinations of varlist. Usually, varlist will be one or more of the variables specified.
tabplot industry collgrad, horizontal   ///
percent(collgrad)  showval(offset(0.05))
2. 将连续变量转化为类别变量,继而分组统计/回归
(1)group命令
a. 分组
sysuse nlsw88, clear
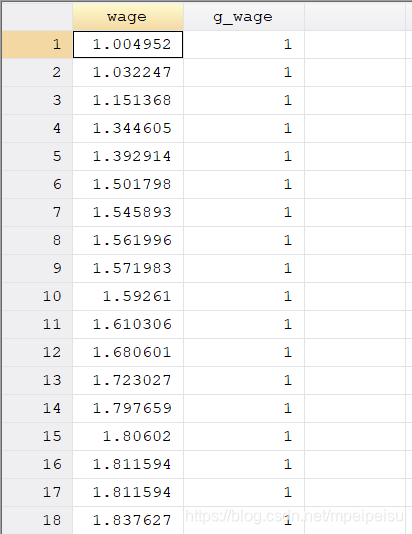
sort wage
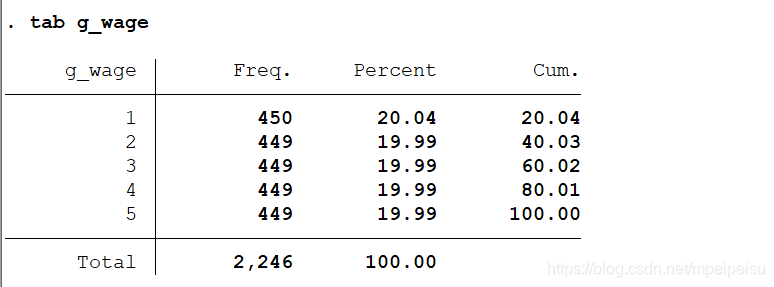
gen g_wage = group(5)
//将工资按大小排列后,等分为5组
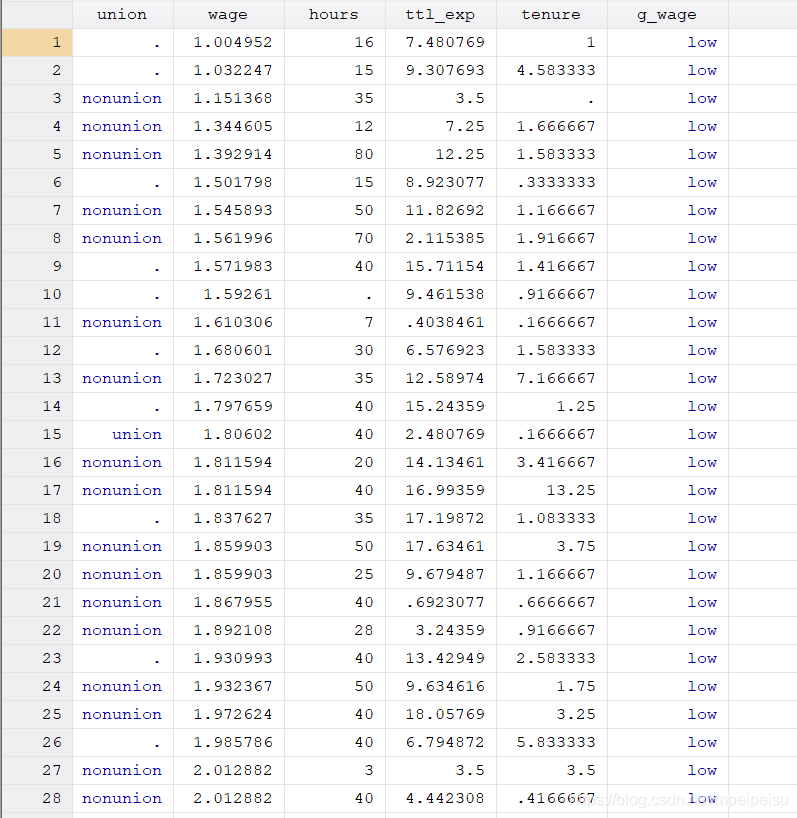
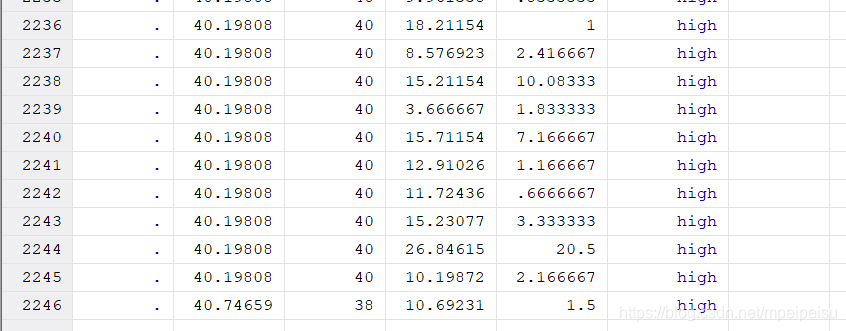
br wage g_wage
tab g_wage
//显示每一个工资档共有多少数据
b. 为新生成的类别变量g_wage添加value labels
复习:STATA学习笔记-变量-变量标签
sysuse nlsw88, clear
sort wage
gen g_wage = group(5)
br wage g_wage
tab g_wage
//为g_wage的1,2,3,4,5添加值标签
//分两步走:
//第一步:label define
label define la_gwage 1 "low" 5 "high"
//第二步:label values
label values g_wage la_gwage
c. 统计分析
c.1 help tabstat
tabstat命令
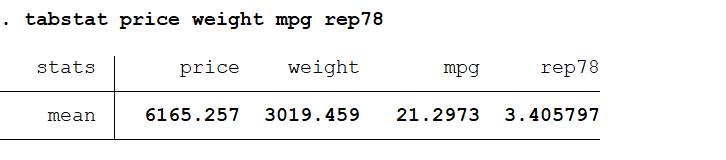
sysuse auto,clear
tabstat price weight mpg rep78
//Show the mean (by default) of price, weight, mpg, and rep78
sysuse auto,clear
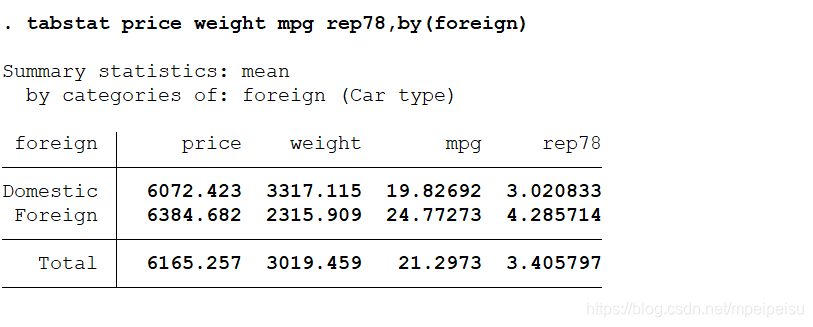
tabstat price weight mpg rep78,by(foreign)
//Show the mean (by default) of price, weight, mpg, and rep78 by categories of foreign
sysuse auto,clear
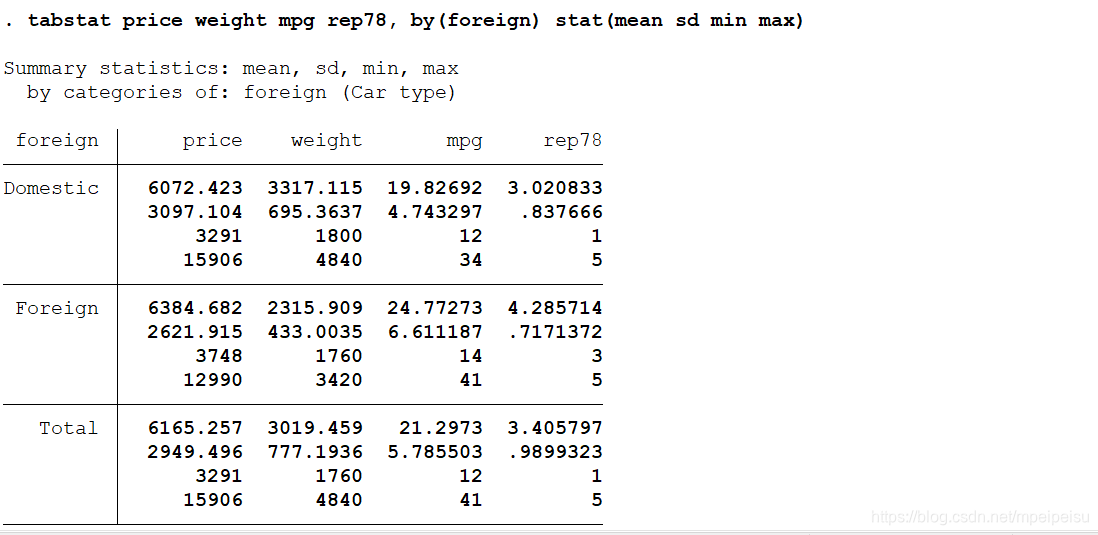
tabstat price weight mpg rep78, by(foreign) stat(mean sd min max)
//In addition to mean, show standard deviation, minimum, and maximum
c.2 tabstat,by(g_wage)
sysuse nlsw88, clear
sort wage
gen g_wage = group(5)
br wage g_wage
tab g_wage
//为g_wage的1,2,3,4,5添加值标签
//分两步走:
//第一步:label define
label define la_gwage 1 "low" 5 "high"
//第二步:label values
label values g_wage la_gwage
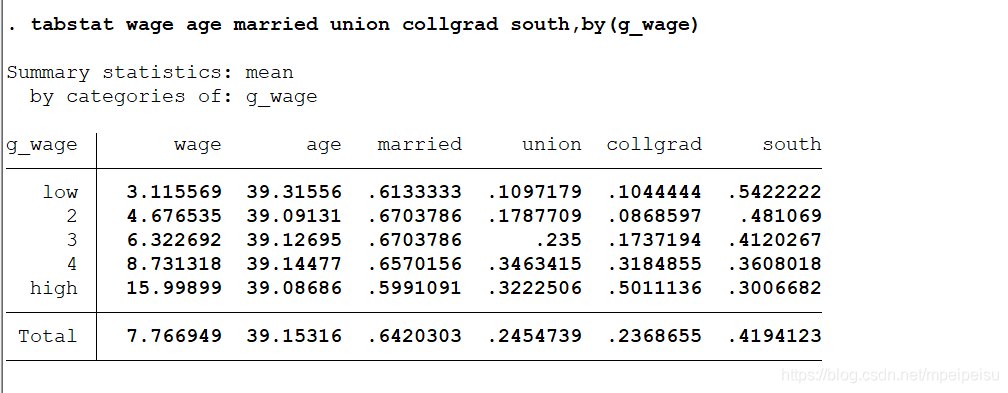
tabstat wage age married union collgrad south,by(g_wage)
(2)外部命令 quantiles分组
Description
quantiles creates a new variable (newvar) that categorizes varname by its quantiles. It differs from xtile because the categories are defined by the
ideal size of the quantile rather than by the cutpoints, therefore yielding less unequaly sized categories when the cutpoint value is frequent, when
using weights or when the number of observations in the dataset is not a product of the number of quantiles. It may not work properly on small
datasets or if calculated for small groups. If the number of observations in the dataset or group is small, tabulate newvar afterwards to check the
results.
quantiles "var", gen "new_varname"
//gencatvar(newvar) specifies the new variable to be generated
quantiles var,nquant()
// specifies the number of quantiles; # must be an integer and greater than or equal to 2. If not specified default is 10 quantiles
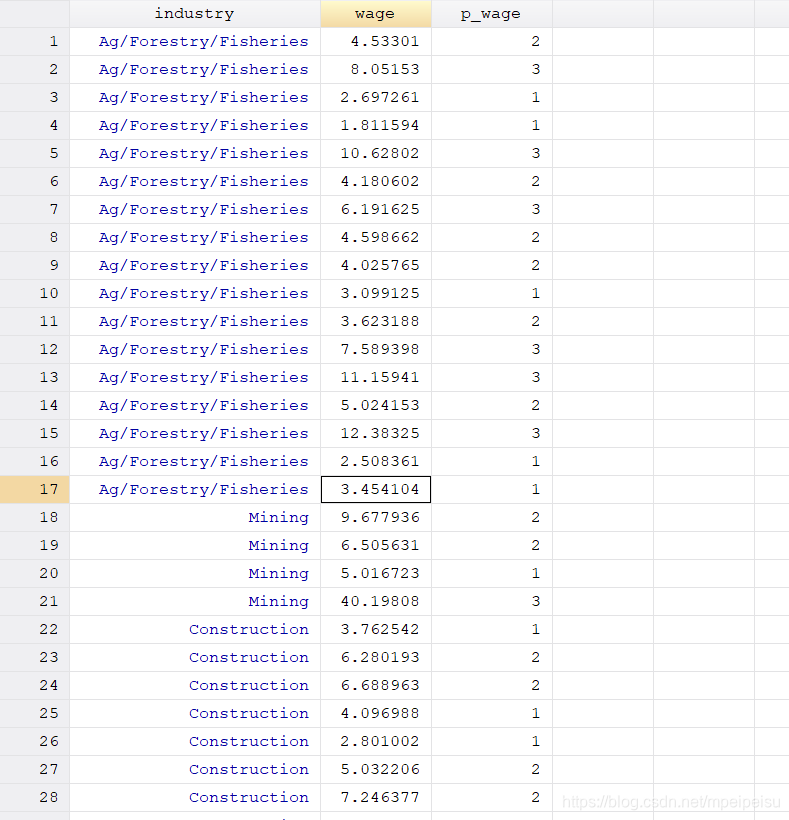
bysort industry: quantiles wage, gen(p_wage) nq(3)
//按行业分组之后,把每个行业内部的wage按33th,66th分成3组
//每一个行业对应一个类别变量p_wage,有三个值:1,2,3
3.分组回归
sysuse nlsw88, clear
sort wage
gen g_wage = group(5)
br wage g_wage
tab g_wage
//为g_wage的1,2,3,4,5添加值标签
//分两步走:
//第一步:label define
label define la_gwage 1 "low" 5 "high"
//第二步:label values
label values g_wage la_gwage
tabstat wage age married union collgrad south,by(g_wage)
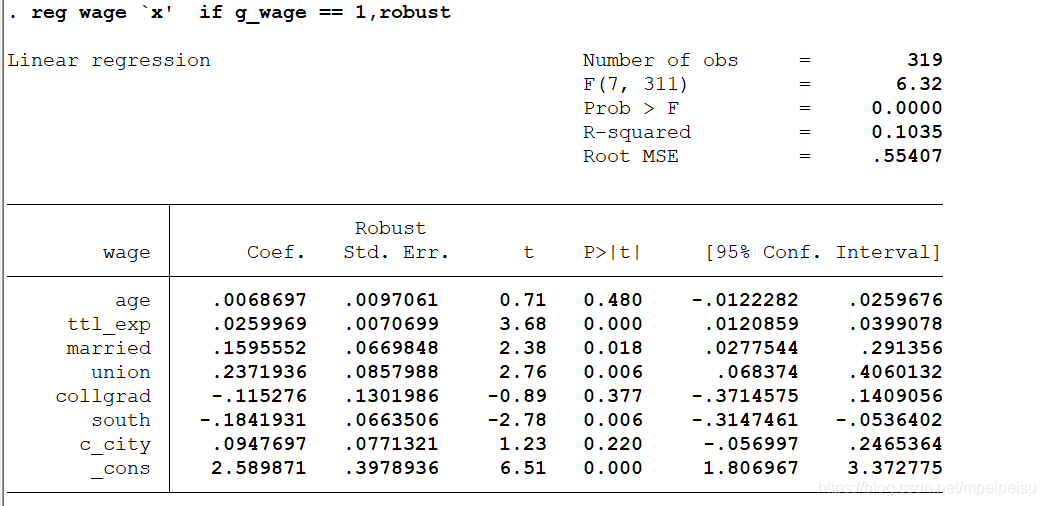
local x "age ttl_exp married union collgrad south c_city"
//对g_wage=1的数据进行回归
reg wage `x' if g_wage == 1,robust
est store Low
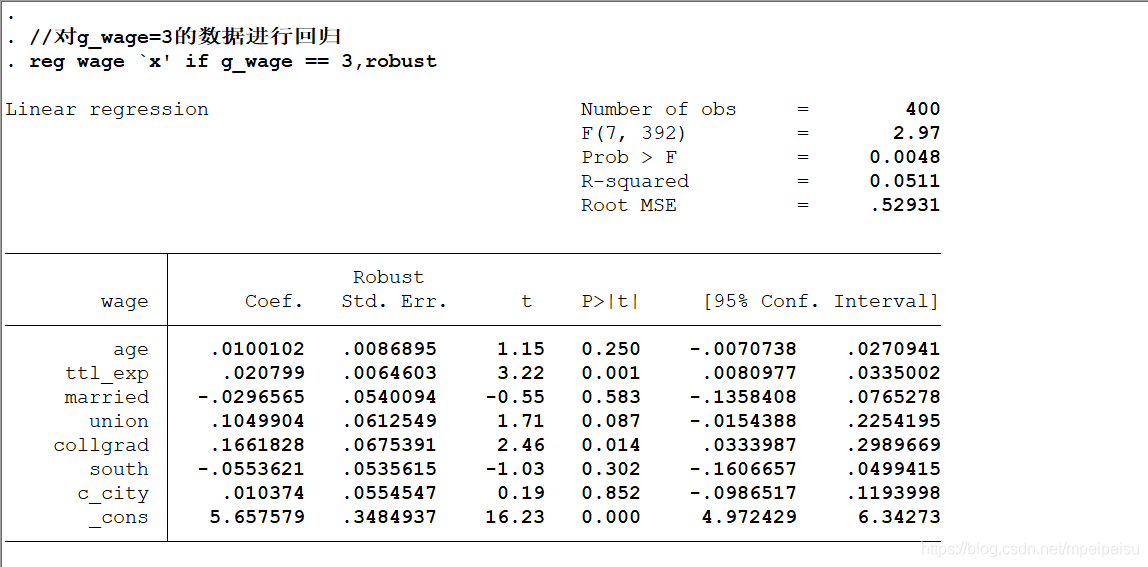
//对g_wage=3的数据进行回归
reg wage `x' if g_wage == 3,robust
est store Mid
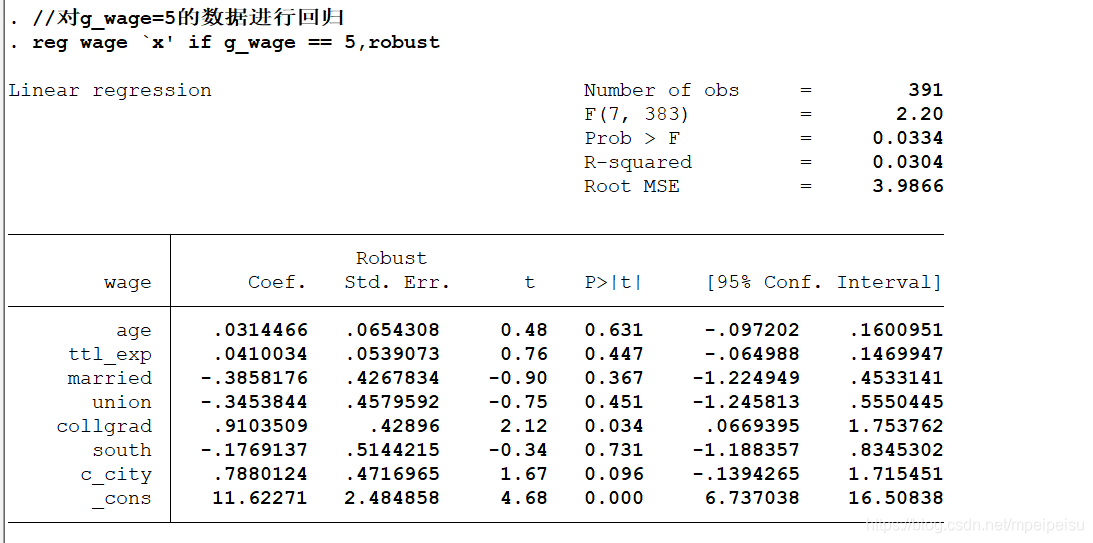
//对g_wage=5的数据进行回归
reg wage `x' if g_wage == 5,robust
est store High
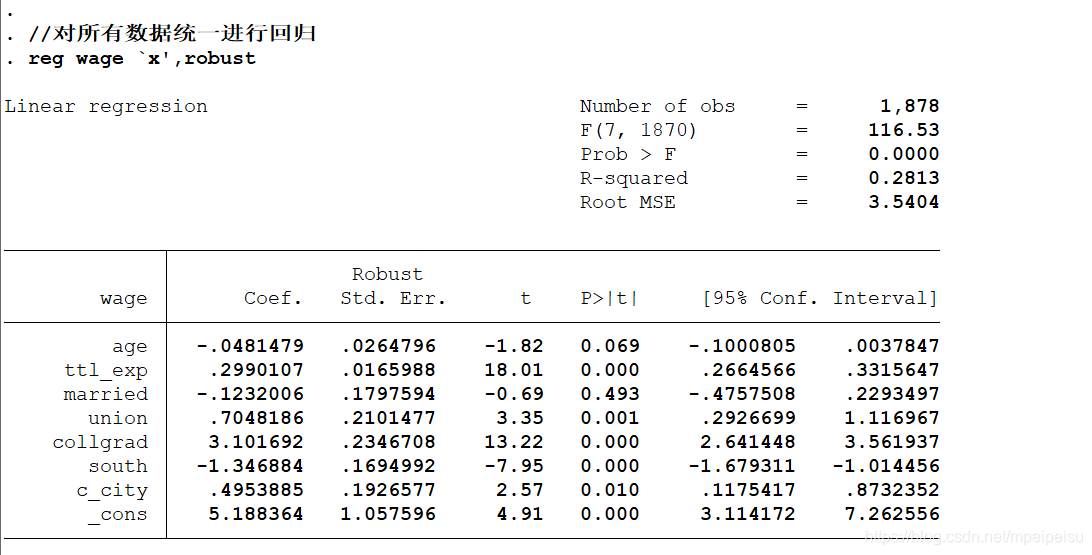
//对所有数据统一进行回归
reg wage `x',robust
est store Full
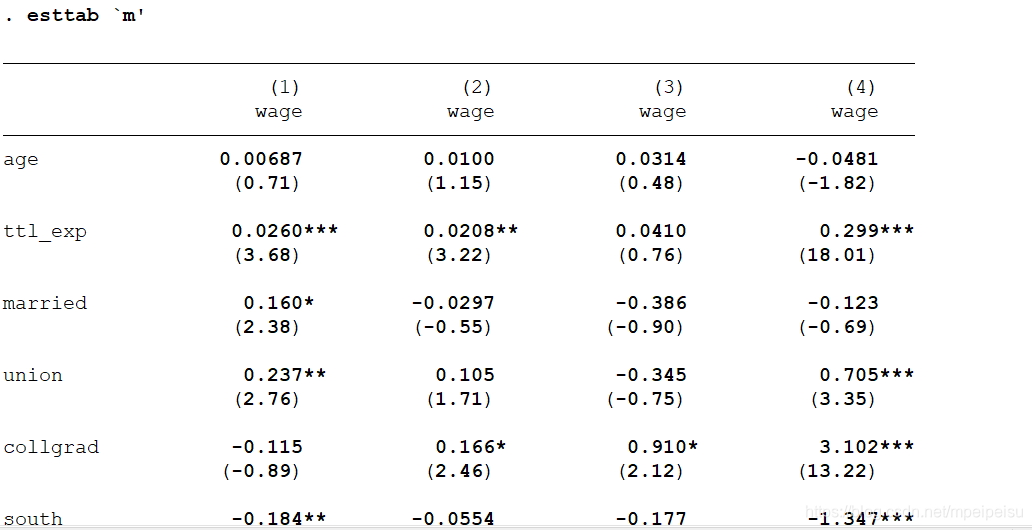
local m "Low Mid High Full"
esttab `m'
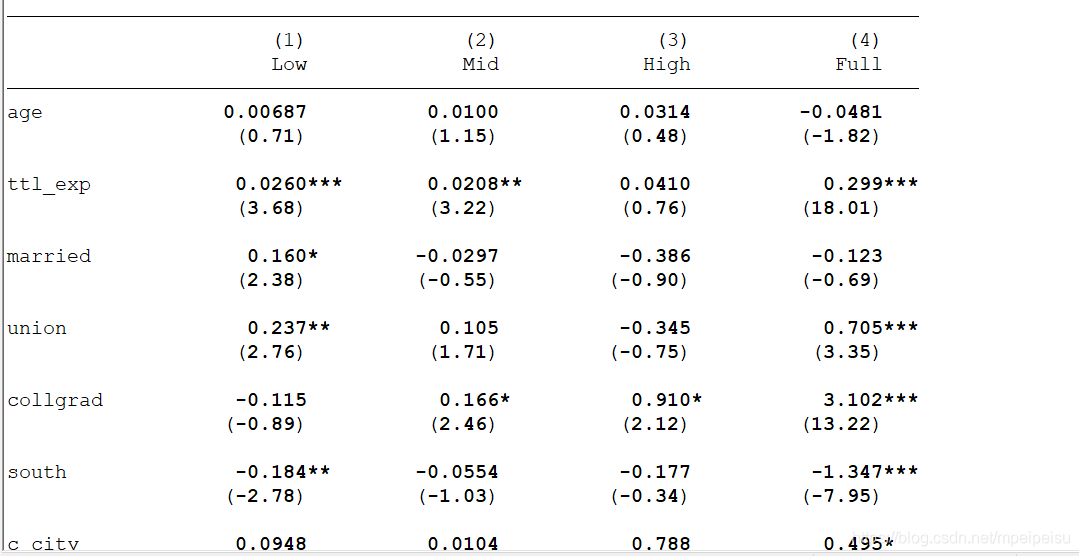
local m "Low Mid High Full"
esttab `m',mtitle(`m')
//将定义的low mid high full作为表格第一行列名

旨在为数千万中国开发者提供一个无缝且高效的云端环境,以支持学习、使用和贡献开源项目。
更多推荐

 34
34 0
0- 0


 已为社区贡献4条内容

所有评论(0)