

[quick reference manual of Linux common commands] pay attention to [entry station], and the background replies to "1001" for self access.
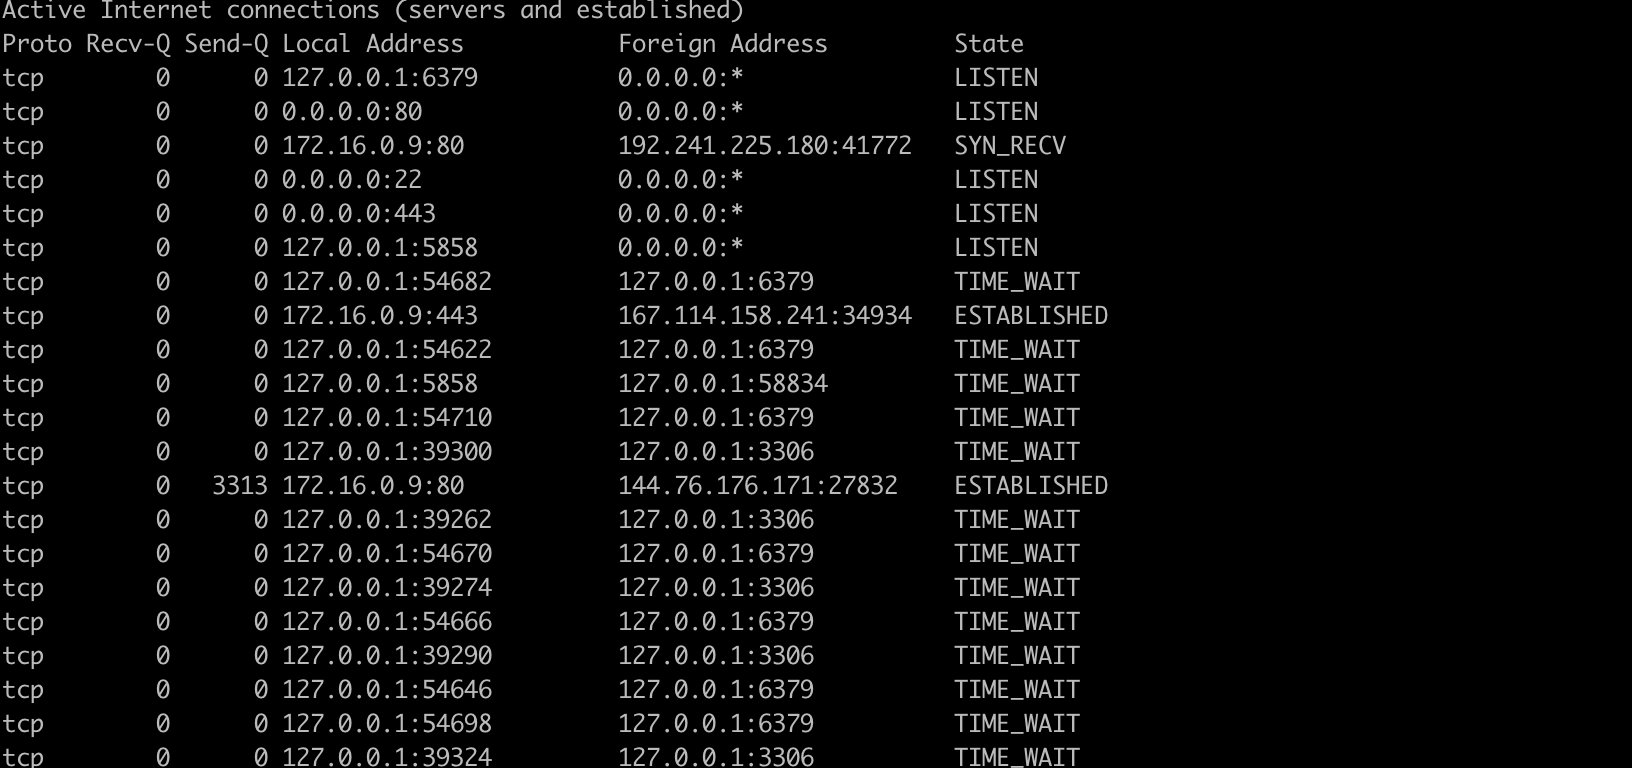
The netstat command is used to display statistics related to IP, TCP, UDP and ICMP protocols. It is generally used to check the network connection of each port of the machine. Netstat is a program that accesses the network and related information in the kernel. It can provide reports on TCP connection, TCP and UDP monitoring, and process memory management.
Detailed explanation of TCP connection status
- LISTEN: LISTEN for connection requests from remote TCP ports
- SYN-SENT: wait for the matching connection request after sending the connection request again
- SYN-RECEIVED: wait for the other party's confirmation of the connection request after receiving and sending another connection request
- ESTABLISHED: represents an open connection
- FIN-WAIT-1: wait for the remote TCP connection interruption request or the confirmation of the previous connection interruption request
- FIN-WAIT-2: wait for connection interruption request from remote TCP
- CLOSE-WAIT: wait for the connection interruption request from the local user
- CLOSING: wait for the remote TCP to confirm the connection interruption
- LAST-ACK: wait for the confirmation of the original connection interruption request sent to the remote TCP
- TIME-WAIT: wait enough time to ensure that the remote TCP receives the confirmation of the connection interruption request
- CLOSED: no connection status
Command format
Netstat (option)
Command options
- -a or – all: displays the sockets in all connections;
- -A < network type > or – < network type >: list the relevant addresses in the connection of the network type;
- -c or – continuous: continuously list the network status;
- -C ache or cache configuration information of router;
- -e or – extend: display other network related information;
- -F or – FIB: display FIB;
- -g or – groups: display the list of members of multiple broadcast function groups;
- -h or – help: online help;
- -i or – interfaces: displays the network interface information form;
- -l or – listening: displays the Socket of the server under monitoring;
- -M or – masquerade: display the camouflaged network connection;
- -n or – numeric: directly use the ip address instead of the domain name server;
- -N or – netlink or – symbolic: displays the symbolic connection name of the network hardware peripheral;
- -o or – timers: display the timer;
- -p or - programs: displays the program ID and program name of the Socket being used;
- -r or – route: displays the Routing Table;
- -s or – statistics: displays the statistical table of network work information;
- -t or – TCP: displays the connection status of TCP transmission protocol;
- -u or – UDP: displays the connection status of UDP transmission protocol;
- -v or – verbose: display the instruction execution process;
- -V or – version: display version information;
- -w or – raw: displays the connection status of raw transmission protocol;
- -x or – unix: the effect of this parameter is the same as that of specifying "- A unix" parameter;
- – ip or – inet: this parameter has the same effect as specifying "- A inet" parameter.
List all ports (including TCP and UDP)
> netstat -a
List all TCP ports
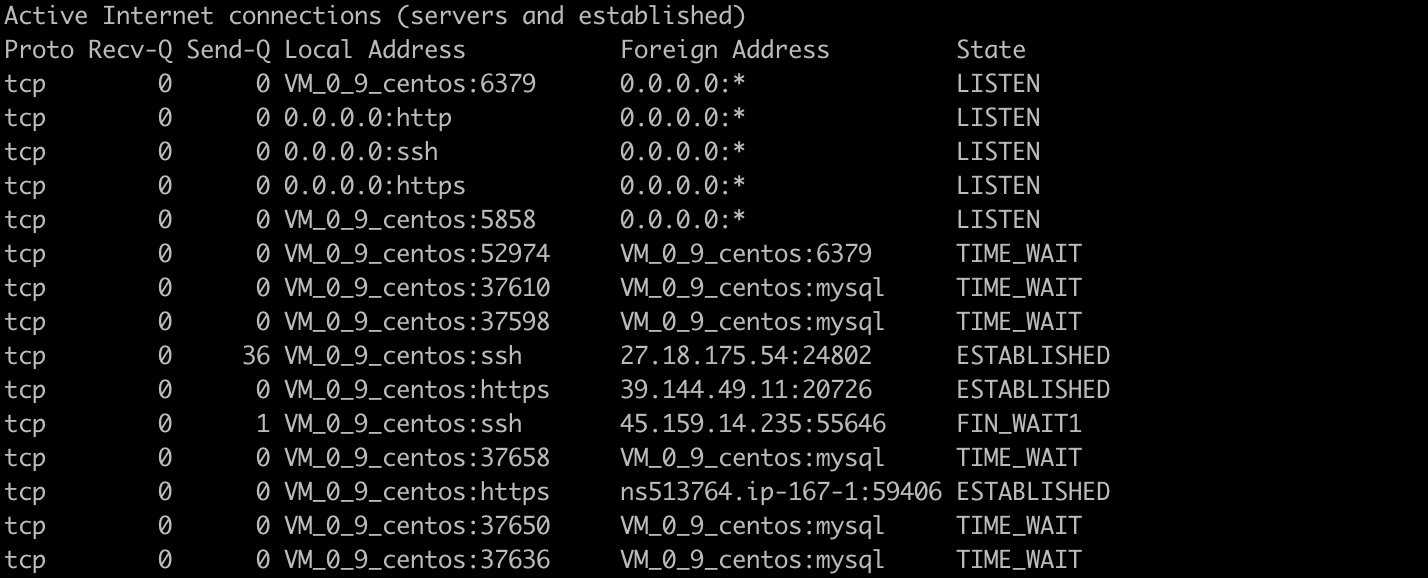
> netstat -at
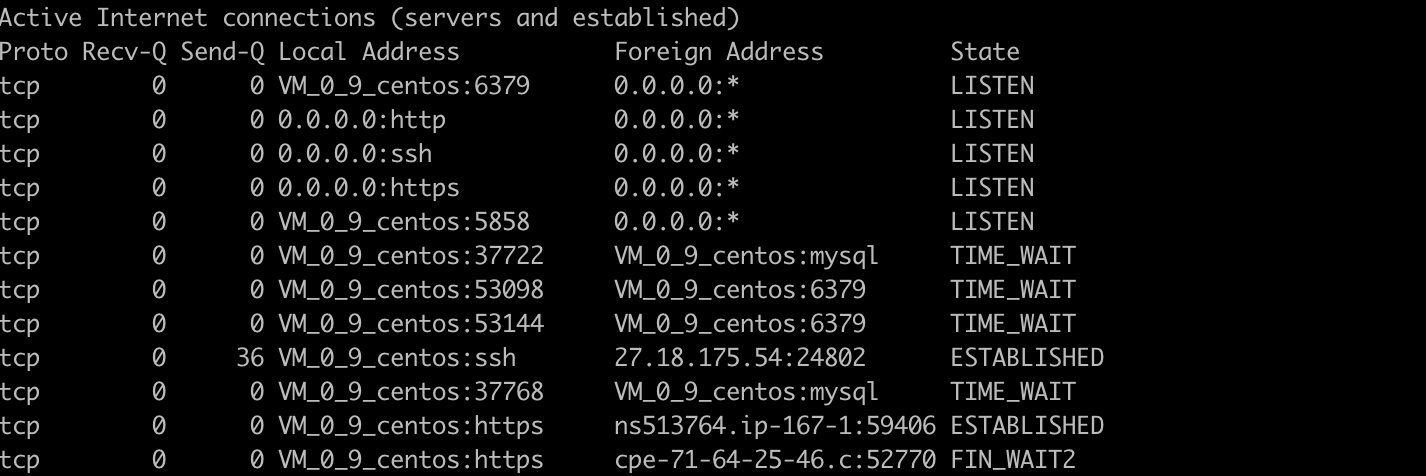
List all UDP ports
> netstat -au
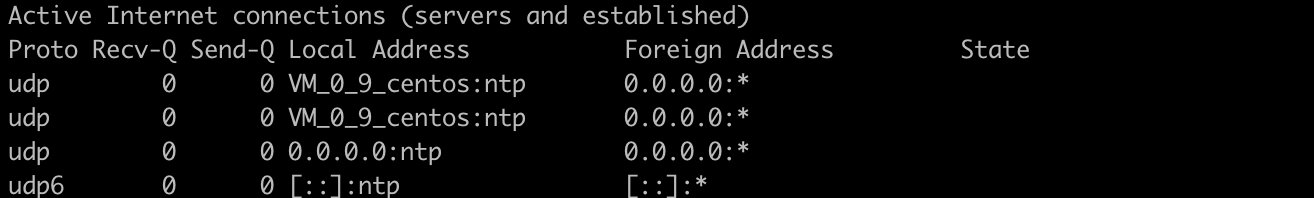
List all Sockets in listening status
> netstat -l
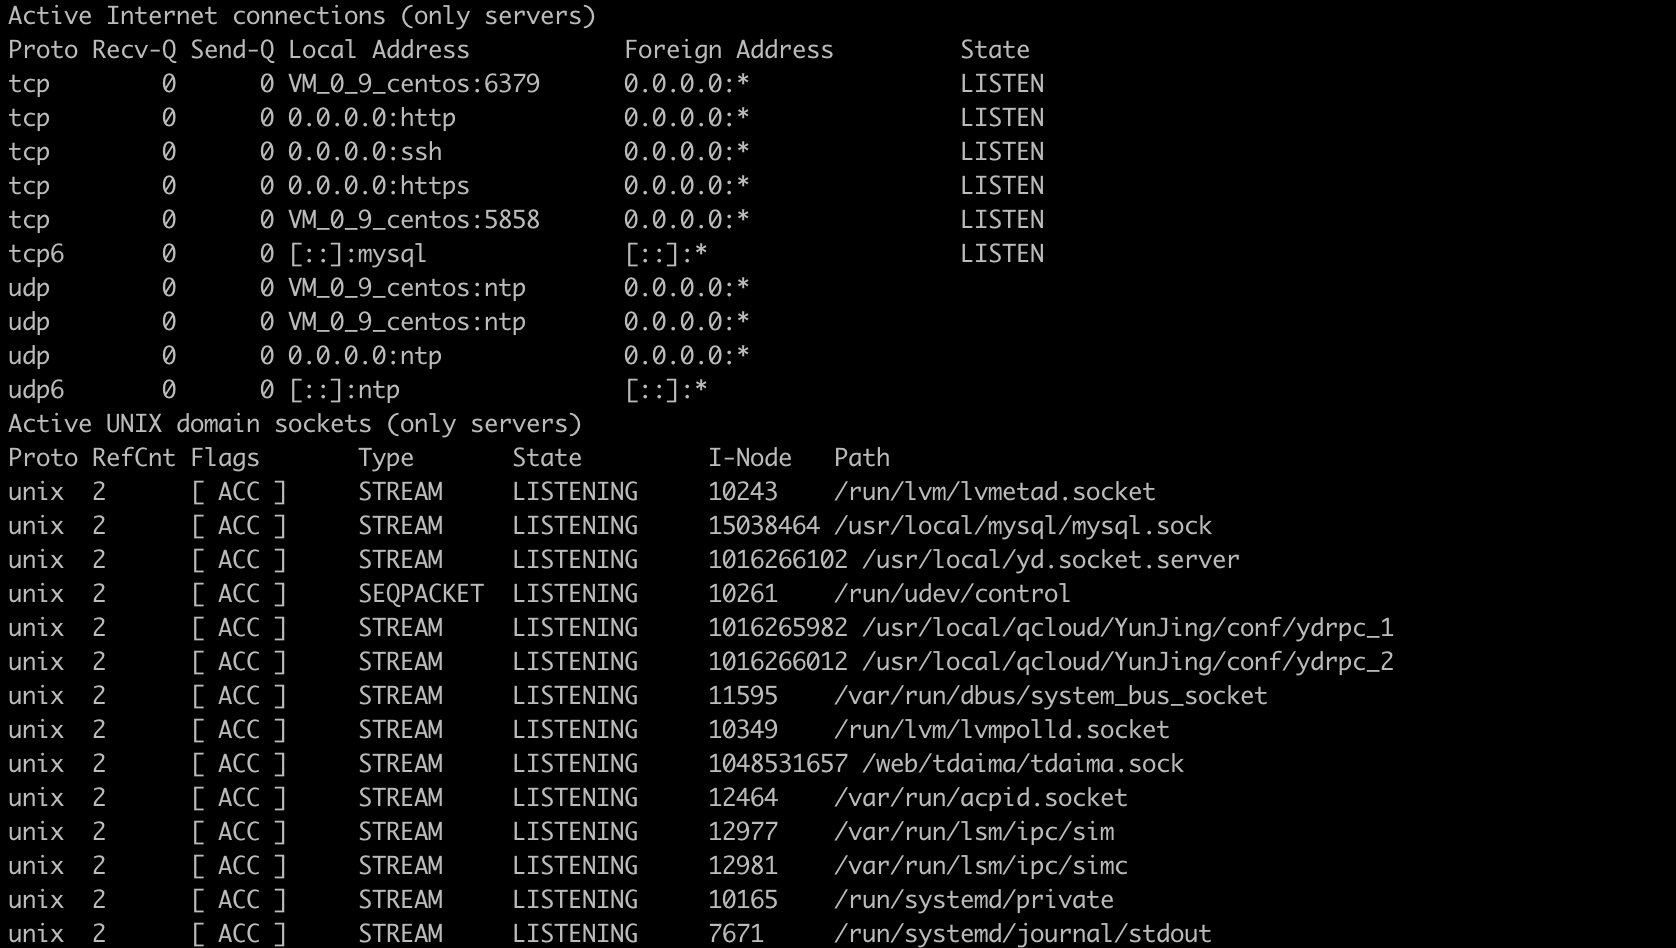
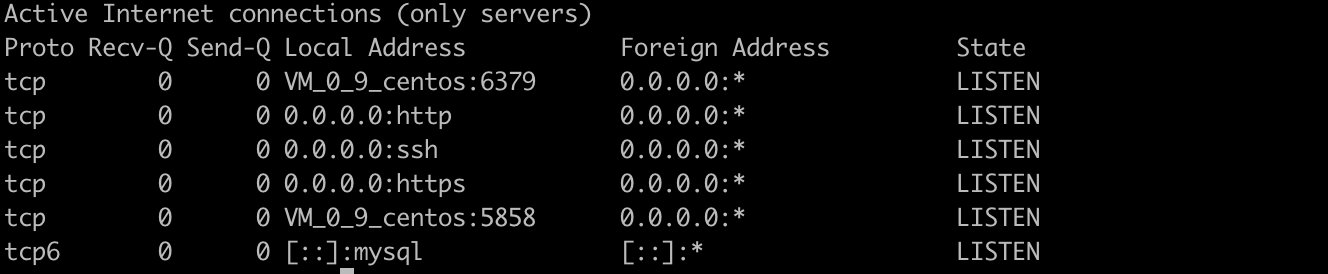
Only all listening tcp ports are listed
> netstat -lt
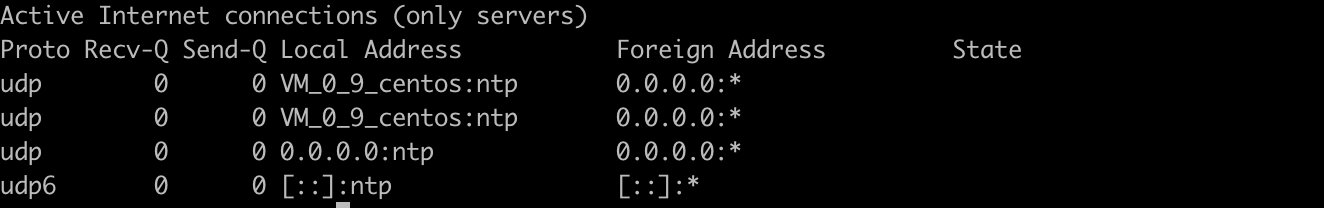
Only all listening udp ports are listed
> netstat -lu
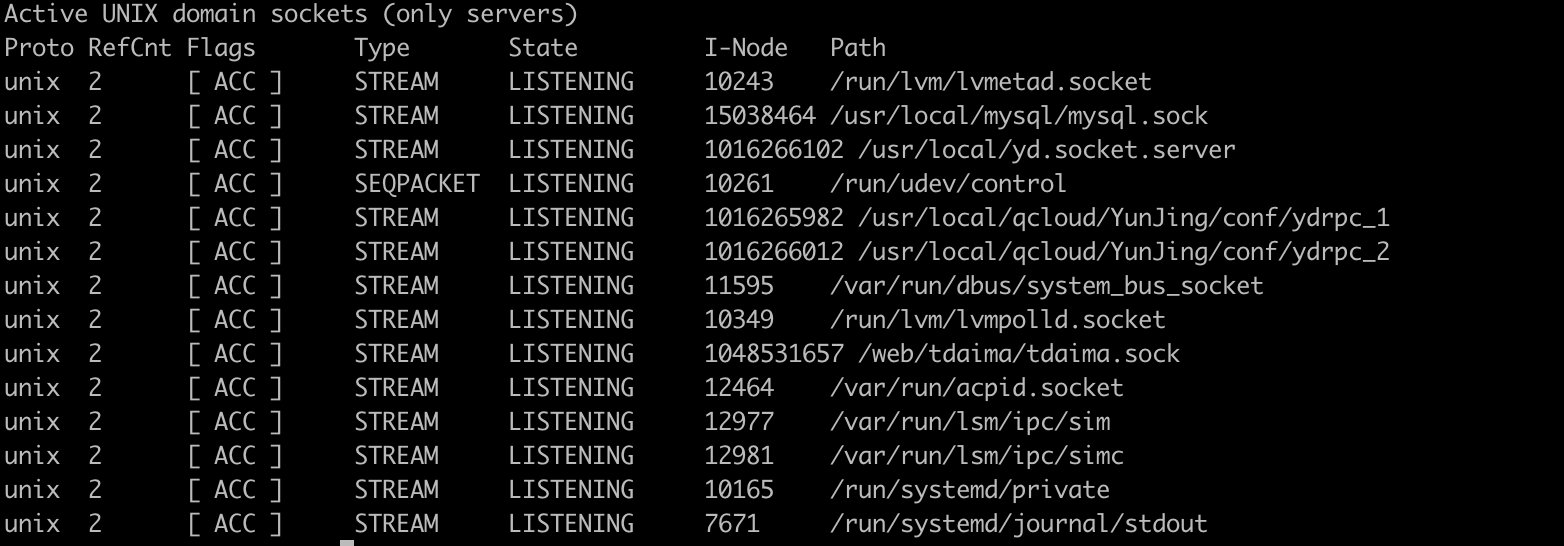
List all listening UNIX ports only
> netstat -lx
Displays statistics for all ports
> netstat -s
Ip:
    1007495197 total packets received
    0 forwarded
    582 with unknown protocol
    0 incoming packets discarded
    1007422115 incoming packets delivered
Icmp:
    66583265 ICMP messages received
    63899 input ICMP message failed.
    InCsumErrors: 384
    ICMP input histogram:
        destination unreachable: 115410
        timeout in transit: 12840
        source quenches: 11
        redirects: 563
        echo requests: 66453453
        echo replies: 152
        timestamp request: 438
        address mask request: 4
    66987000 ICMP messages sent
    0 ICMP messages failed
    ICMP output histogram:
        destination unreachable: 533106
        echo request: 4
        echo replies: 66453453
        timestamp replies: 437
IcmpMsg:
        InType0: 152
        InType3: 115410
        InType4: 11
        InType5: 563

IpExt:
    InNoRoutes: 15
    InMcastPkts: 1291307
    InOctets: 211446050816
    OutOctets: 481070069194
Displays TCP Port Statistics
> netstat -st
IcmpMsg:
    InType0: 152
    InType3: 115410
    InType4: 11
    InType5: 563
    InType8: 66453492
Tcp:
    55437641 active connections openings
    35899081 passive connection openings
    552243 failed connection attempts
    753118 connection resets received
    7 connections established
UdpLite:
TcpExt:
    162052 SYN cookies sent
    621 SYN cookies received
    4998179 invalid SYN cookies received
    551915 resets received for embryonic SYN_RECV sockets
IpExt:
    InNoRoutes: 15
    InMcastPkts: 1291308
    InOctets: 211446303015
    OutOctets: 481070459735
    InMcastOctets: 46487088
Displays statistics for UDP ports
> netstat -su
IcmpMsg:
    InType0: 152
    InType3: 115410
    InType4: 11
    InType5: 563
    InType8: 66453594
    InType11: 12840
    InType13: 438
    InType17: 4
    InType37: 3
    InType165: 7
    OutType0: 66453594
    OutType3: 533106
    OutType8: 4
    OutType14: 437
Udp:
    17941589 packets received
    637146 packets to unknown port received.
    1649 packet receive errors
    17977050 packets sent
    0 receive buffer errors
    0 send buffer errors
    InCsumErrors: 1640
UdpLite:
IpExt:
    InNoRoutes: 15
    InMcastPkts: 1291310
    InOctets: 211446802283
    OutOctets: 481071405083
    InMcastOctets: 46487160
    InNoECTPkts: 1009629627
    InECT1Pkts: 9955
    InECT0Pkts: 1987096
    InCEPkts: 94039
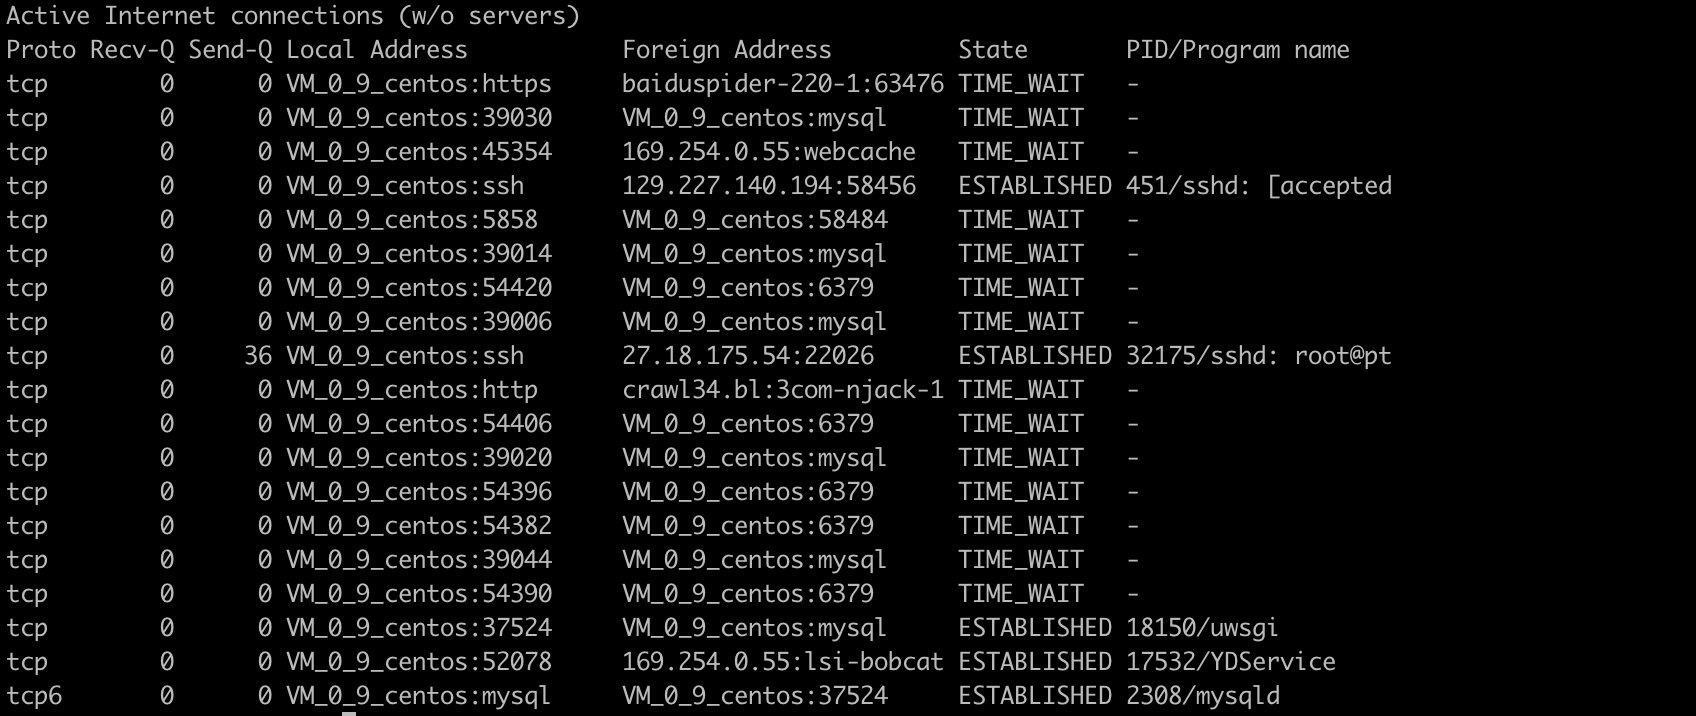
Display PID and process name in netstat output
> netstat -pt
Host, port or user are not displayed in netstat output
> netstat -an
Continuously output netstat information
Output network information every second
> netstat -c
Display core routing information
> netstat -r

Kernel IP routing table
Destination     Gateway         Genmask         Flags   MSS Window  irtt Iface
default         gateway         0.0.0.0         UG        0 0          0 eth0
link-local      0.0.0.0         255.255.0.0     U         0 0          0 eth0
172.16.0.0      0.0.0.0         255.255.240.0   U         0 0          0 eth0
Use netstat -rn to display the number format without querying the host name.
> netstat -rn

Kernel IP routing table
Destination     Gateway         Genmask         Flags   MSS Window  irtt Iface
0.0.0.0         172.16.0.1      0.0.0.0         UG        0 0          0 eth0
169.254.0.0     0.0.0.0         255.255.0.0     U         0 0          0 eth0
172.16.0.0      0.0.0.0         255.255.240.0   U         0 0          0 eth0
Find the port where the program runs
> netstat -tunlp | grep ssh

tcp        0      0 0.0.0.0:22              0.0.0.0:*               LISTEN      4400/sshd
Find the process running on the specified port
> netstat -an | grep ":80"
tcp        0      0 0.0.0.0:80              0.0.0.0:*               LISTEN
tcp        0      0 172.16.0.9:80           185.191.171.12:9380     TIME_WAIT
tcp        0      0 172.16.0.9:80           185.191.171.26:52418    TIME_WAIT
tcp        0   3450 172.16.0.9:80           185.191.171.37:25108    FIN_WAIT1
tcp        0      0 172.16.0.9:80           185.191.171.37:55096    TIME_WAIT
tcp        0      0 172.16.0.9:80           144.76.176.171:27832    TIME_WAIT
tcp        0      0 172.16.0.9:80           118.126.124.7:11127     TIME_WAIT
tcp        0      0 172.16.0.9:46628        169.254.0.55:8080       TIME_WAIT
tcp        0      0 172.16.0.9:80           144.76.176.171:23812    ESTABLISHED
Find process ID through port
> netstat -tunlp | grep 80 | awk '{print $7}' | cut -d/ -f1
21323
Displays a list of network interfaces
> netstat -i
Kernel Interface table
Iface             MTU    RX-OK RX-ERR RX-DRP RX-OVR    TX-OK TX-ERR TX-DRP TX-OVR Flg
docker0          1500        0      0      0 0             0      0      0      0 BMU
eth0             1450 462305568      0      0 0      276046945      0      0      0 BMRU
lo              65536  7204971      0      0 0       7204971      0      0      0 LRU
vpn_abi          1500 229612389      0 1023383 0      146640133      0    956      0 BMRU
Statistics of TCP status list
> netstat -n | awk '/^tcp/{++S[$NF]}END{for(i in S) print i,S[i]}'
ESTABLISHED 7
FIN_WAIT2 13
TIME_WAIT 18
Original link: https://rumenz.com/rumenbiji/linux-netstat.html
WeChat official account: entry station
[quick reference manual of Linux common commands] pay attention to [entry station], and the background replies to "1001" for self access.


 已为社区贡献12891条内容

所有评论(0)