How To Create Rules, Timelines, and Cases from Suricata Events Using Kibana's SIEM Apps
Introduction
The previous tutorials in this series guided you through how to install and configure Suricata. They also explained how to use Filebeat to send alerts from your Suricata server to an Elastic Stack server, to be used with its built-in Security Information and Event Management (SIEM) functionality.
In this final tutorial in the series, you will create custom Kibana rules and generate alerts within Kibana’s SIEM dashboards. Once you have rules in place and understand where and how to filter Suricata’s logs using Kibana, you’ll explore how to create and manage cases using Kibana’s timeline analysis tools.
By the end of this tutorial you will have a SIEM system that you can use to track and investigate security events across all of the servers in your network.
Prerequisites
If you have been following this tutorial series, you should already have a server with at least 4GB RAM and 2 CPUs, and a non-root user configured. For the purposes of this guide, you can set this up by following our initial server setup guides for either Ubuntu 20.04, Debian 11, or Rocky Linux 8, depending on your operating system of choice.
You will also need Suricata installed and running on your server. If you need to install Suricata on your server, you can do so using one of the following tutorials depending on your operating system:
- Ubuntu 20.04: How To Install Suricata on Ubuntu 20.04
- Debian 11: How To Install Suricata on Debian 11
- Rocky Linux 8: How To Install Suricata on Rocky Linux 8
You will also need a server running the Elastic Stack and configured so that Filebeat can send logs from your Suricata server to Elasticsearch. If you need to create an Elastic Stack server, use one of the tutorials from the following list that matches your operating system:
- Ubuntu 20.04: How To Build A Security Information and Event Management (SIEM) System with Suricata and the Elastic Stack on Ubuntu 20.04
- Debian 11: How To Build A Security Information and Event Management (SIEM) System with Suricata and the Elastic Stack on Debian 11
- Rocky Linux 8: How To Build A Security Information and Event Management (SIEM) System with Suricata and the Elastic Stack on Rocky Linux 8
Ensure that you can login to Kibana on your Elasticsearch server, and that there are events in the various Suricata Alerts and Events dashboards.
Once you have all the prerequisites in place, open an SSH tunnel to your Kibana server and login to Kibana with your browser using the credentials that you generated in the previous tutorial.
Step 1 — Enabling API Keys in Elasticsearch
Before you can create rules, alerts, and timelines in Kibana, you need to enable an xpack security module setting.
Open your /etc/elasticsearch/elasticsearch.yml file with nano or your preferred editor.
- sudo nano /etc/elasticsearch/elasticsearch.yml
Add the following highlighted line to the end of the file:
. . .
discovery.type: single-node
xpack.security.enabled: true
xpack.security.authc.api_key.enabled: true
Save and close the file when you are done editing. If you are using nano, you can do so with CTRL+X, then Y and ENTER to confirm.
Now restart Elasticsearch so that the new setting takes effect.
- sudo systemctl restart elasticsearch.service
You’re now ready to configure rules, examine alerts, and create timelines and cases in Kibana.
Step 2 — Adding Rules to Kibana
To use Kibana’s SIEM functionality with Suricata event data, you will need to create rules that will generate alerts about incoming events. Visit the Rules Dashboard in Kibana’s security app page to create or import rules.
For the purposes of this tutorial, we will use the following signatures to detect traffic directed to a server on mismatched ports (SSH, HTTP, and TLS traffic respectively):
alert ssh any any -> 203.0.113.5 !22 (msg:"SSH TRAFFIC on non-SSH port"; classtype: misc-attack; target: dest_ip; sid:1000000;)
alert ssh any any -> 2001:DB8::1/32 !22 (msg:"SSH TRAFFIC on non-SSH port"; classtype: misc-attack; target: dest_ip; sid:1000001;)

alert http any any -> 203.0.113.5 !80 (msg:"HTTP REQUEST on non-HTTP port"; classtype:misc-activity; sid:1000002;)
alert http any any -> 2001:DB8::1/32 !80 (msg:"HTTP REQUEST on non-HTTP port"; classtype:misc-activity; sid:1000003;)

alert tls any any -> 203.0.113.5 !443 (msg:"TLS TRAFFIC on non-TLS HTTP port"; classtype:misc-activity; sid:1000004;)
alert tls any any -> 2001:DB8::1/32 !443 (msg:"TLS TRAFFIC on non-TLS HTTP port"; classtype:misc-activity; sid:1000005;)
If you are using your own signatures, or those from a rule set, ensure that you can generate alerts and that you can access the corresponding events in the default Suricata dashboards in Kibana.
Now visit the Rules page in Kibana’s Security app http://localhost:5601/app/security/rules/. Click the Create new rule button in the top right of the page.
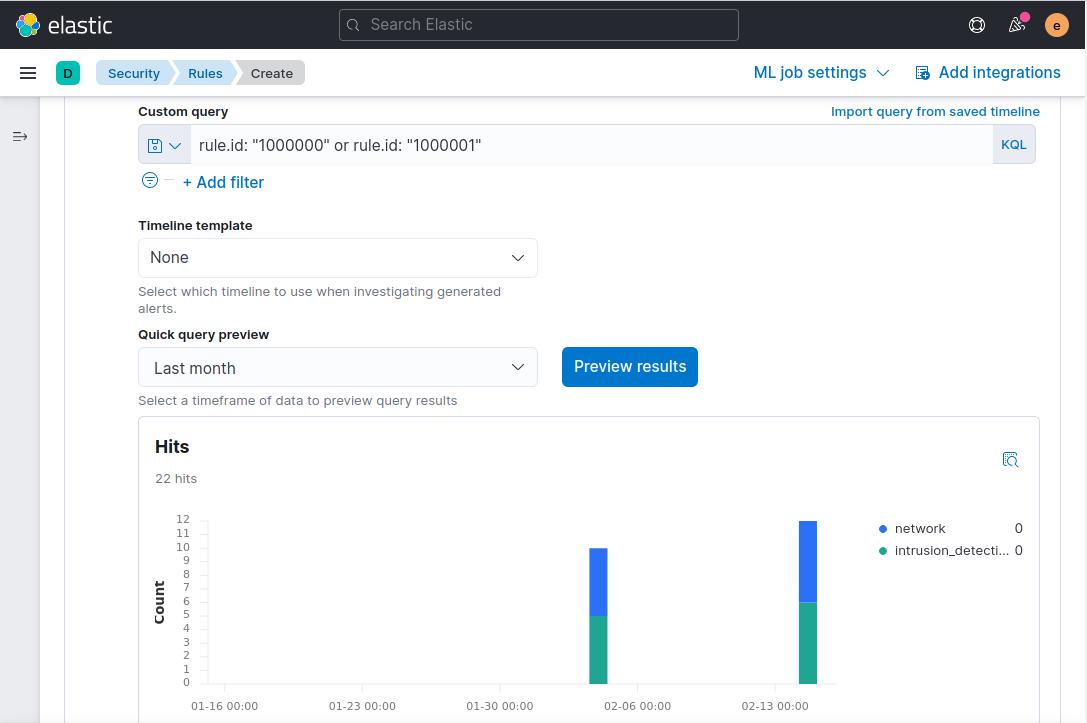
Ensure that the Custom query rule type card is selected. Scroll to the Custom query input field and paste the following into it:
rule.id: "1000000" or rule.id :"1000001"
Ensure that your rule.id values match Suricata’s sid value for the attack or attacks that you would like to alert about.
Change the Query quick preview drop down to Last Month and then click Preview Results. Assuming you have matching events in your Suricata logs, the page will update in place with a graph that shows alerts from the last month. Your page should resemble the following screenshot:
Click Continue to proceed to adding a name to the Rule Name field, which is required for every rule you add. Add a name to the Rule Name field. In this example we’ll use the message description from the Suricata rule SSH TRAFFIC on non-SSH port. Add a description for the rule as well. We’ll use Check for SSH connection attempts on non-standard ports in this example.
You can also expand the Advanced Settings section and add details about the rule. For example, you could add an explanation about how to handle an alert generated by the rule, or link to security researcher’s articles about a particular attack type.
When you are done adding the rule name, description, and optional extra fields, click Continue to proceed to Step 3 of creating the rule.
Leave the next Schedule rule section settings with their default values and click Continue.
Finally, on the Rule actions step, click Create & activate rule.
You will be redirected to a new page that shows details about the rule:
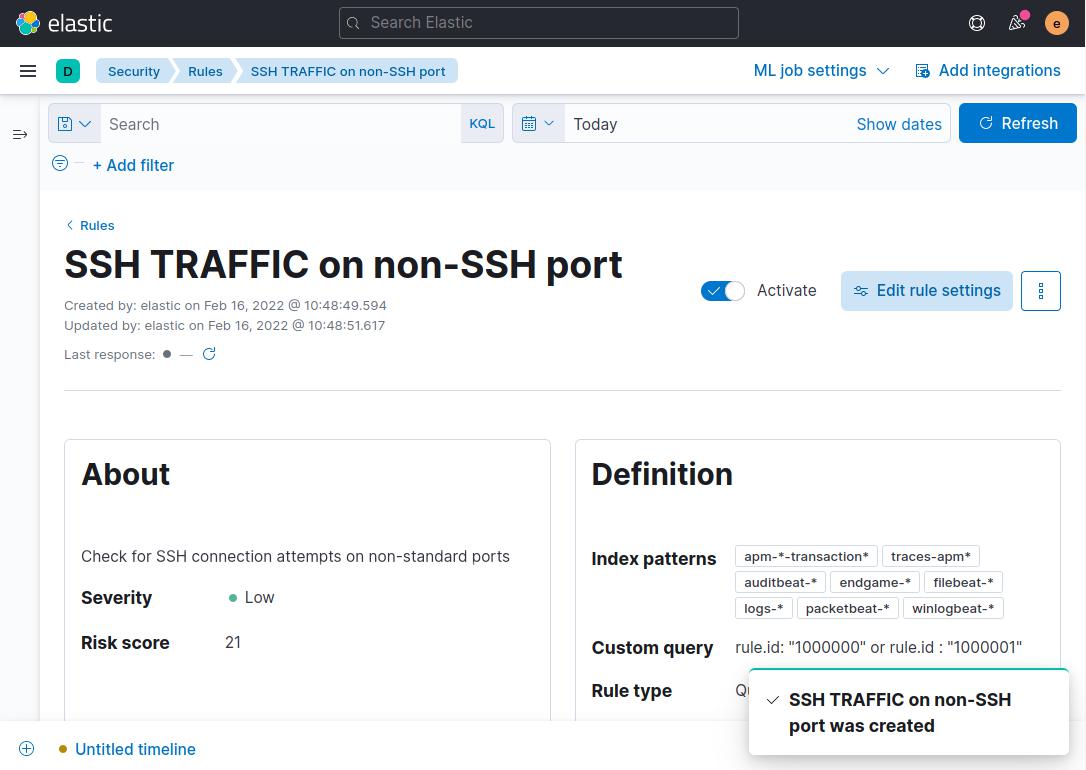
Note: It can take a few minutes for alert data to populate at first. This delay is because the rule’s default schedule is to run every 5 minutes.
If there are other Suricata rules that you would like alerts about, repeat the above steps, substituting the signature’s sid into Kibana’s custom query rule.id field.
Once you have a rule or rules in place, you are ready to proceed to the next step where you’ll examine alerts and create a case or cases to manage them.
Step 3 — Creating a Timeline to Track SSH Traffic Related Alerts
Now that you have a rule or rules configured to generate alerts in Kibana’s SIEM app, you’ll need a way to further group and manage alerts. To get started, visit Kibana’s alerts dashboard: http://127.0.0.1:5601/app/security/alerts.
Be sure that you have generated some invalid traffic that matches the Suricata signature or signatures that you are using. For instance, you could trigger the example sid:1000000 Suricata rule by running a command like the following from your local machine:
- ssh -p 80 your_server_ip
This command will try connecting to your server using SSH on port 80, instead of the default port 22 and should trigger an alert. It may take a few minutes for the alert to show up in Kibana, since it has to be processed by Elasticsearch and the rule that you created in Kibana.
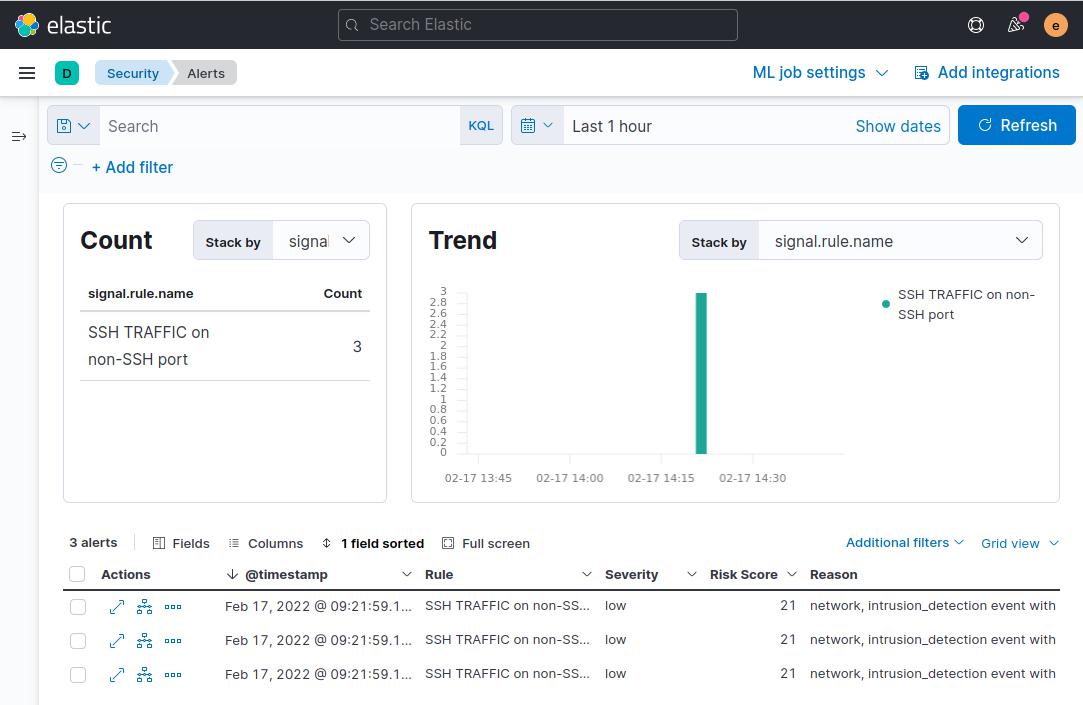
Next, you’ll add the comnunity_id field to the table of alerts that is displayed at the bottom of the page. Recall from the first tutorial that this field is generated by Suricata and represents the unique IP addresses and ports contained in a network flow. Click the Fields button and in the modal dialog that pops up, enter network.community_id and then tick the check box beside the field name:
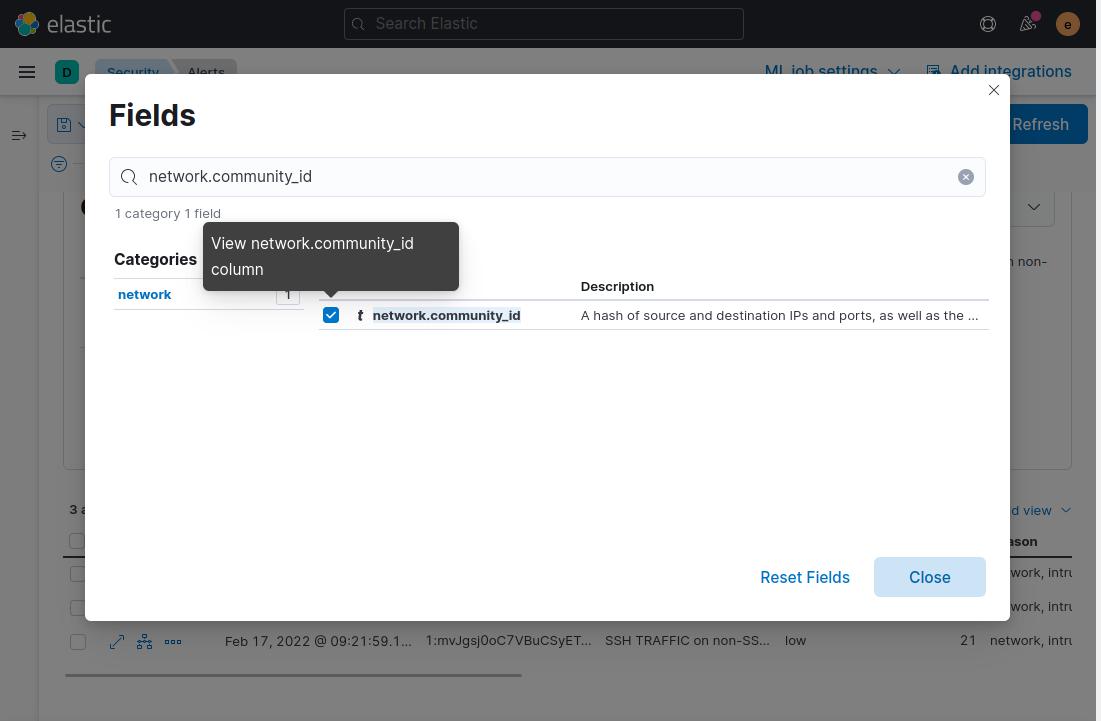
Close the modal and the field will be added to the table of alerts. Now hover over any of the alerts that with the same community_id value and click the Add to timeline investigation icon. This will ensure that all alerts that share the community_id that Suricata added to the event are added to a timeline for further investigation:

Next click the Untitled Timeline link at the bottom left of your browser. This link will take you to a page that only displays alerts with the Suricata community_id field that you want to investigate.
The timeline page shows you more detail about individual packets that are associated with an alert, or network flow. You can use the timeline to get a better idea of when a suspicious network flow started, where it originated, and how long it lasted.
Click the All data sources button on the right side of the page and select the Detection Alerts button, then click Save. This option will restrict the timeline to only display alerts that Kibana generates. Without this option, Suricata’s alerts will also be included in the timeline.
To save your new timeline, click the pencil icon at the top left of the timeline page. The following screenshot highlights where to find the pencil icon, and the All data sources button:
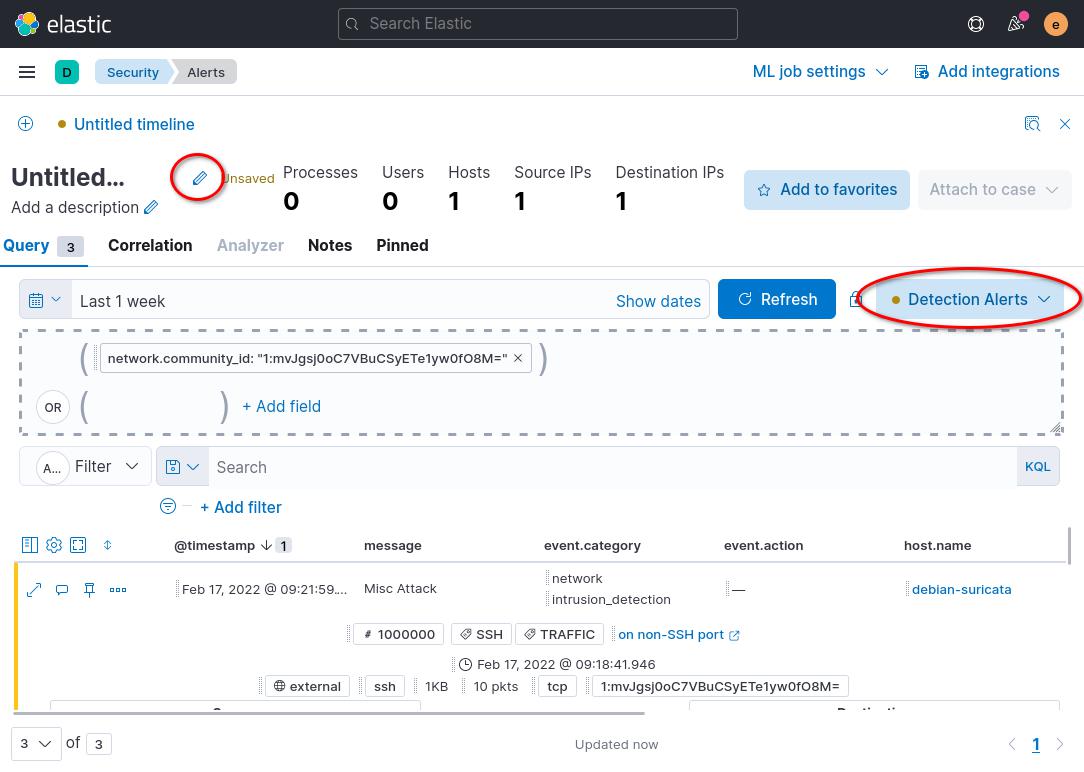
You can add text to the description field if there is additional information that you want to add to the timeline. Once you are done editing the timeline name and description, click the Save button at the bottom right of the modal dialog.
Repeat the above steps to create timelines for other alerts that you would like to examine in more depth later.
In the next step, you’ll use your timeline views of events to attach alerts to Kibana’s Cases app in the SIEM suite of tools.
Step 4 — Creating and Managing SIEM Cases
In the previous step, you created a timeline to group individual alerts and packets together based on Suricata’s community_id field. In this section of the tutorial you will create a Case to track and manage the alerts in your timeline.
To create a new case from your timeline, ensure that you are on a timeline page in your browser. Click the Attach to case button at the top right of the timeline page, and then the Attach to new case button from the list that appears.
You will be redirected to a page where you can input information about the incident that you are investigating. In the following example screenshot, the case is our example SSH Traffic on a non-SSH port alerts:
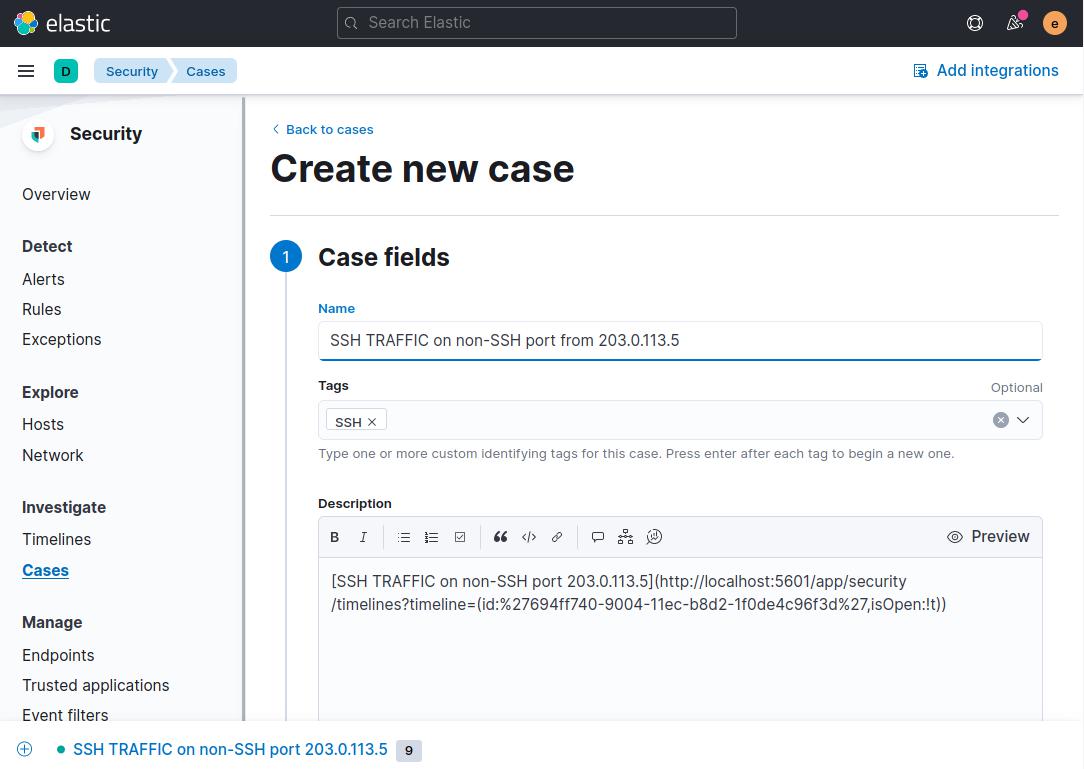
Fill out the fields with a descriptive name and optional tag or tags. In this example the name of the case is SSH TRAFFIC on non-SSH port from 203.0.113.5 since that is the specific type of traffic and host that we’re investigating. With many events to investigate in your SIEM system, a naming scheme like this will help you keep track of cases, timelines, and alerts since the name will correspond to the Kibana alert, and to the Suricata signature’s message field.
Scroll to the bottom of the page and click the Create case button. Your browser will be on a page that shows the saved case. You can add comments in Markdown format with additional information, as well as edit the case from this page.
Next, click the link in the description to go to the case’s timeline that you added in the previous step of this tutorial.
For each alert that you would like to include in the case, click the More actions icon on the alert. Click Add to existing case.
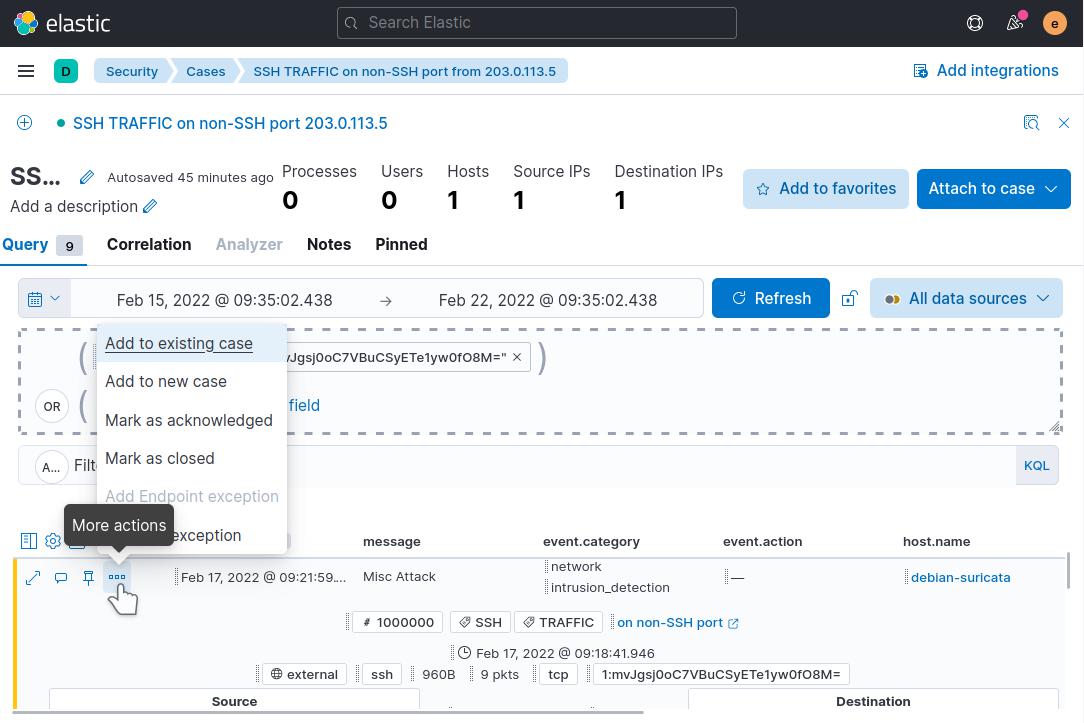
Click the case name in the modal that pops up to add the alert to the case. Be sure to select the case that corresponds to the timeline and alerts that you are investigating. Repeat adding each alert in the list to the existing case.
Now visit the Cases app again in Kibana](http://localhost:5601/app/security/cases) using the navigation menu on the left side of the page. Click on your case and note how the alerts that you added are listed in the case details:
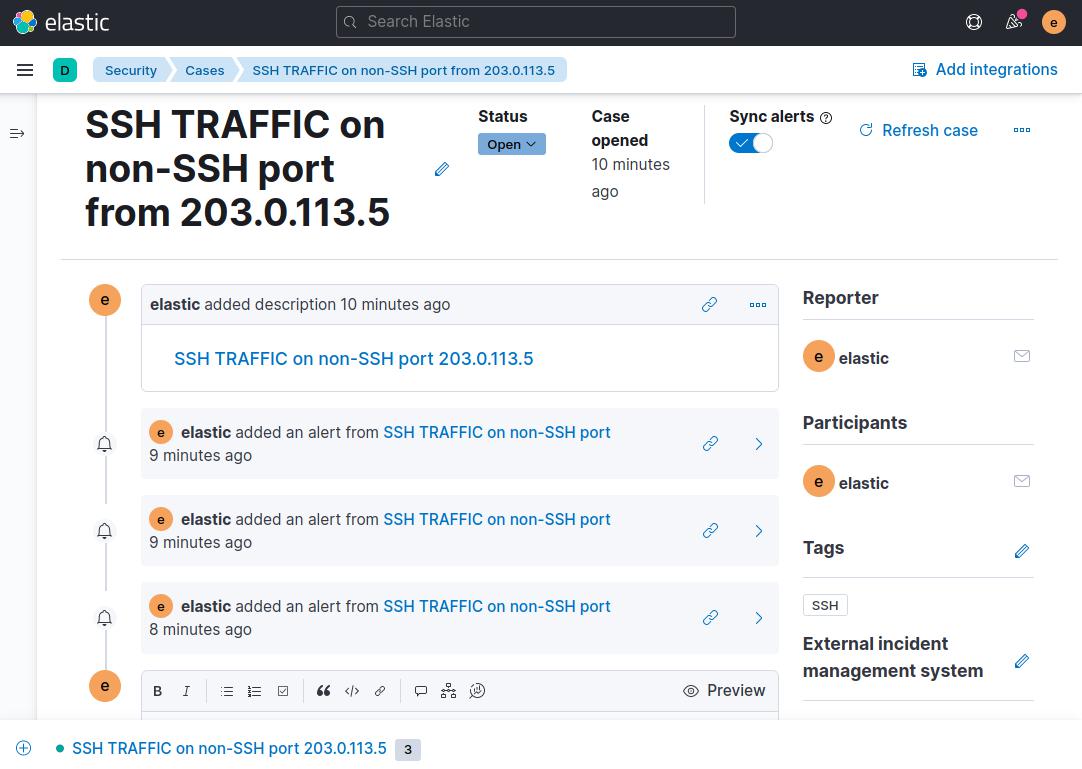
From here you can scroll to the bottom of the case and add any additional information that you would like. For example, any steps that you have taken to investigate an alert or alerts, configuration changes to Suricata like a new or edited rule, escalation to another team member or anything else that is relevant to the case.
Once you are comfortable with creating cases for the various types of alerts that you want to keep track of, you can now use Kibana’s SIEM tools to organize and coordinate investigating any alert in one central location.
Conclusion
In this tutorial you built on your existing Suricata and Elastic Stack SIEM system by adding rules to Kibana that generate alerts about specific traffic of interest. You also created a timeline or timelines to group sets of alerts based on their community_id. Finally, you created a case and linked your timeline to it, along with the individual alerts of interest.
With this SIEM system in place, you can now track security events across your systems at almost any scale. As you become more familiar with Suricata and track the alerts that it generates in your Kibana SIEM, you will be able to customize the Suricata alerts and default actions that it takes to suit your particular network.
For more information about Kibana’s SIEM tools, visit the official Elastic Security Documentation. The guides there explain how to use Rules, Alerts, Timelines, and Cases in much more detail.
For a more lightweight SIEM interface, you might also be interested in EveBox, which presents all of the Suricata event data and SIEM functionality on a single page.
更多推荐
 已为社区贡献12493条内容



所有评论(0)