

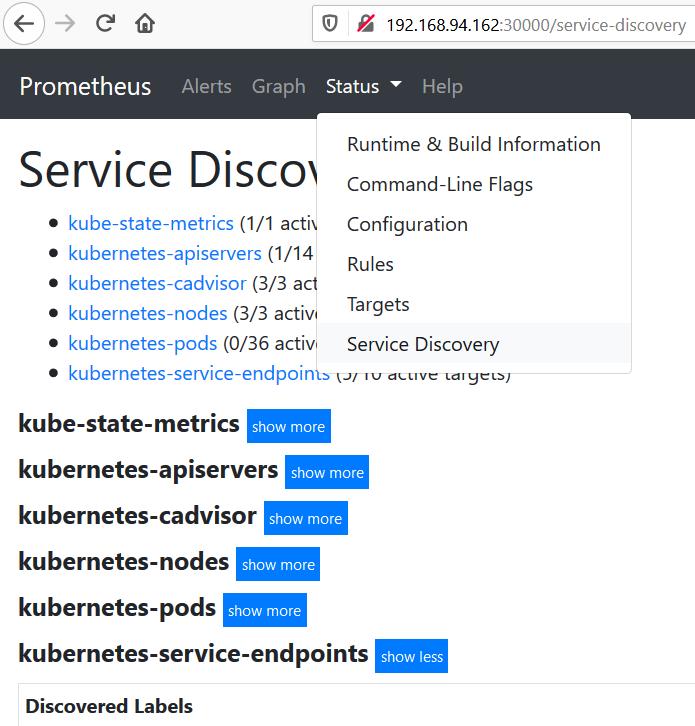
I installed Prometheus (follow in this link: https://devopscube.com/setup-prometheus-monitoring-on-kubernetes/)
But, when checking status of Targets, it shows "Down" for AlertManager service, every another endpoint are up, please see the attached file 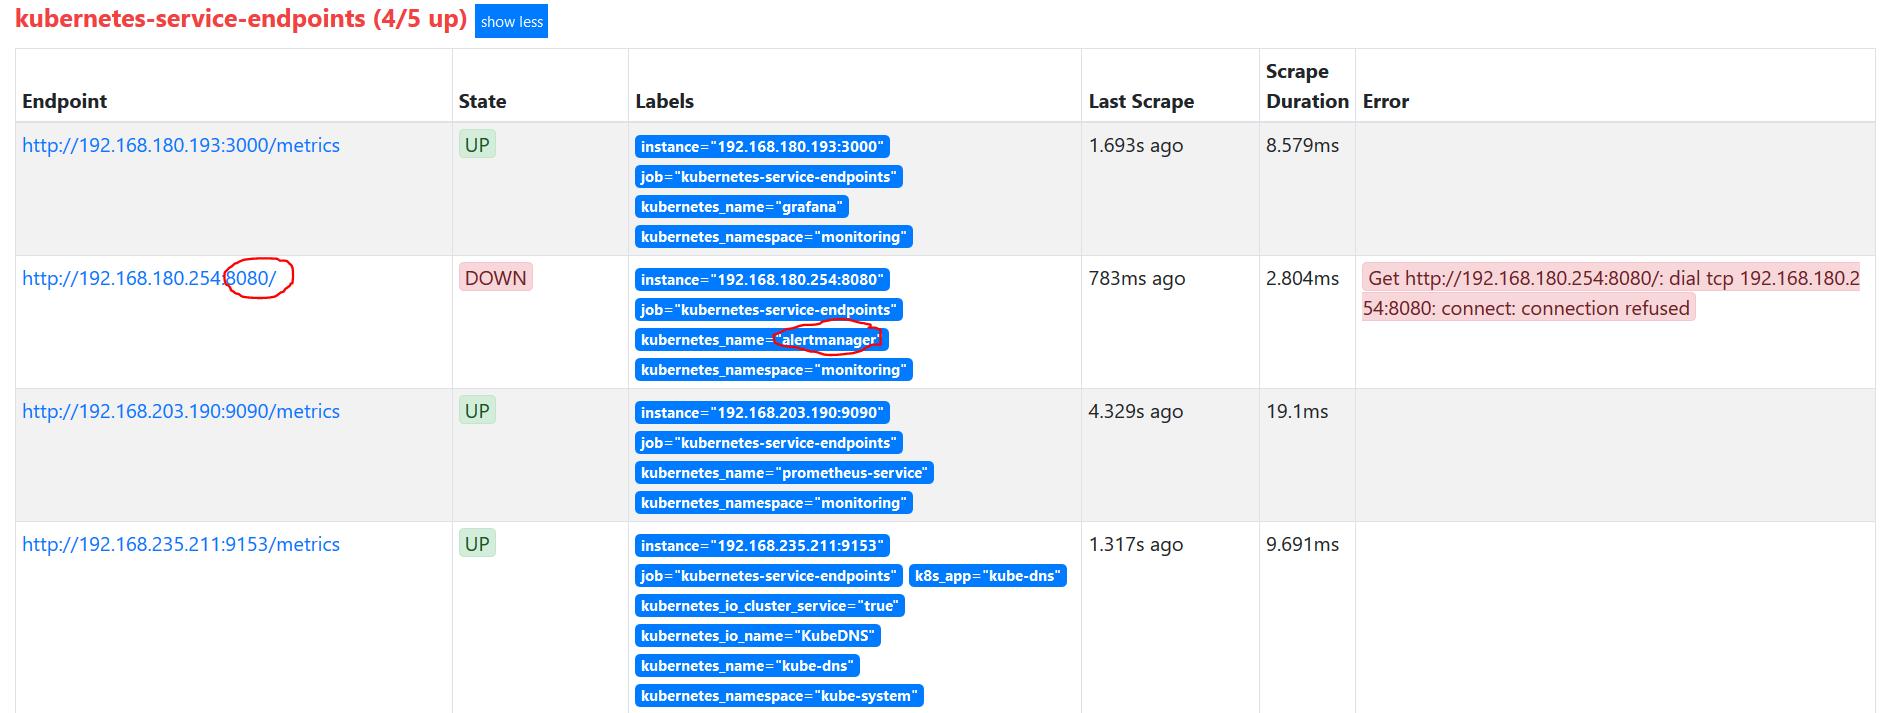
Then, I check Service Discovery, the discovered labels shows:
"address="192.168.180.254:9093" __meta_kubernetes_endpoint_address_target_kind="Pod" __meta_kubernetes_endpoint_address_target_name="alertmanager-6c666985cc-54rjm" __meta_kubernetes_endpoint_node_name="worker-node1" __meta_kubernetes_endpoint_port_protocol="TCP" __meta_kubernetes_endpoint_ready="true" __meta_kubernetes_endpoints_name="alertmanager" __meta_kubernetes_namespace="monitoring" __meta_kubernetes_pod_annotation_cni_projectcalico_org_podIP="192.168.180.254/32" __meta_kubernetes_pod_annotationpresent_cni_projectcalico_org_podIP="true" __meta_kubernetes_pod_container_name="alertmanager" __meta_kubernetes_pod_container_port_name="alertmanager" __meta_kubernetes_pod_container_port_number="9093""
But Target Labels show another port (8080), I don't know why:
instance="192.168.180.254:8080"
job="kubernetes-service-endpoints"
kubernetes_name="alertmanager"
kubernetes_namespace="monitoring"


 已为社区贡献20439条内容

所有评论(0)