Debugging Blazor WASM in VS Code fails because of Unbound breakpoint
Answer a question
I have just created a new Blazor WASM and I have followed the below resource to enable debugging in VS Code
https://docs.microsoft.com/en-us/aspnet/core/blazor/debug?view=aspnetcore-6.0&tabs=visual-studio-code
And as per it, I put a breakpoint on the currentCount++ line, but on debugging it does not hit because the breakpoint is unbound.
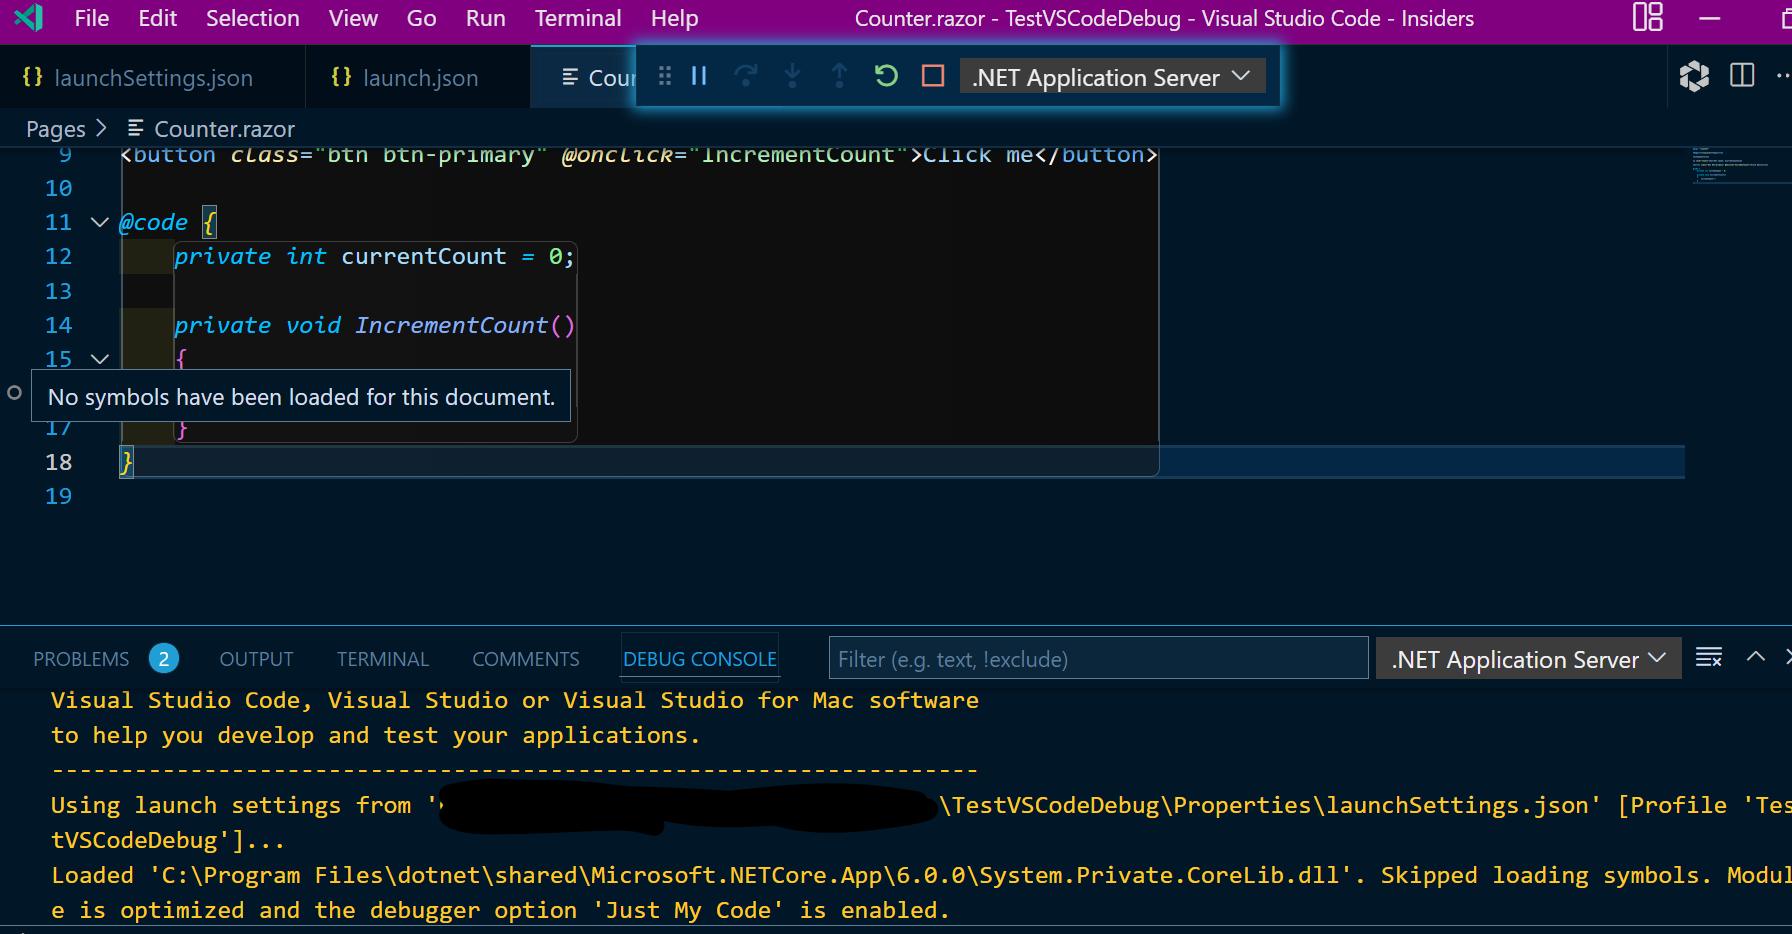
The dotnet version is 6
Launch Settings:
"profiles": { "TestVSCodeDebug": { "commandName": "Project", "dotnetRunMessages": true, "launchBrowser": true, "inspectUri": "{wsProtocol}://{url.hostname}:{url.port}/_framework/debug/ws-proxy?browser={browserInspectUri}", "applicationUrl": "https://localhost:7240;http://localhost:5053", "environmentVariables": { "ASPNETCORE_ENVIRONMENT": "Development" } } }
Launch.json :
"version": "0.2.0", "configurations": [ { "type": "blazorwasm", "name": "Launch and Debug BlazorWASM", "request": "launch", "url": "https://localhost:7240"
    }
]
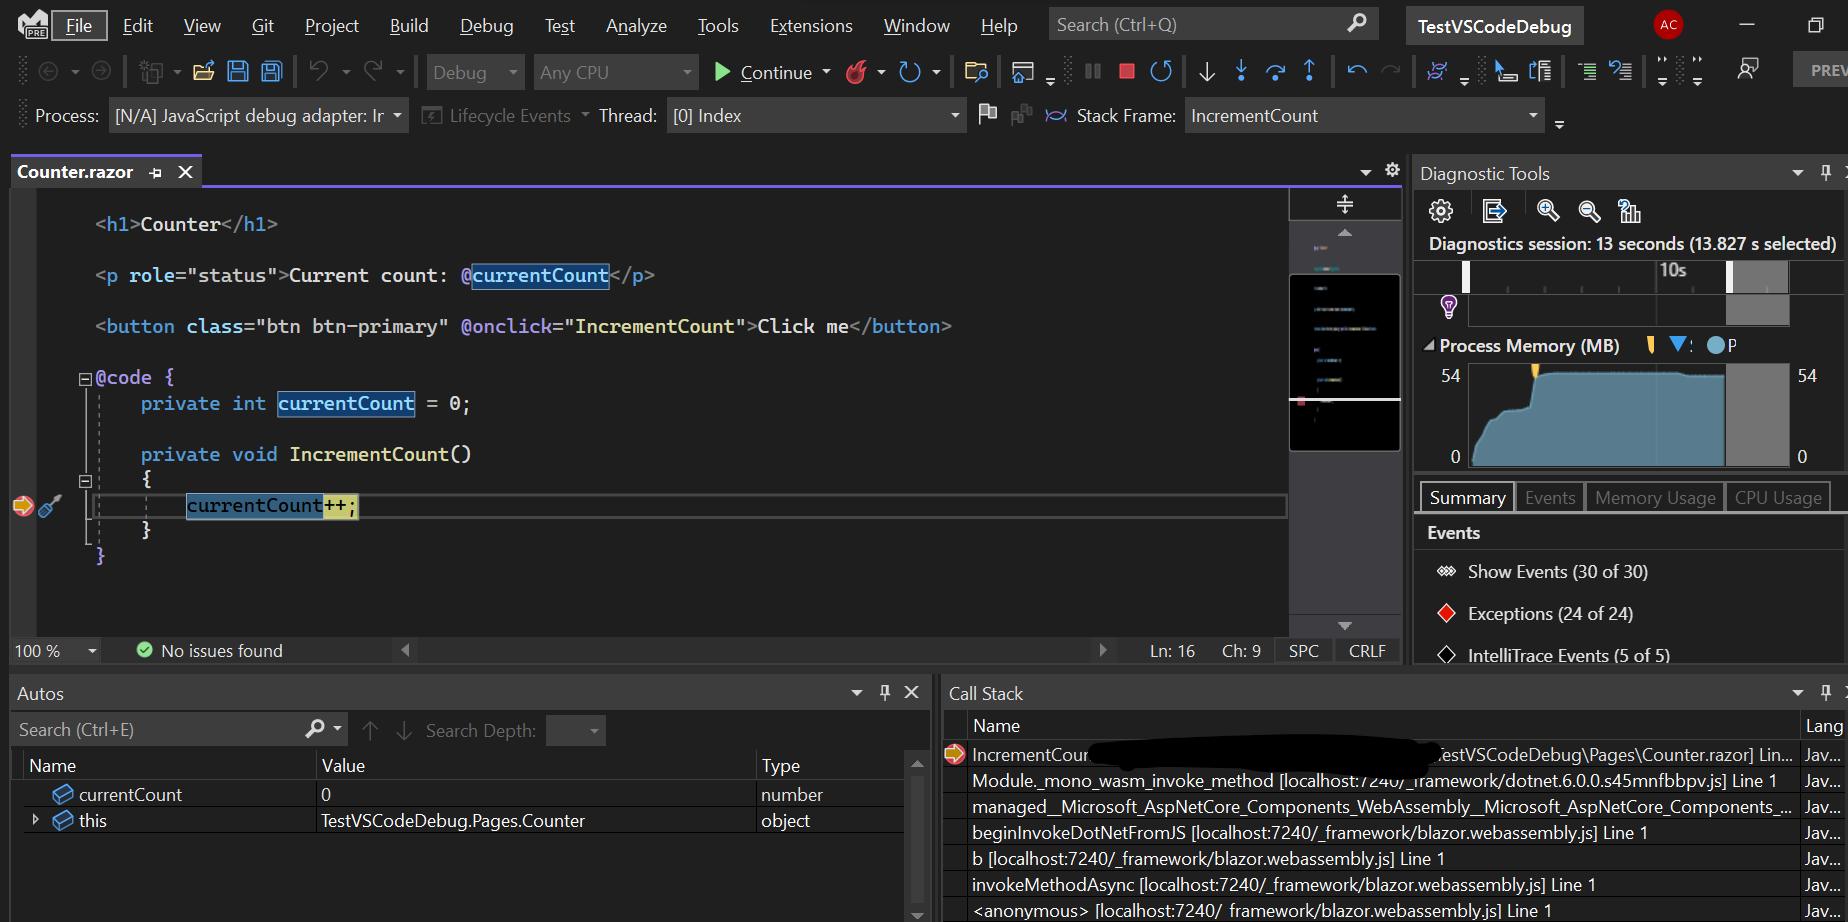
Above is orginal.Below updated on 24th-Jan-2022:
The breakpoint hits in VS 2022 Preview
Answers
This workaround got VSCode breakpoints to hit for me
-
Changing my launch.json to :
{ "version": "0.2.0", "configurations": [ { "name": ".NET Core Debug Blazor Web Assembly in Chrome", "type": "blazorwasm", "request": "launch", "timeout": 30000, "url": "http://localhost:5000", "webRoot": "${workspaceFolder}", "inspectUri": "{wsProtocol}://{url.hostname}:{url.port}/_framework/debug/ws-proxy?browser={browserInspectUri}" }] } -
Also make sure you're launching with http and not https.
-
Install and debug with chrome :( Can't get it to work on FF.
More info here : https://github.com/dotnet/aspnetcore/issues/20597

开发云社区提供前沿行业资讯和优质的学习知识,同时提供优质稳定、价格优惠的云主机、数据库、网络、云储存等云服务产品
更多推荐
 0
0 0
0- 0


 已为社区贡献4439条内容

所有评论(0)