How to search the debug console in vscode?
Answer a question
This is currently a feature request, so I know the answer isn't straight forward, but I assume some clever people found clever workarounds for this.
One way is to copy/paste the output in some text editor, but ew.
Someone suggested redirecting the debug output to the terminal, which does have a search feature, sounds better.
So, the question is, how does one redirect the debug output to the terminal?
Unless, of course, you have an even better solution.
EDIT (from the GitHub thread)
You can use the property "console": "integratedTerminal" on the debug launch task to redirect the output to the terminal.
Answers
Since August 2020 and VSCode 1.49, the Debug Console does support filtering:
Debug Console filter
The Debug Console now supports filtering, making it easier for users to find the output they are looking for, or to hide irrelevant logging output.
The filter also supports exclude patterns (for example, patterns starting with an exclamation mark
!).
The filter only applies to program output but not to evaluations run by a user.Like other input boxes in VS Code, you can use the up and down arrow keys to navigate between old filter inputs.
In the short video below, the output is filtered to entries that include the text '
http', do not include the text 'http' (using the filter!http), and then include the word 'Severity':
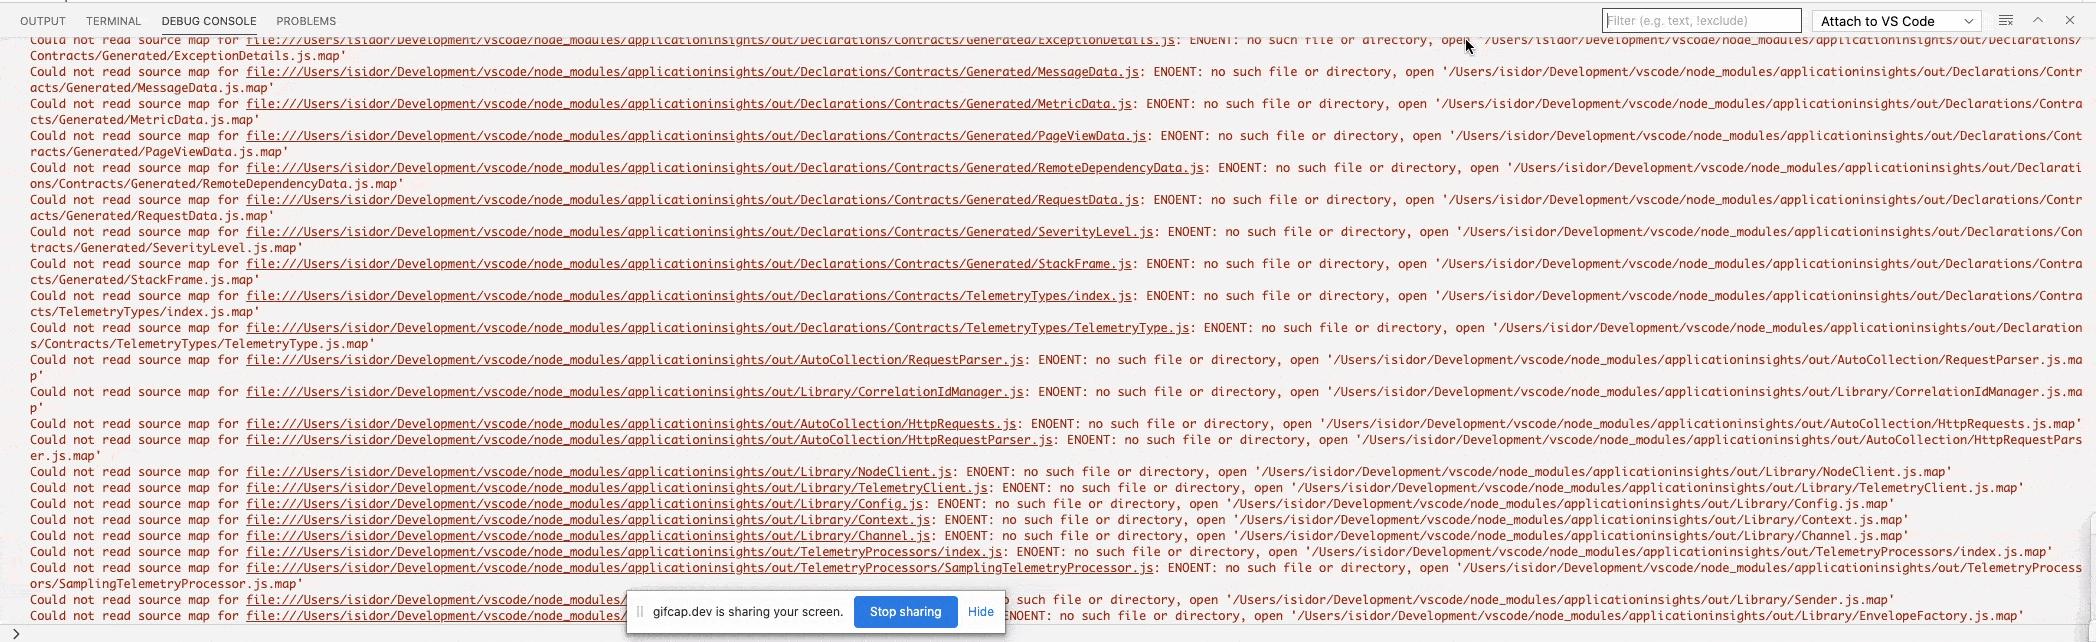
(Click on the picture to enlarge. Look for the filter at the top right section of the animation)
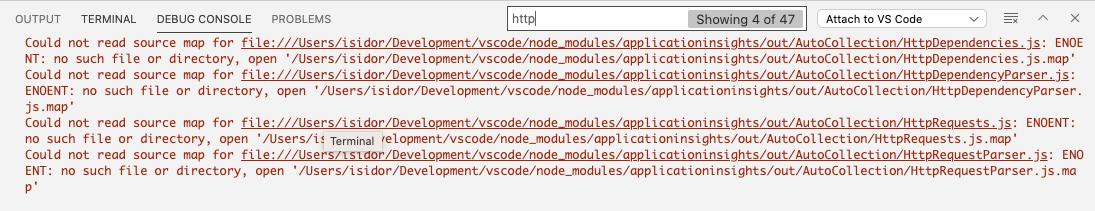
And with the upcoming Sept. 2020 VSCode 1.50, you know where you are in your search:
Since last milestone the Debug Console supports filtering, making it easier for users to find the output they are looking for, or to hide irrelevant logging output.
Now we have added a badge to make it clear how many items are filtered away.

开发云社区提供前沿行业资讯和优质的学习知识,同时提供优质稳定、价格优惠的云主机、数据库、网络、云储存等云服务产品
更多推荐
 0
0 0
0- 0


 已为社区贡献4439条内容

所有评论(0)