
必学收藏!基于LangGraph+MCP+ReactAgent构建Excel表格问答助手,让大模型一句话生成分析结果与图表
前言
在数据驱动的今天,Excel/CSV 仍是企业最核心的数据载体。然而,传统手动分析效率低下,非技术用户难以挖掘深层洞察。本文将带你从零构建一个 “对话式表格分析助手” ——只需输入自然语言问题,即可自动解析文件、生成 SQL 查询、执行分析,并输出结构化表格或可视化图表。
本方案基于 LangChain 编排工作流,结合 MCP(Model Control Protocol) 实现模型能力扩展,使用 DuckDB 高效执行查询,最终通过 ECharts/AntV 渲染结果,实现端到端自动化分析。
🎯 核心价值
✅ 零代码交互:无需掌握复杂函数,用自然语言即可完成数据查询与分析。
✅ 智能语义理解:大模型精准解析用户意图,自动处理聚合、过滤、排序等逻辑。
✅ 多模态输出:支持生成结构化表格、柱状图、折线图、饼图等多种可视化形式。
✅ 安全高效:基于 DuckDB 内存计算,私有化部署保障数据安全。
✅ 可扩展架构:模块化设计,易于集成到现有系统或二次开发。
🧭 本文结构概览
- 环境准备:核心技术栈介绍
- 核心逻辑:LangChain 工作流与状态管理
- SQL 生成:大模型如何理解表结构并生成查询
- 执行与渲染:DuckDB 执行与图表生成
- 总结与展望
一、环境准备:核心技术栈
| 技术 | 用途 |
|---|---|
| LangChain | 低代码编排大模型应用,管理提示词、调用 LLM、构建 Agent 工作流 |
| LangGraph | 基于状态机的工作流引擎,定义节点执行顺序与条件分支 |
| DuckDB | 轻量级嵌入式数据库,支持直接查询 CSV/Parquet,性能卓越 |
| Pandas | 数据加载与预处理 |
| MCP (Model Control Protocol) | 扩展大模型能力,调用外部工具(图表生成服务) |
| Echarts / AntV | 生成高质量前端可视化图表 |
| MinIO | 存储上传的文件 |
二、核心逻辑:LangChain 工作流
整个系统基于 状态机(State Machine) 设计,使用 LangGraph 构建流程。核心状态定义如下:
1. 状态定义
from typing import TypedDict, Optional, List, Dict, Anyfrom pydantic import BaseModelclass ExecutionResult(BaseModel): success: bool columns: List[str] # 结果列名 data: Optional[List[Dict[str, Any]]] = None# 查询数据 error: Optional[str] = Noneclass ExcelAgentState(TypedDict): user_query: str # 用户问题 file_list: list # 文件信息 db_info: dict # 解析出的表结构 generated_sql: Optional[str] # 生成的 SQL execution_result: Optional[ExecutionResult] # 执行结果 chart_type: Optional[str] # 推荐图表类型 report_summary: Optional[str] # 分析摘要 apache_chart_data: Optional[Dict[str, Any]] # ECharts 数据
2. 工作流构建
from langgraph.graph import StateGraph, ENDfrom agent.excel.excel_agent_state import ExcelAgentStatedef create_excel_graph(): graph = StateGraph(ExcelAgentState) # 添加处理节点 graph.add_node("excel_parsing", read_excel_columns) # 解析文件 graph.add_node("sql_generator", sql_generate_excel) # 生成 SQL graph.add_node("sql_executor", exe_sql_excel_query) # 执行 SQL graph.add_node("summarize", summarize) # 生成摘要 graph.add_node("data_render", data_render_ant) # AntV 图表 graph.add_node("data_render_apache", data_render_apache) # ECharts 表格 # 设置流程 graph.set_entry_point("excel_parsing") graph.add_edge("excel_parsing", "sql_generator") graph.add_edge("sql_generator", "sql_executor") graph.add_edge("sql_executor", "summarize") # 条件分支:根据 chart_type 选择渲染方式 graph.add_conditional_edges( "summarize", lambda s: "data_render_apache"ifnot s["chart_type"] or"table"in s["chart_type"] else"data_render", {"data_render": "data_render", "data_render_apache": "data_render_apache"} ) graph.add_edge("data_render", END) graph.add_edge("data_render_apache", END) return graph.compile()
三、SQL 生成:大模型理解表结构
关键在于引导大模型根据表结构和用户问题生成准确的 SQL。
提示词工程
import jsonimport tracebackfrom langchain.prompts import ChatPromptTemplatefrom datetime import datetimeimport loggingfrom agent.text2sql.analysis.llm_util import get_llmlogger = logging.getLogger(__name__)def sql_generate_excel(state): llm = get_llm() prompt = ChatPromptTemplate.from_template( """ 你是一位专业的数据库管理员(DBA),任务是根据提供的数据库结构、表关系以及用户需求,生成优化的DUCKDB SQL查询语句,并推荐合适的可视化图表。 ## 任务 - 根据用户问题生成一条优化的SQL语句。 - 根据查询生成逻辑从**图表定义**中选择最合适的图表类型。 ## 约束条件 1. 你必须仅生成一条合法、可执行的SQL查询语句 —— 不得包含解释、Markdown、注释或额外文本。 2. **必须直接且完整地使用所提供的表结构和表关系来生成SQL语句**。 3. 你必须严格遵守数据类型、外键关系及表结构中定义的约束。 4. 使用适当的SQL子句(JOIN、WHERE、GROUP BY、HAVING、ORDER BY、LIMIT等)以确保准确性和性能。 5. 若问题涉及时序,请合理使用提供的“当前时间”上下文(例如用于相对日期计算)。 6. 不得假设表结构中未明确定义的列或表。 7. 如果用户问题模糊或者缺乏足够的信息以生成正确的查询,请返回:`NULL` ## 提供的信息 - 表结构:{db_schema} - 用户提问:{user_query} - 当前时间:{current_time} ## 图表定义 - generate_area_chart: used to display the trend of data under a continuous independent variable, allowing observation of overall data trends. - generate_bar_chart: used to compare values across different categories, suitable for horizontal comparisons. - generate_boxplot_chart: used to display the distribution of data, including the median, quartiles, and outliers. - generate_column_chart: used to compare values across different categories, suitable for vertical comparisons. - generate_district_map: Generate a district-map, used to show administrative divisions and data distribution. - generate_dual_axes_chart: Generate a dual-axes chart, used to display the relationship between two variables with different units or ranges. - generate_fishbone_diagram: Generate a fishbone diagram, also known as an Ishikawa diagram, used to identify and display the root causes of a problem. - generate_flow_diagram: Generate a flowchart, used to display the steps and sequence of a process. - generate_funnel_chart: Generate a funnel chart, used to display data loss at different stages. - generate_histogram_chart: Generate a histogram, used to display the distribution of data by dividing it into intervals and counting the number of data points in each interval. - generate_line_chart: Generate a line chart, used to display the trend of data over time or another continuous variable. - generate_liquid_chart: Generate a liquid chart, used to display the proportion of data, visually representing percentages in the form of water-filled spheres. - generate_mind_map: Generate a mind-map, used to display thought processes and hierarchical information. - generate_network_graph: Generate a network graph, used to display relationships and connections between nodes. - generate_organization_chart: Generate an organizational chart, used to display the structure of an organization and personnel relationships. - generate_path_map: Generate a path-map, used to display route planning results for POIs. - generate_pie_chart: Generate a pie chart, used to display the proportion of data, dividing it into parts represented by sectors showing the percentage of each part. - generate_pin_map: Generate a pin-map, used to show the distribution of POIs. - generate_radar_chart: Generate a radar chart, used to display multi-dimensional data comprehensively, showing multiple dimensions in a radar-like format. - generate_sankey_chart: Generate a sankey chart, used to display data flow and volume, representing the movement of data between different nodes in a Sankey-style format. - generate_scatter_chart: Generate a scatter plot, used to display the relationship between two variables, showing data points as scattered dots on a coordinate system. - generate_treemap_chart: Generate a treemap, used to display hierarchical data, showing data in rectangular forms where the size of rectangles represents the value of the data. - generate_venn_chart: Generate a venn diagram, used to display relationships between sets, including intersections, unions, and differences. - generate_violin_chart: Generate a violin plot, used to display the distribution of data, combining features of boxplots and density plots to provide a more detailed view of the data distribution. - generate_word_cloud_chart: Generate a word-cloud, used to display the frequency of words in textual data, with font sizes indicating the frequency of each word. - generate_table: Generate a structured table, used to organize and present data in rows and columns, facilitating clear and concise information display for easy reading and analysis. ## 输出格式 - 你**必须且只能**输出一个符合以下结构的 **纯 JSON 对象**,不得包含任何额外文本、注释、换行或 Markdown 格式: ```json {{ "sql_query": "生成的SQL语句字符串", "chart_type": "推荐的图表类型字符串,如 \"generate_area_chart\"" }} """ ) chain = prompt | llm try: response = chain.invoke( { "db_schema": state["db_info"], "user_query": state["user_query"], "current_time": datetime.now().strftime("%Y-%m-%d %H:%M:%S"), } ) clean_json_str = response.content.strip().removeprefix("```json").strip().removesuffix("```").strip() state["generated_sql"] = json.loads(clean_json_str)["sql_query"] # mcp-hub 服务默认添加前缀防止重复问题 state["chart_type"] = "mcp-server-chart-" + json.loads(clean_json_str)["chart_type"] except Exception as e: traceback.print_exception(e) logger.error(f"Error in generating: {e}") state["generated_sql"] = "No SQL query generated" return state
四、执行与渲染:DuckDB + 可视化
1. SQL 执行
import ioimport loggingimport tracebackimport duckdbimport requestsimport pandas as pdfrom agent.excel.excel_agent_state import ExecutionResultfrom common.minio_util import MinioUtilslogger = logging.getLogger(__name__)minio_util = MinioUtils()def exe_sql_excel_query(state): """ 执行sql语句 :param state: :return: """ file_list_ = state["file_list"] try: # 获取文件信息 excel_file: dict = file_list_[0] file_key = excel_file.get("source_file_key") # 获取文件URL file_url = minio_util.get_file_url_by_key(object_key=file_key) extension = file_key.split(".")[-1].lower() # 根据文件类型读取数据 if extension in ["xlsx", "xls"]: response = requests.get(file_url) df = pd.read_excel(io.BytesIO(response.content), engine="openpyxl") elif extension == "csv": df = pd.read_csv(file_url) else: logger.error(f"不支持的文件扩展名: {extension}") # 连接到DuckDB (这里使用内存数据库) 并注册DataFrame con = duckdb.connect(database=":memory:") # 注册DataFrame table_name = state["db_info"]["table_name"] con.register(table_name, df) if table_name != "excel_table": con.register("excel_table", df) # 解析模型输出并获取SQL语句 sql = state["generated_sql"].replace("`", "") # 移除反引号以避免SQL语法错误 # 执行SQL查询 cursor = con.execute(sql) # 获取列名称和查询结果的数据行 columns = [description[0] for description in cursor.description] rows = cursor.fetchall() # 构建结果字典 result = [dict(zip(columns, row)) for row in rows] # 成功情况 state["execution_result"] = ExecutionResult(success=True, columns=columns, data=result) except Exception as e: state["execution_result"] = ExecutionResult(success=False, columns=[], data=[], error=str(e)) traceback.print_exception(e) logging.error(f"Error in executing SQL query: {e}") return state
2. 图表渲染
import osimport loggingfrom langchain_mcp_adapters.client import MultiServerMCPClientfrom langchain_openai import ChatOpenAIfrom langgraph.prebuilt import create_react_agentfrom agent.text2sql.state.agent_state import AgentState"""AntV mcp 数据渲染节点"""asyncdef data_render_ant(state: AgentState): """ 蚂蚁antV数据图表渲染 mcphub 按group指定查询AntV-chart工具 减少上下文token :return: """ client = MultiServerMCPClient( { "mcphub-sse": { "url": os.getenv("MCP_HUB_DATABASE_QA_GROUP_URL"), "transport": "streamable_http", } } ) # 获取上一个步骤目标工具 过滤工具集减少token和大模型幻觉问题 chart_type = state["chart_type"] tools = await client.get_tools() tools = [tool for tool in tools if tool.name == chart_type] llm = ChatOpenAI( model=os.getenv("MODEL_NAME", "qwen-plus"), temperature=float(os.getenv("MODEL_TEMPERATURE", 0.75)), base_url=os.getenv("MODEL_BASE_URL", "https://dashscope.aliyuncs.com/compatible-mode/v1"), api_key=os.getenv("MODEL_API_KEY"), # max_tokens=int(os.getenv("MAX_TOKENS", 20000)), top_p=float(os.getenv("TOP_P", 0.8)), frequency_penalty=float(os.getenv("FREQUENCY_PENALTY", 0.0)), presence_penalty=float(os.getenv("PRESENCE_PENALTY", 0.0)), timeout=float(os.getenv("REQUEST_TIMEOUT", 30.0)), max_retries=int(os.getenv("MAX_RETRIES", 3)), streaming=os.getenv("STREAMING", "True").lower() == "true", # 将额外参数通过 extra_body 传递 extra_body={}, ) result_data = state["execution_result"] chart_agent = create_react_agent( model=llm, tools=tools, prompt=f""" 你是一位经验丰富的BI专家,必须严格按照以下步骤操作,并且必须调用MCP图表工具: ### 重要说明 - 你必须调用可用的MCP图表工具来生成图表,这是强制要求 - 不允许返回默认示例链接或虚构链接 - 如果工具调用失败,请明确说明失败原因 ### 任务步骤 1. **分析数据特征**:仔细理解输入数据结构 2. **调用工具**:必须使用"{chart_type}"工具进行图表渲染 3. **填充参数**:根据数据特征填充图表参数 4. **生成图表**:调用MCP工具并等待真实响应 5. **返回结果**:只返回真实的图表链接 ### 输入数据 {result_data} ### 严格要求 - 必须实际调用MCP工具,不能模拟或假设 - 必须返回真实的图表链接,不能返回示例链接 - x轴和y轴标签使用中文 - 如果无法生成图表,请说明具体原因 ### 返回格式  """, ) result = await chart_agent.ainvoke( {"messages": [("user", "根据输入数据选择合适的MCP图表工具进行渲染")]}, config={"configurable": {"thread_id": "chart-render"}}, ) logging.info(f"图表代理调用结果: {result}") state["chart_url"] = result["messages"][-1].content return state
五、总结与展望
本文实现了一个完整的 自然语言 → SQL → 结果 → 可视化 的智能表格分析链路。其优势在于:
- 低门槛:业务人员也能进行复杂数据分析。
- 高效率:自动化替代手动操作。
- 可扩展:支持接入更多数据源和图表类型。
🌈 项目亮点
- ✅ 集成 MCP 多智能体架构
- ✅ 支持 Dify / LangChain / LlamaIndex / Ollama / vLLM / Neo4j
- ✅ 前端采用 Vue3 + TypeScript + Vite5,现代化交互体验
- ✅ 内置 ECharts / AntV 图表问答 + CSV 表格问答
- ✅ 支持对接主流 RAG 系统 与 Text2SQL 引擎
- ✅ 轻量级 Sanic 后端,适合快速部署与二次开发
- ✅ 项目已被蚂蚁官方推荐收录
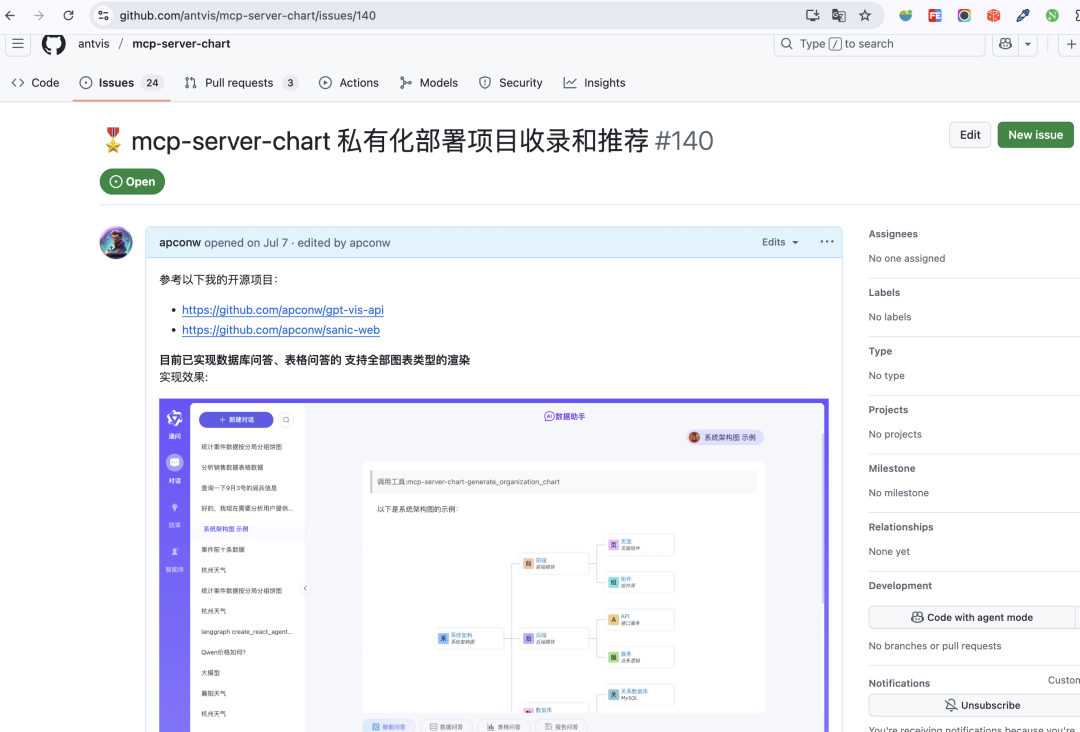
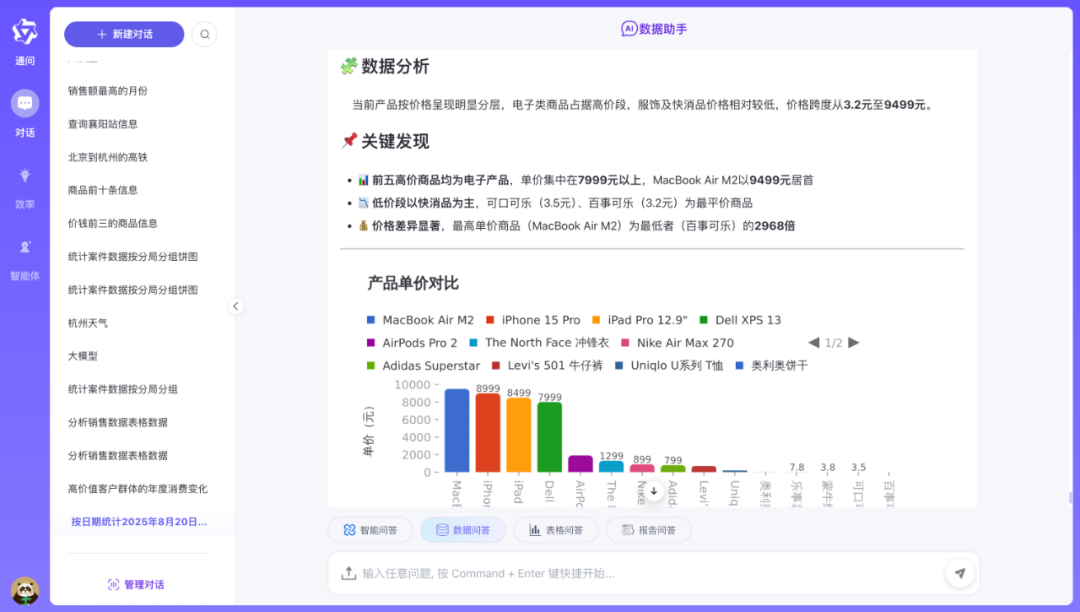
AntV
运行效果:
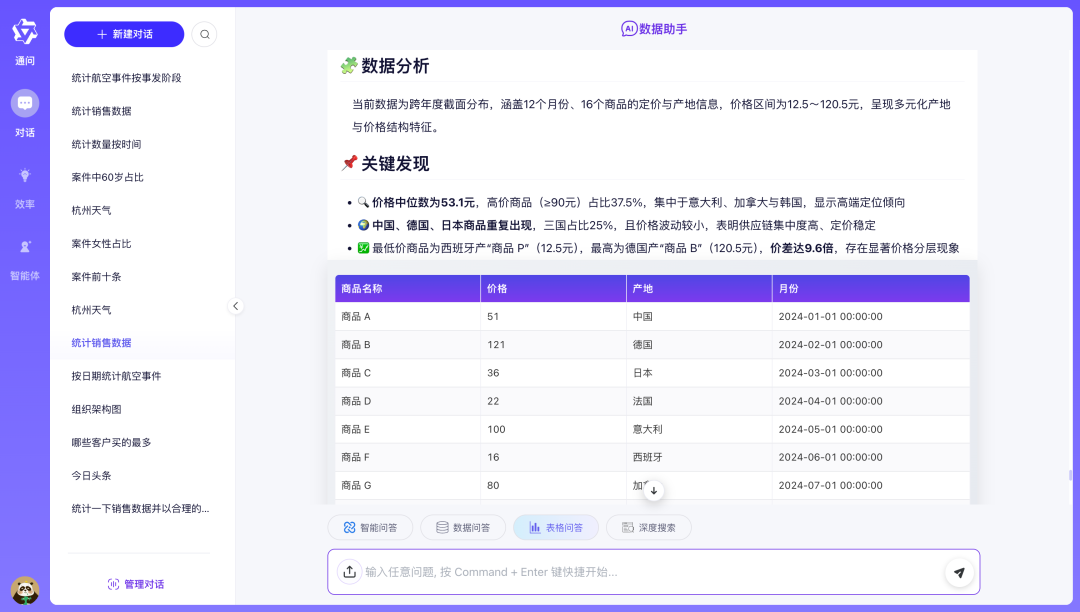
表格问答
最后
为什么要学AI大模型
当下,⼈⼯智能市场迎来了爆发期,并逐渐进⼊以⼈⼯通⽤智能(AGI)为主导的新时代。企业纷纷官宣“ AI+ ”战略,为新兴技术⼈才创造丰富的就业机会,⼈才缺⼝将达 400 万!
DeepSeek问世以来,生成式AI和大模型技术爆发式增长,让很多岗位重新成了炙手可热的新星,岗位薪资远超很多后端岗位,在程序员中稳居前列。
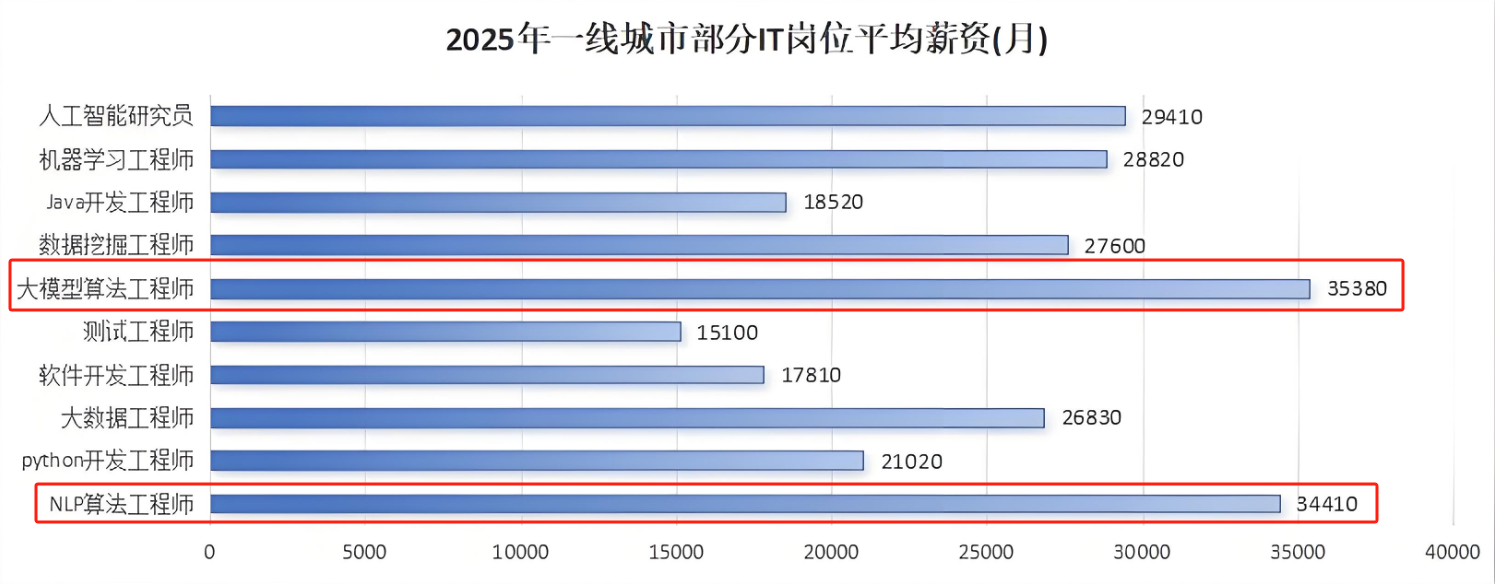
与此同时AI与各行各业深度融合,飞速发展,成为炙手可热的新风口,企业非常需要了解AI、懂AI、会用AI的员工,纷纷开出高薪招聘AI大模型相关岗位。
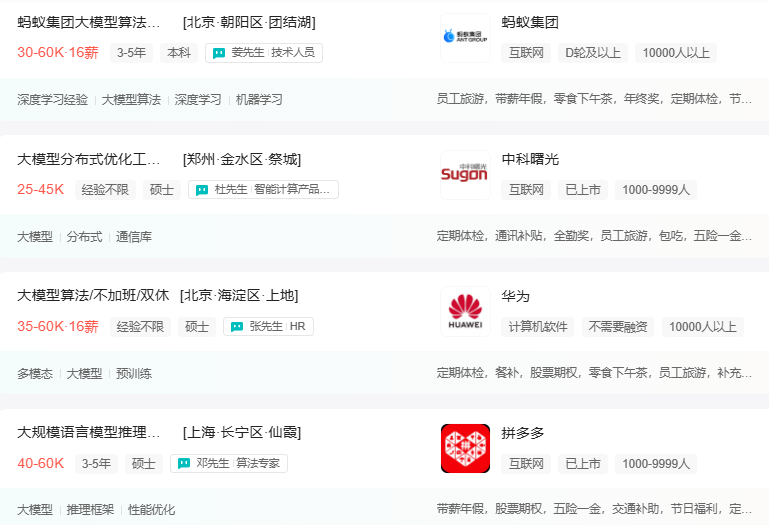
最近很多程序员朋友都已经学习或者准备学习 AI 大模型,后台也经常会有小伙伴咨询学习路线和学习资料,我特别拜托北京清华大学学士和美国加州理工学院博士学位的鲁为民老师给大家这里给大家准备了一份涵盖了AI大模型入门学习思维导图、精品AI大模型学习书籍手册、视频教程、实战学习等录播视频 全系列的学习资料,这些学习资料不仅深入浅出,而且非常实用,让大家系统而高效地掌握AI大模型的各个知识点。
这份完整版的大模型 AI 学习资料已经上传CSDN,朋友们如果需要可以微信扫描下方CSDN官方认证二维码免费领取【保证100%免费】

AI大模型系统学习路线
在面对AI大模型开发领域的复杂与深入,精准学习显得尤为重要。一份系统的技术路线图,不仅能够帮助开发者清晰地了解从入门到精通所需掌握的知识点,还能提供一条高效、有序的学习路径。
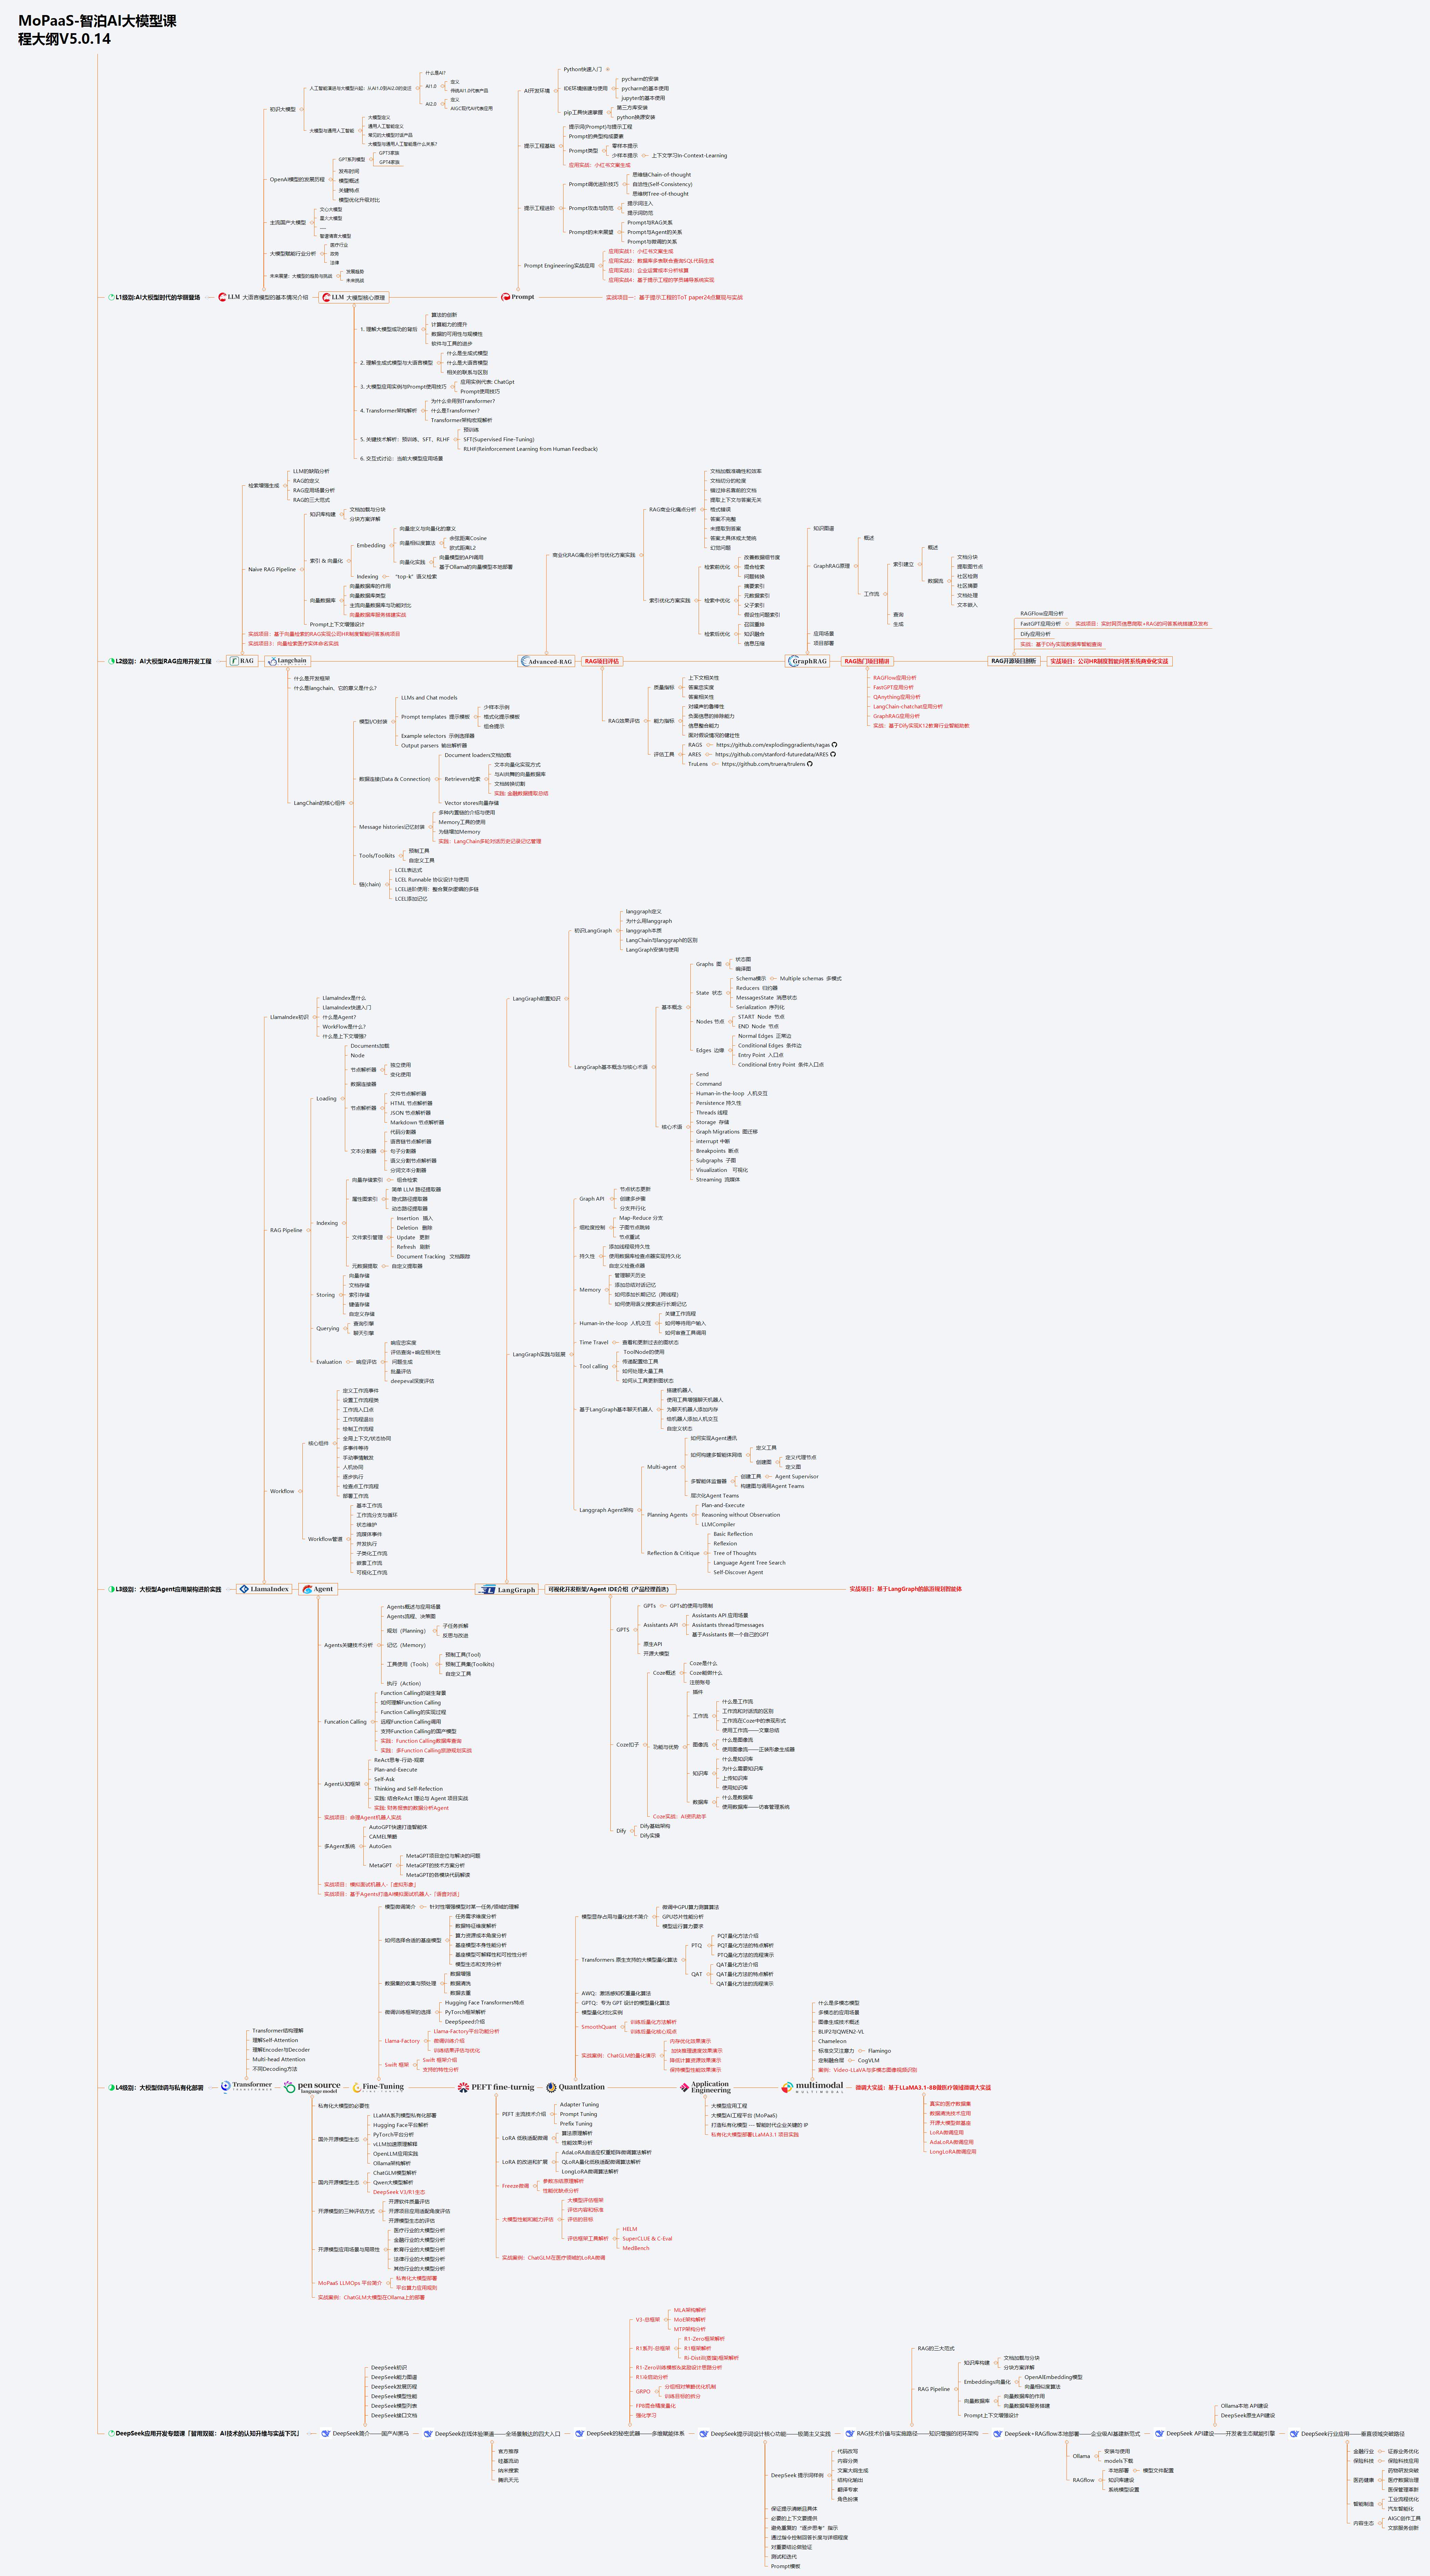
但知道是一回事,做又是另一回事,初学者最常遇到的问题主要是理论知识缺乏、资源和工具的限制、模型理解和调试的复杂性,在这基础上,找到高质量的学习资源,不浪费时间、不走弯路,又是重中之重。
AI大模型入门到实战的视频教程+项目包
看视频学习是一种高效、直观、灵活且富有吸引力的学习方式,可以更直观地展示过程,能有效提升学习兴趣和理解力,是现在获取知识的重要途径
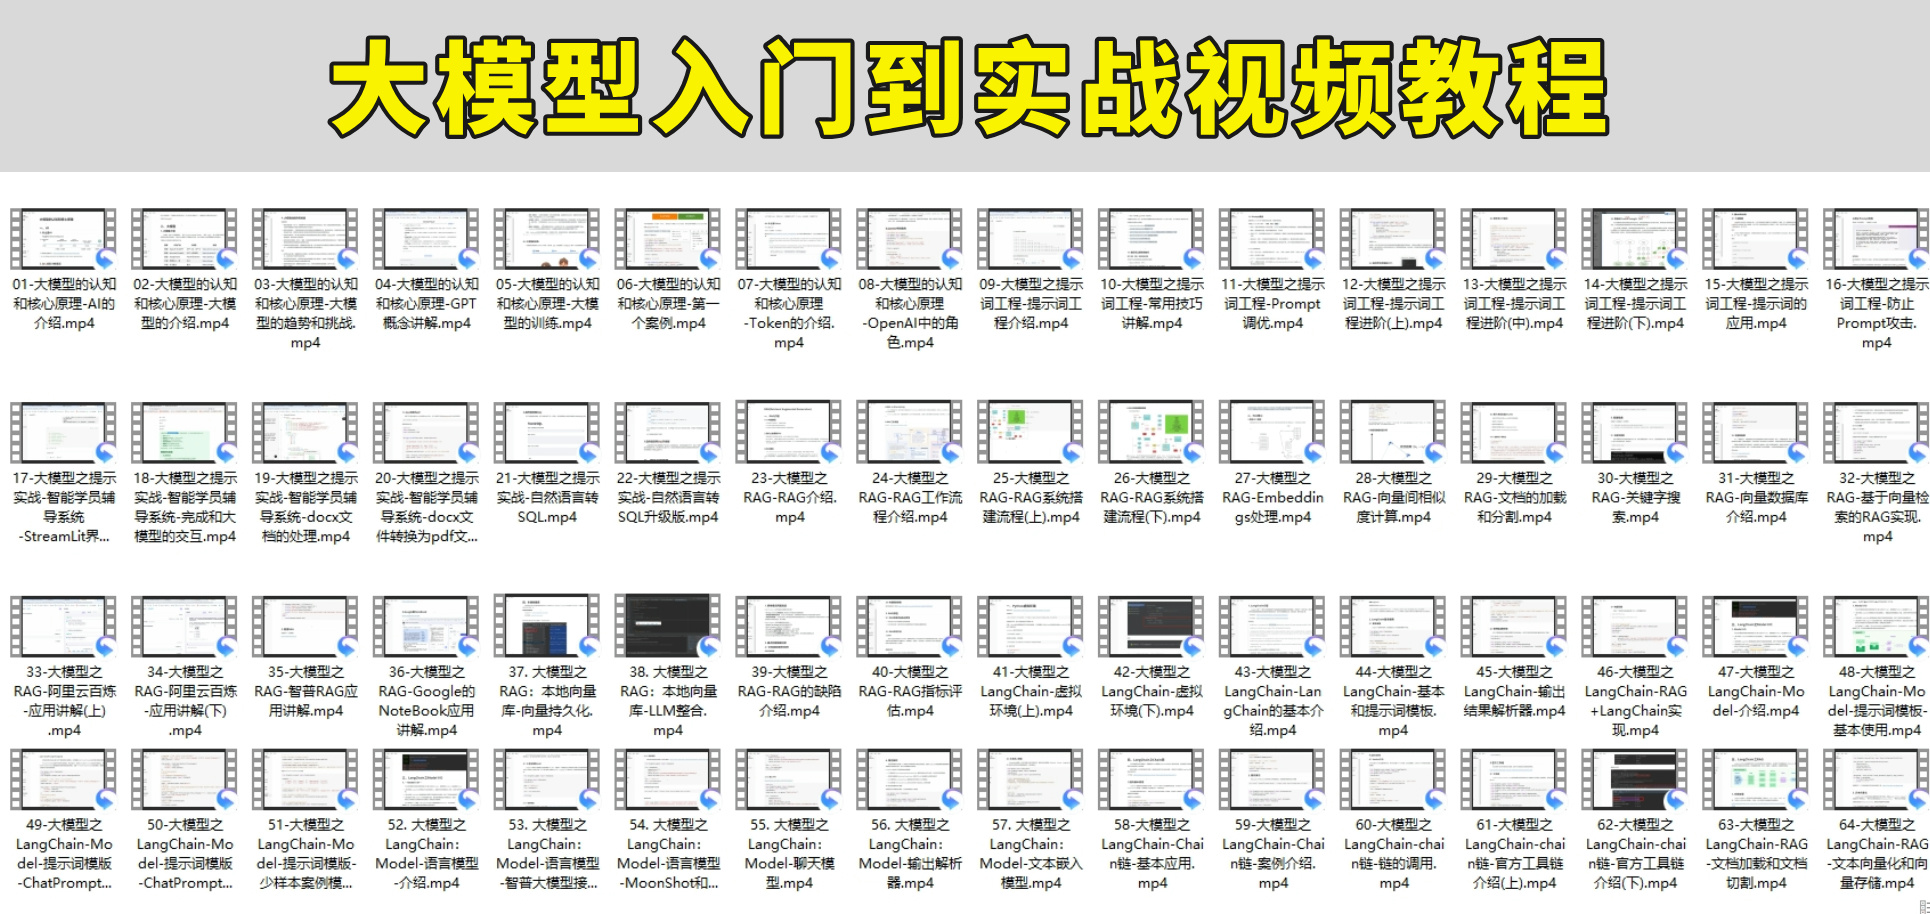
光学理论是没用的,要学会跟着一起敲,要动手实操,才能将自己的所学运用到实际当中去,这时候可以搞点实战案例来学习。
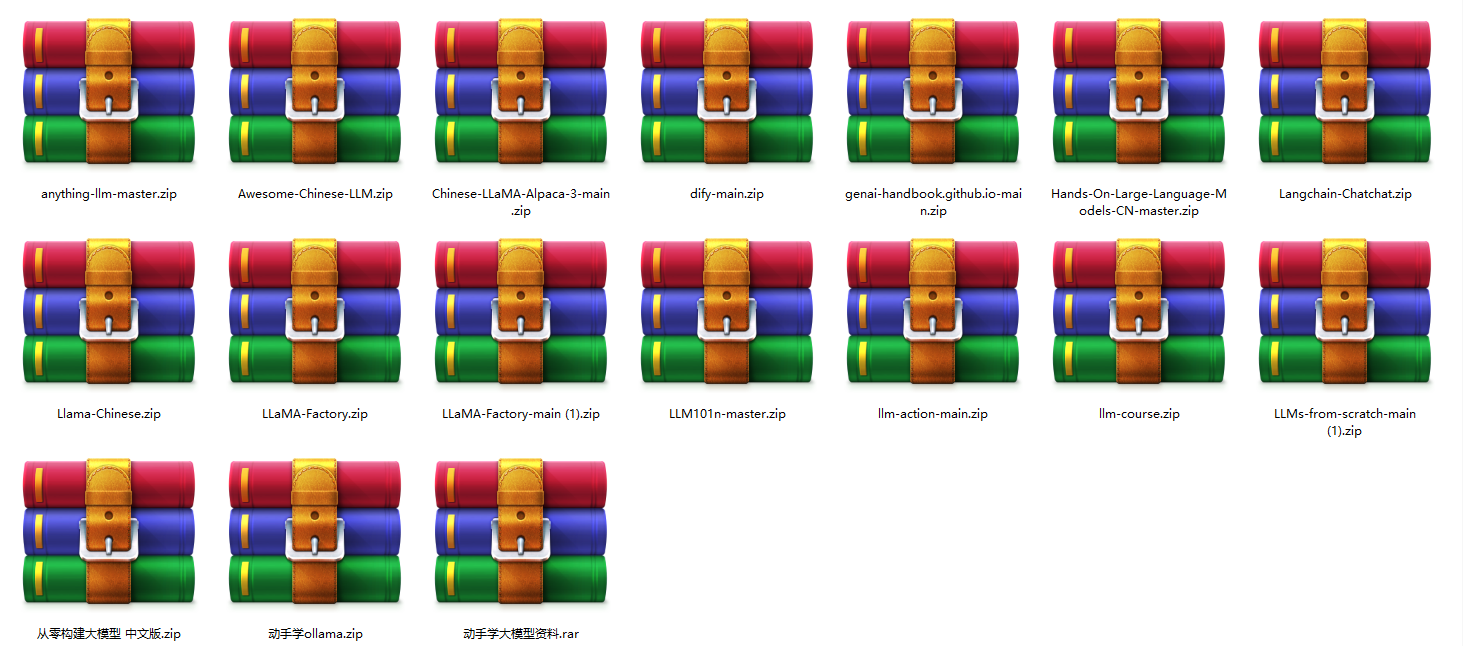
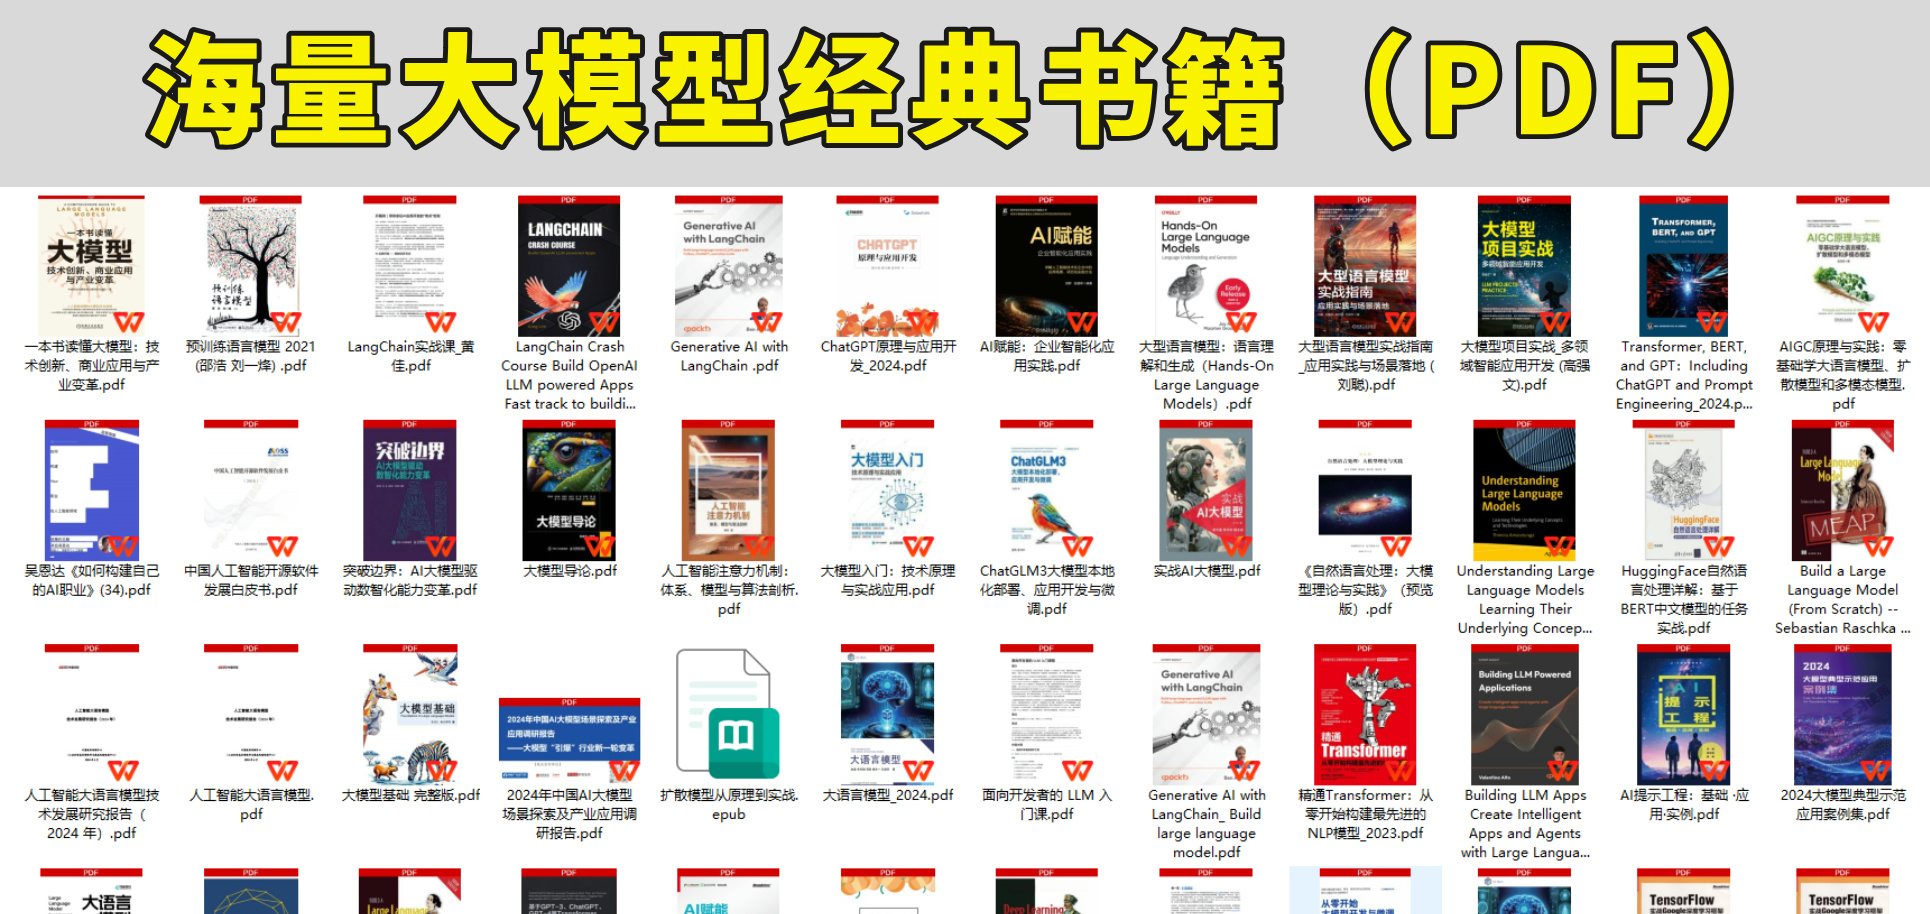
海量AI大模型必读的经典书籍(PDF)
阅读AI大模型经典书籍可以帮助读者提高技术水平,开拓视野,掌握核心技术,提高解决问题的能力,同时也可以借鉴他人的经验。对于想要深入学习AI大模型开发的读者来说,阅读经典书籍是非常有必要的。
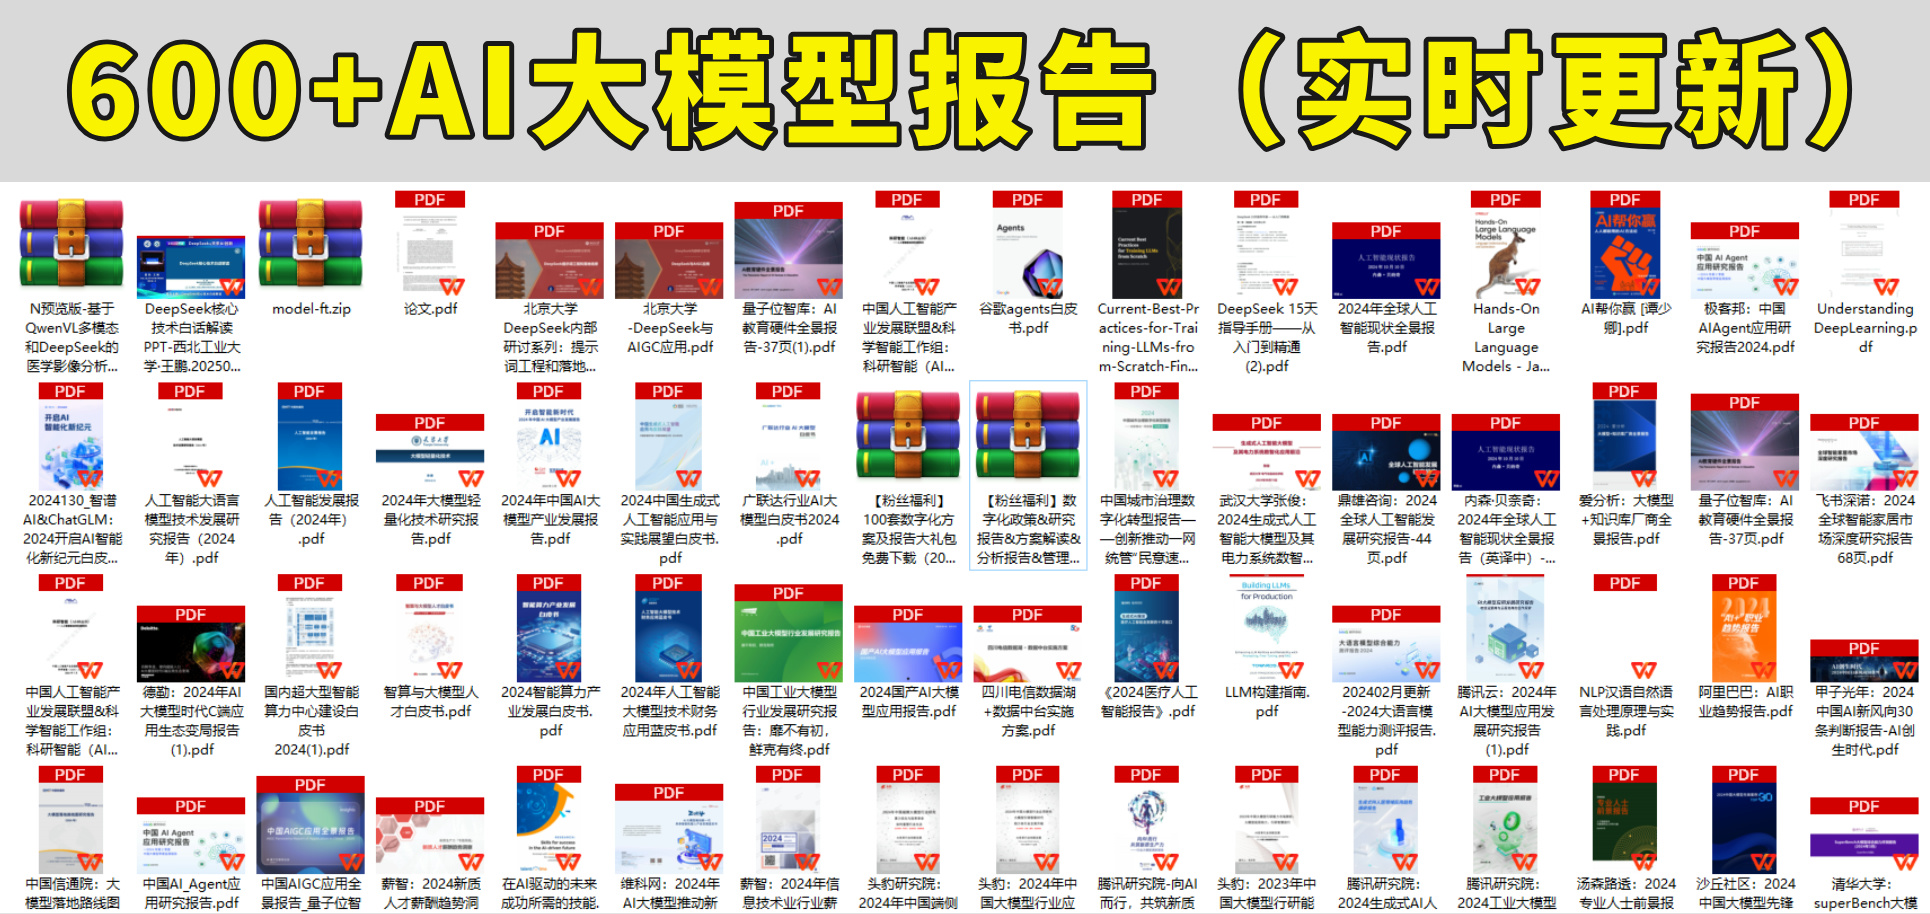
600+AI大模型报告(实时更新)
这套包含640份报告的合集,涵盖了AI大模型的理论研究、技术实现、行业应用等多个方面。无论您是科研人员、工程师,还是对AI大模型感兴趣的爱好者,这套报告合集都将为您提供宝贵的信息和启示。
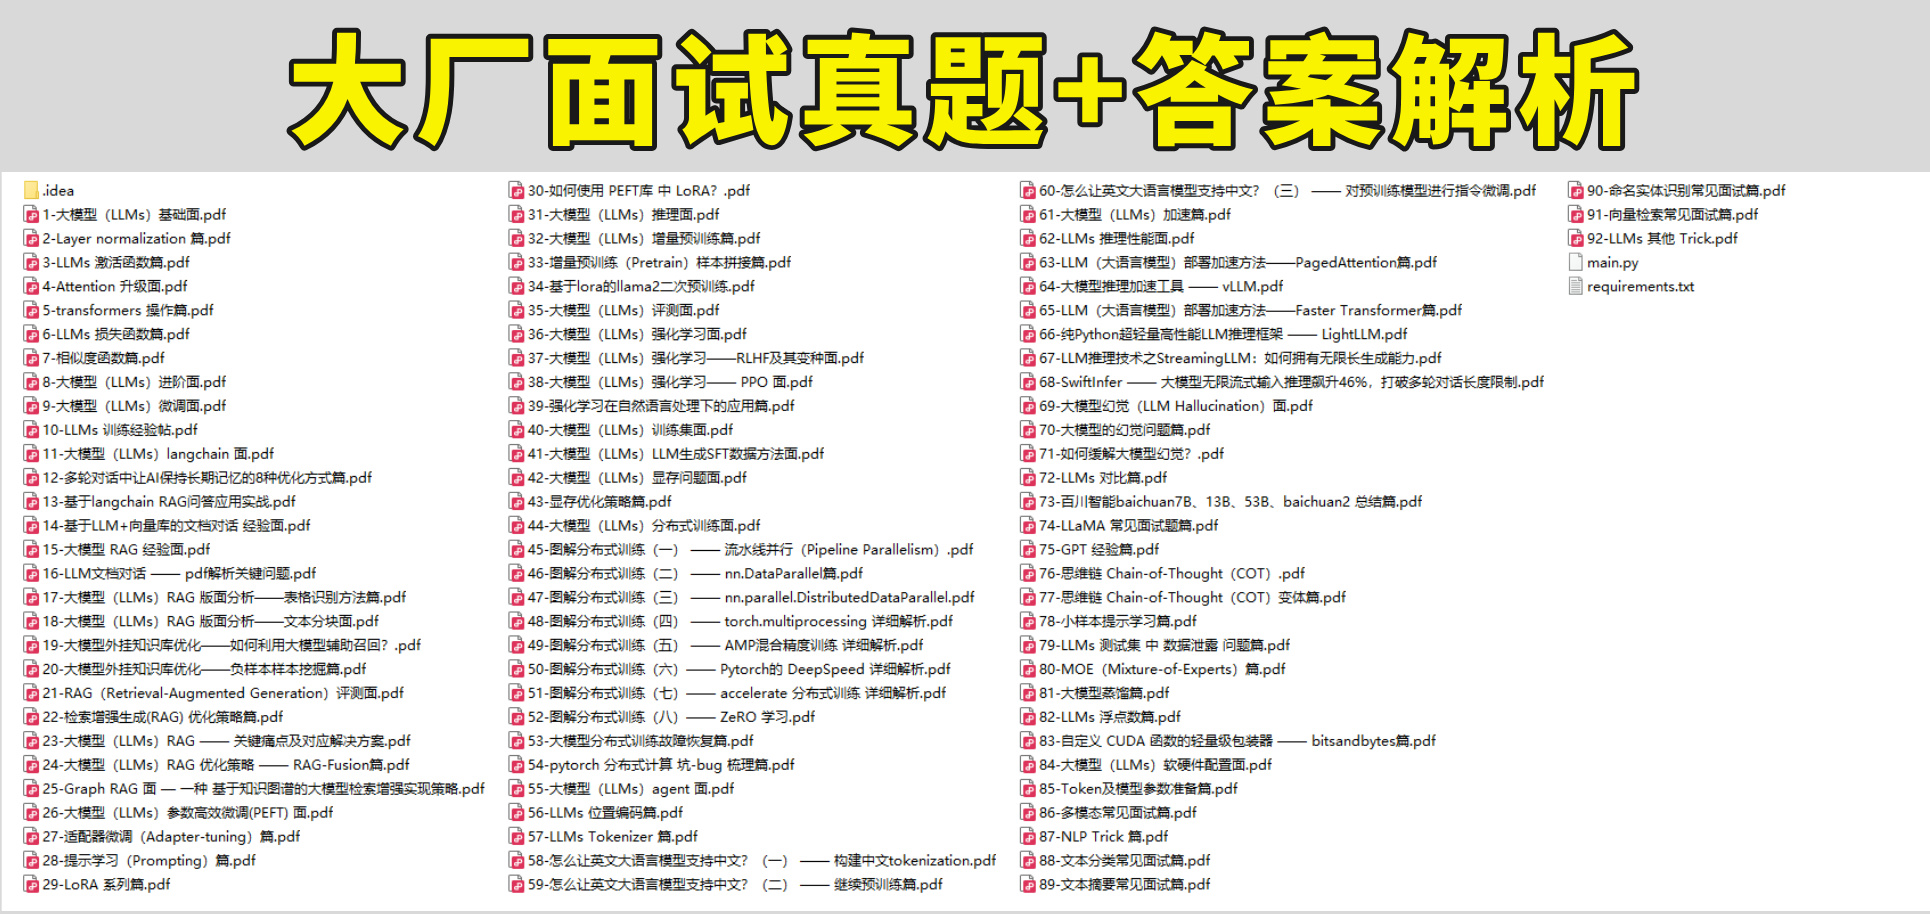
AI大模型面试真题+答案解析
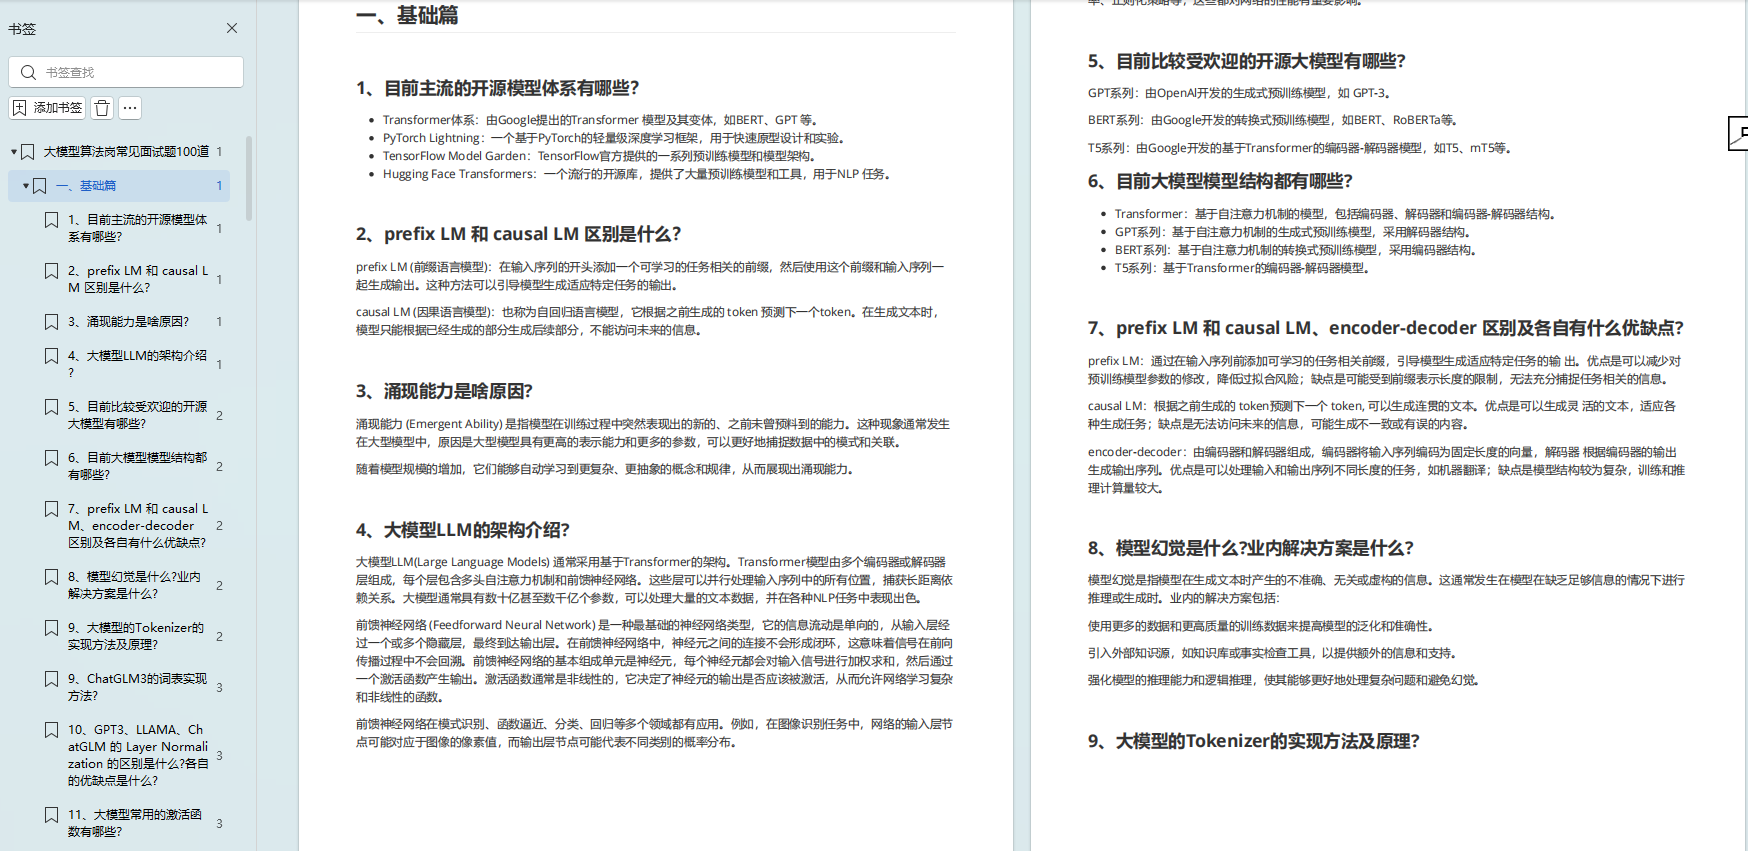
我们学习AI大模型必然是想找到高薪的工作,下面这些面试题都是总结当前最新、最热、最高频的面试题,并且每道题都有详细的答案,面试前刷完这套面试题资料,小小offer,不在话下
这份完整版的大模型 AI 学习资料已经上传CSDN,朋友们如果需要可以微信扫描下方CSDN官方认证二维码免费领取【保证100%免费】
更多推荐
 27
27 0
0- 0


 已为社区贡献265条内容

所有评论(0)