
一键搞定K8s监控:Prometheus+Grafana自动化部署
💡 15分钟搞定Kubernetes全栈监控:Prometheus+Grafana自动化部署,复制粘贴即可复现
内容速览
痛点直击:K8s集群监控复杂度高,手动配置易出错,组件依赖关系混乱
解决方案:一键自动化部署脚本,涵盖权限配置、服务发现、数据持久化完整流程
核心成果:✅ 3节点集群监控 ✅ 80+指标采集 ✅ 可视化面板 ✅ 15分钟交付
🔗 关联学习路径
📚 前置知识:| 从传统Linux部署到容器化:实践对比与工程化指南 | 涵盖Docker安装、镜像加速配置等基础环境准备

部署架构
架构说明:监控组件采用独立命名空间部署,通过 NodePort 服务暴露访问端点。
环境要求
| 节点角色 | 状态 | 版本 | IP地址 | 操作系统 |
|---|---|---|---|---|
| control-plane | Ready | v1.28.2 | 192.168.209.100 | CentOS Linux 7 |
| worker | Ready | v1.28.2 | 192.168.209.101 | CentOS Linux 7 |
| worker | Ready | v1.28.2 | 192.168.209.102 | CentOS Linux 7 |
| 组件 | 版本 | 角色 | 资源需求 |
|---|---|---|---|
| Kubernetes | ≥1.20 | 容器编排平台 | 2核4GB |
| Docker | ≥20.10 | 容器运行时 | 1核2GB |
| Helm | ≥3.0 | 包管理工具(可选) | 256MB |
前置检查:
kubectl get nodes -o wide  # 节点资源总览
kubectl cluster-info       # 验证集群通不通
🛠️ 解决方案:5步构建完整监控体系
步骤1:架构规划与权限设计
操作要点:
- ✅ 独立命名空间隔离(prometheus/grafana)
- ✅ cluster-admin权限确保全集群元数据访问
- ✅ RBAC细粒度权限控制
逻辑说明:Prometheus需要通过API Server获取Node、Pod、Service、Endpoint等集群元数据,cluster-admin权限是数据采集的基础保障
验证方法:部署后执行 kubectl get clusterrolebinding prometheus 确认权限绑定成功
步骤2:节点级指标采集(Node-Exporter)
操作要点:
- ✅ DaemonSet模式确保每个节点部署
- ✅ 共享主机网络/进程/IPC命名空间
- ✅ 关键系统路径挂载(/proc、/sys、/)
逻辑说明:Node-Exporter需要深度访问主机系统信息,共享命名空间和挂载系统路径是获取CPU、内存、磁盘等底层指标的必备条件
验证方法:执行 kubectl get daemonset -n prometheus 确认每个节点都有Pod运行
关键配置解析:
# 网络共享 - 获取主机网络接口指标
hostNetwork: true
# 进程空间共享 - 获取进程级指标
hostPID: true
# IPC共享 - 获取系统V共享内存等指标
hostIPC: true
步骤3:一键自动化部署脚本
功能说明:集成所有配置的一键部署脚本,包含环境检查、用户交互、服务部署、状态验证完整流程
运行条件:
- ✅ Kubernetes集群已就绪(≥1.20版本)
- ✅ kubectl可正常连接集群
- ✅ 具备cluster-admin权限
- ✅ 节点支持SSH连接(可选,用于自动创建存储目录)
验证方法:脚本执行完毕后访问Prometheus和Grafana Web界面确认服务正常
#!/bin/bash

# Kubernetes Prometheus & Grafana 一键部署脚本
# 作者:做运维的阿瑞
# 版本:v1.0

set -e

# 颜色输出定义
RED='\033[0;31m'
GREEN='\033[0;32m'
YELLOW='\033[1;33m'
BLUE='\033[0;34m'
NC='\033[0m' # No Color

# 日志函数
log_info() {
    echo -e "${BLUE}[INFO]${NC} $1"
}

log_success() {
    echo -e "${GREEN}[SUCCESS]${NC} $1"
}

log_warning() {
    echo -e "${YELLOW}[WARNING]${NC} $1"
}

log_error() {
    echo -e "${RED}[ERROR]${NC} $1"
}

# 检查命令是否存在
command_exists() {
    command -v "$1" >/dev/null 2>&1
}

# 检查必需工具
check_requirements() {
    log_info "检查必需工具..."

    if ! command_exists kubectl; then
        log_error "kubectl 未安装,请先安装kubectl"
        exit 1
    fi

    if ! command_exists jq; then
        log_warning "jq 未安装,建议安装以便更好地解析JSON输出"
    fi

    # 检查kubectl是否能连接到集群
    if ! kubectl cluster-info >/dev/null 2>&1; then
        log_error "无法连接到Kubernetes集群,请检查kubectl配置"
        exit 1
    fi

    log_success "集群连接正常"
}

# 获取用户输入
get_user_input() {
    log_info "开始配置部署参数..."
    echo "=================================="

    # 选择部署节点
    log_info "可用的集群节点:"
    kubectl get nodes -o wide
    echo ""

    read -p "请选择用于部署Prometheus和Grafana的节点名称 (默认: node1): " DEPLOY_NODE
    DEPLOY_NODE=${DEPLOY_NODE:-node1}

    # 验证节点是否存在
    if ! kubectl get node "$DEPLOY_NODE" >/dev/null 2>&1; then
        log_error "节点 $DEPLOY_NODE 不存在,请重新运行脚本并选择正确的节点"
        exit 1
    fi

    # 获取节点IP
    NODE_IP=$(kubectl get node "$DEPLOY_NODE" -o jsonpath='{.status.addresses[?(@.type=="InternalIP")].address}')
    log_info "选择的节点IP: $NODE_IP"

    # 配置存储路径
    read -p "请输入Prometheus数据存储路径 (默认: /data/prometheus): " STORAGE_PATH
    STORAGE_PATH=${STORAGE_PATH:-/data/prometheus}

    # 配置NodePort端口
    read -p "请输入Prometheus NodePort端口 (默认: 30090): " PROMETHEUS_PORT
    PROMETHEUS_PORT=${PROMETHEUS_PORT:-30090}

    read -p "请输入Grafana NodePort端口 (默认: 32000): " GRAFANA_PORT
    GRAFANA_PORT=${GRAFANA_PORT:-32000}

    # 配置镜像仓库地址
    read -p "请输入镜像仓库地址 (默认: docker.io): " REGISTRY_URL
    REGISTRY_URL=${REGISTRY_URL:-docker.io}

    # 配置数据保留期
    read -p "请输入Prometheus数据保留期 (默认: 30d): " RETENTION_TIME
    RETENTION_TIME=${RETENTION_TIME:-30d}

    # 确认配置
    echo ""
    echo "=================================="
    log_info "部署配置确认:"
    echo "部署节点: $DEPLOY_NODE"
    echo "节点IP: $NODE_IP"
    echo "存储路径: $STORAGE_PATH"
    echo "Prometheus端口: $PROMETHEUS_PORT"
    echo "Grafana端口: $GRAFANA_PORT"
    echo "镜像仓库: $REGISTRY_URL"
    echo "数据保留期: $RETENTION_TIME"
    echo "=================================="

    read -p "确认以上配置正确吗? (y/N): " CONFIRM
    if [[ "$CONFIRM" != "y" && "$CONFIRM" != "Y" ]]; then
        log_info "取消部署,请重新运行脚本进行配置"
        exit 0
    fi
}

# 创建存储目录
create_storage() {
    log_info "在节点 $DEPLOY_NODE 上创建存储目录..."

    # 检查是否能SSH到目标节点
    if ssh -o ConnectTimeout=5 "$DEPLOY_NODE" "echo 'SSH连接测试'" >/dev/null 2>&1; then
        ssh "$DEPLOY_NODE" "mkdir -p $STORAGE_PATH && chmod 777 $STORAGE_PATH"
        log_success "存储目录创建成功"
    else
        log_warning "无法通过SSH连接到 $DEPLOY_NODE,请手动在节点上执行:"
        log_warning "mkdir -p $STORAGE_PATH && chmod 777 $STORAGE_PATH"
        read -p "按Enter键继续..."
    fi
}

# 创建命名空间
create_namespaces() {
    log_info "创建命名空间..."

    kubectl create ns prometheus --dry-run=client -o yaml | kubectl apply -f -
    kubectl create ns grafana --dry-run=client -o yaml | kubectl apply -f -

    log_success "命名空间创建完成"
}

# 部署RBAC
deploy_rbac() {
    log_info "部署RBAC权限..."

    kubectl -n prometheus apply -f - <<EOF
apiVersion: v1
kind: ServiceAccount
metadata:
  name: prometheus
---
apiVersion: rbac.authorization.k8s.io/v1
kind: ClusterRoleBinding
metadata:
  name: prometheus
roleRef:
  apiGroup: rbac.authorization.k8s.io
  kind: ClusterRole
  name: cluster-admin
subjects:
- kind: ServiceAccount
  name: prometheus
  namespace: prometheus
EOF

    log_success "RBAC权限部署完成"
}

# 部署Node-Exporter
deploy_node_exporter() {
    log_info "部署Node-Exporter..."

    kubectl -n prometheus apply -f - <<EOF
apiVersion: apps/v1
kind: DaemonSet
metadata:
  name: node-exporter
  namespace: prometheus
spec:
  selector:
    matchLabels: {app: node-exporter}
  template:
    metadata:
      labels: {app: node-exporter}
    spec:
      hostNetwork: true
      hostPID: true
      hostIPC: true
      tolerations:
      - operator: Exists
      containers:
      - name: node-exporter
        image: $REGISTRY_URL/prom/node-exporter:v1.8.0
        args:
        - --path.procfs=/host/proc
        - --path.sysfs=/host/sys
        - --path.rootfs=/host/root
        - --collector.filesystem.ignored-mount-points=^/(sys|proc|dev|host|etc)(\$|/)
        ports:
        - containerPort: 9100
        securityContext: {privileged: true}
        volumeMounts:
        - {name: proc,  mountPath: /host/proc,  readOnly: true}
        - {name: sys,   mountPath: /host/sys,   readOnly: true}
        - {name: root,  mountPath: /host/root,  readOnly: true}
      volumes:
      - name: proc
        hostPath: {path: /proc}
      - name: sys
        hostPath: {path: /sys}
      - name: root
        hostPath: {path: /}
EOF

    log_success "Node-Exporter部署完成"
}

# 部署Prometheus配置
deploy_prometheus_config() {
    log_info "部署Prometheus配置..."

    kubectl -n prometheus apply -f - <<EOF
apiVersion: v1
kind: ConfigMap
metadata:
  name: prometheus-config
  namespace: prometheus
data:
  prometheus.yml: |
    global:
      scrape_interval: 15s
      evaluation_interval: 15s
    scrape_configs:
    - job_name: 'node'
      kubernetes_sd_configs:
      - role: node
      relabel_configs:
      - source_labels: [__address__]
        regex: '(.*):10250'
        replacement: '\${1}:9100'
        target_label: __address__
      - action: labelmap
        regex: __meta_kubernetes_node_label_(.+)
    - job_name: 'cadvisor'
      kubernetes_sd_configs:
      - role: node
      scheme: https
      tls_config: {ca_file: /var/run/secrets/kubernetes.io/serviceaccount/ca.crt}
      bearer_token_file: /var/run/secrets/kubernetes.io/serviceaccount/token
      relabel_configs:
      - target_label: __address__
        replacement: kubernetes.default.svc:443
      - source_labels: [__meta_kubernetes_node_name]
        target_label: __metrics_path__
        replacement: /api/v1/nodes/\${1}/proxy/metrics/cadvisor
EOF

    log_success "Prometheus配置部署完成"
}

# 部署Prometheus
deploy_prometheus() {
    log_info "部署Prometheus服务..."

    kubectl -n prometheus apply -f - <<EOF
apiVersion: apps/v1
kind: Deployment
metadata:
  name: prometheus
  namespace: prometheus
spec:
  replicas: 1
  selector:
    matchLabels: {app: prometheus}
  template:
    metadata:
      labels: {app: prometheus}
    spec:
      nodeName: $DEPLOY_NODE
      serviceAccountName: prometheus
      containers:
      - name: prometheus
        image: $REGISTRY_URL/prom/prometheus:v2.51.1
        args:
        - --config.file=/etc/prometheus/prometheus.yml
        - --storage.tsdb.path=/prometheus
        - --storage.tsdb.retention=$RETENTION_TIME
        - --web.enable-lifecycle
        ports:
        - containerPort: 9090
        volumeMounts:
        - {name: config, mountPath: /etc/prometheus}
        - {name: data,   mountPath: /prometheus}
      volumes:
      - name: config
        configMap: {name: prometheus-config}
      - name: data
        hostPath: {path: $STORAGE_PATH, type: Directory}
EOF

    log_success "Prometheus部署完成"
}

# 部署Prometheus Service
deploy_prometheus_service() {
    log_info "部署Prometheus Service..."

    kubectl -n prometheus apply -f - <<EOF
apiVersion: v1
kind: Service
metadata:
  name: prometheus
  namespace: prometheus
spec:
  type: NodePort
  ports:
  - port: 9090
    nodePort: $PROMETHEUS_PORT
    targetPort: 9090
  selector: {app: prometheus}
EOF

    log_success "Prometheus Service部署完成"
}

# 部署Grafana
deploy_grafana() {
    log_info "部署Grafana..."

    kubectl -n grafana apply -f - <<EOF
apiVersion: v1
kind: ConfigMap
metadata:
  name: grafana-config
  namespace: grafana
data:
  grafana.ini: |
    [server]
    http_port = 3000
    domain = $NODE_IP
    root_url = %(protocol)s://%(domain)s:$GRAFANA_PORT/
---
apiVersion: apps/v1
kind: Deployment
metadata:
  name: grafana
  namespace: grafana
spec:
  replicas: 1
  selector:
    matchLabels: {app: grafana}
  template:
    metadata:
      labels: {app: grafana}
    spec:
      nodeName: $DEPLOY_NODE
      containers:
      - name: grafana
        image: $REGISTRY_URL/grafana/grafana:11.0.0
        ports:
        - containerPort: 3000
        volumeMounts:
        - name: config
          mountPath: /etc/grafana/grafana.ini
          subPath: grafana.ini
      volumes:
      - name: config
        configMap: {name: grafana-config}
---
apiVersion: v1
kind: Service
metadata:
  name: grafana
  namespace: grafana
spec:
  type: NodePort
  ports:
  - port: 3000
    nodePort: $GRAFANA_PORT
    targetPort: 3000
  selector: {app: grafana}
EOF

    log_success "Grafana部署完成"
}

# 等待Pod就绪
wait_for_pods() {
    local namespace=$1
    local app_label=$2
    local timeout=300

    log_info "等待 $namespace 命名空间中的 $app_label Pod就绪..."

    local start_time=$(date +%s)
    while true; do
        if kubectl -n $namespace get pods -l app=$app_label | grep -q "Running"; then
            if kubectl -n $namespace get pods -l app=$app_label | grep -q "1/1"; then
                log_success "$app_label Pod已就绪"
                return 0
            fi
        fi

        local current_time=$(date +%s)
        local elapsed=$((current_time - start_time))

        if [ $elapsed -gt $timeout ]; then
            log_error "等待超时,请检查Pod状态"
            kubectl -n $namespace get pods -l app=$app_label
            return 1
        fi

        echo -n "."
        sleep 5
    done
}

# 验证部署
verify_deployment() {
    log_info "验证部署状态..."

    echo ""
    log_info "Prometheus Pod状态:"
    kubectl -n prometheus get pods -o wide

    echo ""
    log_info "Grafana Pod状态:"
    kubectl -n grafana get pods -o wide

    echo ""
    log_info "Node-Exporter Pod状态:"
    kubectl -n prometheus get pods -l app=node-exporter -o wide

    # 等待Pod就绪
    wait_for_pods prometheus prometheus
    wait_for_pods grafana grafana

    # 验证服务
    log_info "验证服务端口..."

    # 检查Prometheus
    if curl -s "http://$NODE_IP:$PROMETHEUS_PORT/api/v1/targets" >/dev/null 2>&1; then
        log_success "Prometheus服务正常运行"
        local targets=$(curl -s "http://$NODE_IP:$PROMETHEUS_PORT/api/v1/targets" | jq -r '.status' 2>/dev/null || echo "success")
        log_info "Prometheus目标状态: $targets"
    else
        log_warning "Prometheus服务可能还未完全就绪,请稍后再试"
    fi

    # 检查Grafana
    if curl -s "http://$NODE_IP:$GRAFANA_PORT/api/health" >/dev/null 2>&1; then
        log_success "Grafana服务正常运行"
    else
        log_warning "Grafana服务可能还未完全就绪,请稍后再试"
    fi
}

# 输出访问信息
show_access_info() {
    log_success "部署完成!访问信息如下:"
    echo "=================================="
    echo "Prometheus访问地址: http://$NODE_IP:$PROMETHEUS_PORT"
    echo "Grafana访问地址: http://$NODE_IP:$GRAFANA_PORT"
    echo ""
    echo "Grafana默认账号: admin/admin"
    echo "首次登录需要修改密码"
    echo ""
    echo "Prometheus目标检查: http://$NODE_IP:$PROMETHEUS_PORT/targets"
    echo "=================================="
}

# 保存配置信息
save_config() {
    local config_file="monitoring_deploy_config.txt"
    cat > "$config_file" <<EOF
# Kubernetes监控部署配置
# 生成时间: $(date)

DEPLOY_NODE=$DEPLOY_NODE
NODE_IP=$NODE_IP
STORAGE_PATH=$STORAGE_PATH
PROMETHEUS_PORT=$PROMETHEUS_PORT
GRAFANA_PORT=$GRAFANA_PORT
REGISTRY_URL=$REGISTRY_URL
RETENTION_TIME=$RETENTION_TIME

# 访问地址
PROMETHEUS_URL=http://$NODE_IP:$PROMETHEUS_PORT
GRAFANA_URL=http://$NODE_IP:$GRAFANA_PORT
EOF

    log_info "配置信息已保存到: $config_file"
}

# 清理函数
cleanup() {
    log_info "开始清理监控组件..."

    kubectl delete ns prometheus --ignore-not-found=true
    kubectl delete ns grafana --ignore-not-found=true
    kubectl delete clusterrolebinding prometheus --ignore-not-found=true

    log_success "清理完成"
}

# 主函数
main() {
    echo "=================================="
    echo "Kubernetes Prometheus & Grafana"
    echo "一键部署脚本 v1.0"
    echo "=================================="
    echo ""
[root@master prometheus]#
[root@master prometheus]#
[root@master prometheus]# cat prometheus.sh
#!/bin/bash

# Kubernetes Prometheus & Grafana 一键部署脚本
# 作者:自动化部署解决方案
# 版本:v1.0

set -e

# 颜色输出定义
RED='\033[0;31m'
GREEN='\033[0;32m'
YELLOW='\033[1;33m'
BLUE='\033[0;34m'
NC='\033[0m' # No Color

# 日志函数
log_info() {
    echo -e "${BLUE}[INFO]${NC} $1"
}

log_success() {
    echo -e "${GREEN}[SUCCESS]${NC} $1"
}

log_warning() {
    echo -e "${YELLOW}[WARNING]${NC} $1"
}

log_error() {
    echo -e "${RED}[ERROR]${NC} $1"
}

# 检查命令是否存在
command_exists() {
    command -v "$1" >/dev/null 2>&1
}

# 检查必需工具
check_requirements() {
    log_info "检查必需工具..."

    if ! command_exists kubectl; then
        log_error "kubectl 未安装,请先安装kubectl"
        exit 1
    fi

    if ! command_exists jq; then
        log_warning "jq 未安装,建议安装以便更好地解析JSON输出"
    fi

    # 检查kubectl是否能连接到集群
    if ! kubectl cluster-info >/dev/null 2>&1; then
        log_error "无法连接到Kubernetes集群,请检查kubectl配置"
        exit 1
    fi

    log_success "集群连接正常"
}

# 获取用户输入
get_user_input() {
    log_info "开始配置部署参数..."
    echo "=================================="

    # 选择部署节点
    log_info "可用的集群节点:"
    kubectl get nodes -o wide
    echo ""

    read -p "请选择用于部署Prometheus和Grafana的节点名称 (默认: node1): " DEPLOY_NODE
    DEPLOY_NODE=${DEPLOY_NODE:-node1}

    # 验证节点是否存在
    if ! kubectl get node "$DEPLOY_NODE" >/dev/null 2>&1; then
        log_error "节点 $DEPLOY_NODE 不存在,请重新运行脚本并选择正确的节点"
        exit 1
    fi

    # 获取节点IP
    NODE_IP=$(kubectl get node "$DEPLOY_NODE" -o jsonpath='{.status.addresses[?(@.type=="InternalIP")].address}')
    log_info "选择的节点IP: $NODE_IP"

    # 配置存储路径
    read -p "请输入Prometheus数据存储路径 (默认: /data/prometheus): " STORAGE_PATH
    STORAGE_PATH=${STORAGE_PATH:-/data/prometheus}

    # 配置NodePort端口
    read -p "请输入Prometheus NodePort端口 (默认: 30090): " PROMETHEUS_PORT
    PROMETHEUS_PORT=${PROMETHEUS_PORT:-30090}

    read -p "请输入Grafana NodePort端口 (默认: 32000): " GRAFANA_PORT
    GRAFANA_PORT=${GRAFANA_PORT:-32000}

    # 配置镜像仓库地址
    read -p "请输入镜像仓库地址 (默认: docker.io): " REGISTRY_URL
    REGISTRY_URL=${REGISTRY_URL:-docker.io}

    # 配置数据保留期
    read -p "请输入Prometheus数据保留期 (默认: 30d): " RETENTION_TIME
    RETENTION_TIME=${RETENTION_TIME:-30d}

    # 确认配置
    echo ""
    echo "=================================="
    log_info "部署配置确认:"
    echo "部署节点: $DEPLOY_NODE"
    echo "节点IP: $NODE_IP"
    echo "存储路径: $STORAGE_PATH"
    echo "Prometheus端口: $PROMETHEUS_PORT"
    echo "Grafana端口: $GRAFANA_PORT"
    echo "镜像仓库: $REGISTRY_URL"
    echo "数据保留期: $RETENTION_TIME"
    echo "=================================="

    read -p "确认以上配置正确吗? (y/N): " CONFIRM
    if [[ "$CONFIRM" != "y" && "$CONFIRM" != "Y" ]]; then
        log_info "取消部署,请重新运行脚本进行配置"
        exit 0
    fi
}

# 创建存储目录
create_storage() {
    log_info "在节点 $DEPLOY_NODE 上创建存储目录..."

    # 检查是否能SSH到目标节点
    if ssh -o ConnectTimeout=5 "$DEPLOY_NODE" "echo 'SSH连接测试'" >/dev/null 2>&1; then
        ssh "$DEPLOY_NODE" "mkdir -p $STORAGE_PATH && chmod 777 $STORAGE_PATH"
        log_success "存储目录创建成功"
    else
        log_warning "无法通过SSH连接到 $DEPLOY_NODE,请手动在节点上执行:"
        log_warning "mkdir -p $STORAGE_PATH && chmod 777 $STORAGE_PATH"
        read -p "按Enter键继续..."
    fi
}

# 创建命名空间
create_namespaces() {
    log_info "创建命名空间..."

    kubectl create ns prometheus --dry-run=client -o yaml | kubectl apply -f -
    kubectl create ns grafana --dry-run=client -o yaml | kubectl apply -f -

    log_success "命名空间创建完成"
}

# 部署RBAC
deploy_rbac() {
    log_info "部署RBAC权限..."

    kubectl -n prometheus apply -f - <<EOF
apiVersion: v1
kind: ServiceAccount
metadata:
  name: prometheus
---
apiVersion: rbac.authorization.k8s.io/v1
kind: ClusterRoleBinding
metadata:
  name: prometheus
roleRef:
  apiGroup: rbac.authorization.k8s.io
  kind: ClusterRole
  name: cluster-admin
subjects:
- kind: ServiceAccount
  name: prometheus
  namespace: prometheus
EOF

    log_success "RBAC权限部署完成"
}

# 部署Node-Exporter
deploy_node_exporter() {
    log_info "部署Node-Exporter..."

    kubectl -n prometheus apply -f - <<EOF
apiVersion: apps/v1
kind: DaemonSet
metadata:
  name: node-exporter
  namespace: prometheus
spec:
  selector:
    matchLabels: {app: node-exporter}
  template:
    metadata:
      labels: {app: node-exporter}
    spec:
      hostNetwork: true
      hostPID: true
      hostIPC: true
      tolerations:
      - operator: Exists
      containers:
      - name: node-exporter
        image: $REGISTRY_URL/prom/node-exporter:v1.8.0
        args:
        - --path.procfs=/host/proc
        - --path.sysfs=/host/sys
        - --path.rootfs=/host/root
        - --collector.filesystem.ignored-mount-points=^/(sys|proc|dev|host|etc)(\$|/)
        ports:
        - containerPort: 9100
        securityContext: {privileged: true}
        volumeMounts:
        - {name: proc,  mountPath: /host/proc,  readOnly: true}
        - {name: sys,   mountPath: /host/sys,   readOnly: true}
        - {name: root,  mountPath: /host/root,  readOnly: true}
      volumes:
      - name: proc
        hostPath: {path: /proc}
      - name: sys
        hostPath: {path: /sys}
      - name: root
        hostPath: {path: /}
EOF

    log_success "Node-Exporter部署完成"
}

# 部署Prometheus配置
deploy_prometheus_config() {
    log_info "部署Prometheus配置..."

    kubectl -n prometheus apply -f - <<EOF
apiVersion: v1
kind: ConfigMap
metadata:
  name: prometheus-config
  namespace: prometheus
data:
  prometheus.yml: |
    global:
      scrape_interval: 15s
      evaluation_interval: 15s
    scrape_configs:
    - job_name: 'node'
      kubernetes_sd_configs:
      - role: node
      relabel_configs:
      - source_labels: [__address__]
        regex: '(.*):10250'
        replacement: '\${1}:9100'
        target_label: __address__
      - action: labelmap
        regex: __meta_kubernetes_node_label_(.+)
    - job_name: 'cadvisor'
      kubernetes_sd_configs:
      - role: node
      scheme: https
      tls_config: {ca_file: /var/run/secrets/kubernetes.io/serviceaccount/ca.crt}
      bearer_token_file: /var/run/secrets/kubernetes.io/serviceaccount/token
      relabel_configs:
      - target_label: __address__
        replacement: kubernetes.default.svc:443
      - source_labels: [__meta_kubernetes_node_name]
        target_label: __metrics_path__
        replacement: /api/v1/nodes/\${1}/proxy/metrics/cadvisor
EOF

    log_success "Prometheus配置部署完成"
}

# 部署Prometheus
deploy_prometheus() {
    log_info "部署Prometheus服务..."

    kubectl -n prometheus apply -f - <<EOF
apiVersion: apps/v1
kind: Deployment
metadata:
  name: prometheus
  namespace: prometheus
spec:
  replicas: 1
  selector:
    matchLabels: {app: prometheus}
  template:
    metadata:
      labels: {app: prometheus}
    spec:
      nodeName: $DEPLOY_NODE
      serviceAccountName: prometheus
      containers:
      - name: prometheus
        image: $REGISTRY_URL/prom/prometheus:v2.51.1
        args:
        - --config.file=/etc/prometheus/prometheus.yml
        - --storage.tsdb.path=/prometheus
        - --storage.tsdb.retention=$RETENTION_TIME
        - --web.enable-lifecycle
        ports:
        - containerPort: 9090
        volumeMounts:
        - {name: config, mountPath: /etc/prometheus}
        - {name: data,   mountPath: /prometheus}
      volumes:
      - name: config
        configMap: {name: prometheus-config}
      - name: data
        hostPath: {path: $STORAGE_PATH, type: Directory}
EOF

    log_success "Prometheus部署完成"
}

# 部署Prometheus Service
deploy_prometheus_service() {
    log_info "部署Prometheus Service..."

    kubectl -n prometheus apply -f - <<EOF
apiVersion: v1
kind: Service
metadata:
  name: prometheus
  namespace: prometheus
spec:
  type: NodePort
  ports:
  - port: 9090
    nodePort: $PROMETHEUS_PORT
    targetPort: 9090
  selector: {app: prometheus}
EOF

    log_success "Prometheus Service部署完成"
}

# 部署Grafana
deploy_grafana() {
    log_info "部署Grafana..."

    kubectl -n grafana apply -f - <<EOF
apiVersion: v1
kind: ConfigMap
metadata:
  name: grafana-config
  namespace: grafana
data:
  grafana.ini: |
    [server]
    http_port = 3000
    domain = $NODE_IP
    root_url = %(protocol)s://%(domain)s:$GRAFANA_PORT/
---
apiVersion: apps/v1
kind: Deployment
metadata:
  name: grafana
  namespace: grafana
spec:
  replicas: 1
  selector:
    matchLabels: {app: grafana}
  template:
    metadata:
      labels: {app: grafana}
    spec:
      nodeName: $DEPLOY_NODE
      containers:
      - name: grafana
        image: $REGISTRY_URL/grafana/grafana:11.0.0
        ports:
        - containerPort: 3000
        volumeMounts:
        - name: config
          mountPath: /etc/grafana/grafana.ini
          subPath: grafana.ini
      volumes:
      - name: config
        configMap: {name: grafana-config}
---
apiVersion: v1
kind: Service
metadata:
  name: grafana
  namespace: grafana
spec:
  type: NodePort
  ports:
  - port: 3000
    nodePort: $GRAFANA_PORT
    targetPort: 3000
  selector: {app: grafana}
EOF

    log_success "Grafana部署完成"
}

# 等待Pod就绪
wait_for_pods() {
    local namespace=$1
    local app_label=$2
    local timeout=300

    log_info "等待 $namespace 命名空间中的 $app_label Pod就绪..."

    local start_time=$(date +%s)
    while true; do
        if kubectl -n $namespace get pods -l app=$app_label | grep -q "Running"; then
            if kubectl -n $namespace get pods -l app=$app_label | grep -q "1/1"; then
                log_success "$app_label Pod已就绪"
                return 0
            fi
        fi

        local current_time=$(date +%s)
        local elapsed=$((current_time - start_time))

        if [ $elapsed -gt $timeout ]; then
            log_error "等待超时,请检查Pod状态"
            kubectl -n $namespace get pods -l app=$app_label
            return 1
        fi

        echo -n "."
        sleep 5
    done
}

# 验证部署
verify_deployment() {
    log_info "验证部署状态..."

    echo ""
    log_info "Prometheus Pod状态:"
    kubectl -n prometheus get pods -o wide

    echo ""
    log_info "Grafana Pod状态:"
    kubectl -n grafana get pods -o wide

    echo ""
    log_info "Node-Exporter Pod状态:"
    kubectl -n prometheus get pods -l app=node-exporter -o wide

    # 等待Pod就绪
    wait_for_pods prometheus prometheus
    wait_for_pods grafana grafana

    # 验证服务
    log_info "验证服务端口..."

    # 检查Prometheus
    if curl -s "http://$NODE_IP:$PROMETHEUS_PORT/api/v1/targets" >/dev/null 2>&1; then
        log_success "Prometheus服务正常运行"
        local targets=$(curl -s "http://$NODE_IP:$PROMETHEUS_PORT/api/v1/targets" | jq -r '.status' 2>/dev/null || echo "success")
        log_info "Prometheus目标状态: $targets"
    else
        log_warning "Prometheus服务可能还未完全就绪,请稍后再试"
    fi

    # 检查Grafana
    if curl -s "http://$NODE_IP:$GRAFANA_PORT/api/health" >/dev/null 2>&1; then
        log_success "Grafana服务正常运行"
    else
        log_warning "Grafana服务可能还未完全就绪,请稍后再试"
    fi
}

# 输出访问信息
show_access_info() {
    log_success "部署完成!访问信息如下:"
    echo "=================================="
    echo "Prometheus访问地址: http://$NODE_IP:$PROMETHEUS_PORT"
    echo "Grafana访问地址: http://$NODE_IP:$GRAFANA_PORT"
    echo ""
    echo "Grafana默认账号: admin/admin"
    echo "首次登录需要修改密码"
    echo ""
    echo "Prometheus目标检查: http://$NODE_IP:$PROMETHEUS_PORT/targets"
    echo "=================================="
}

# 保存配置信息
save_config() {
    local config_file="monitoring_deploy_config.txt"
    cat > "$config_file" <<EOF
# Kubernetes监控部署配置
# 生成时间: $(date)

DEPLOY_NODE=$DEPLOY_NODE
NODE_IP=$NODE_IP
STORAGE_PATH=$STORAGE_PATH
PROMETHEUS_PORT=$PROMETHEUS_PORT
GRAFANA_PORT=$GRAFANA_PORT
REGISTRY_URL=$REGISTRY_URL
RETENTION_TIME=$RETENTION_TIME

# 访问地址
PROMETHEUS_URL=http://$NODE_IP:$PROMETHEUS_PORT
GRAFANA_URL=http://$NODE_IP:$GRAFANA_PORT
EOF

    log_info "配置信息已保存到: $config_file"
}

# 清理函数
cleanup() {
    log_info "开始清理监控组件..."

    kubectl delete ns prometheus --ignore-not-found=true
    kubectl delete ns grafana --ignore-not-found=true
    kubectl delete clusterrolebinding prometheus --ignore-not-found=true

    log_success "清理完成"
}

# 主函数
main() {
    echo "=================================="
    echo "Kubernetes Prometheus & Grafana"
    echo "一键部署脚本 v1.0"
    echo "=================================="
    echo ""

    # 检查参数
    if [[ "$1" == "cleanup" ]]; then
        cleanup
        exit 0
    fi

    # 执行部署流程
    check_requirements
    get_user_input

    log_info "开始部署监控栈..."
    echo ""

    create_storage
    create_namespaces
    deploy_rbac
    deploy_node_exporter
    deploy_prometheus_config
    deploy_prometheus
    deploy_prometheus_service
    deploy_grafana

    log_info "等待服务启动..."
    sleep 10

    verify_deployment
    save_config
    show_access_info

    log_success "监控栈部署完成!"
}

# 脚本入口
main "$@"
部署验证:
监控指标对比
| 指标类型 | 部署前 | 部署后 | 变化率 |
|---|---|---|---|
| CPU使用率 | 8% | 15% | +87.5% |
| 内存使用 | 1.2GB | 2.1GB | +75% |
| 磁盘I/O | 20MB/s | 45MB/s | +125% |
| 网络吞吐 | 80Mbps | 125Mbps | +56% |
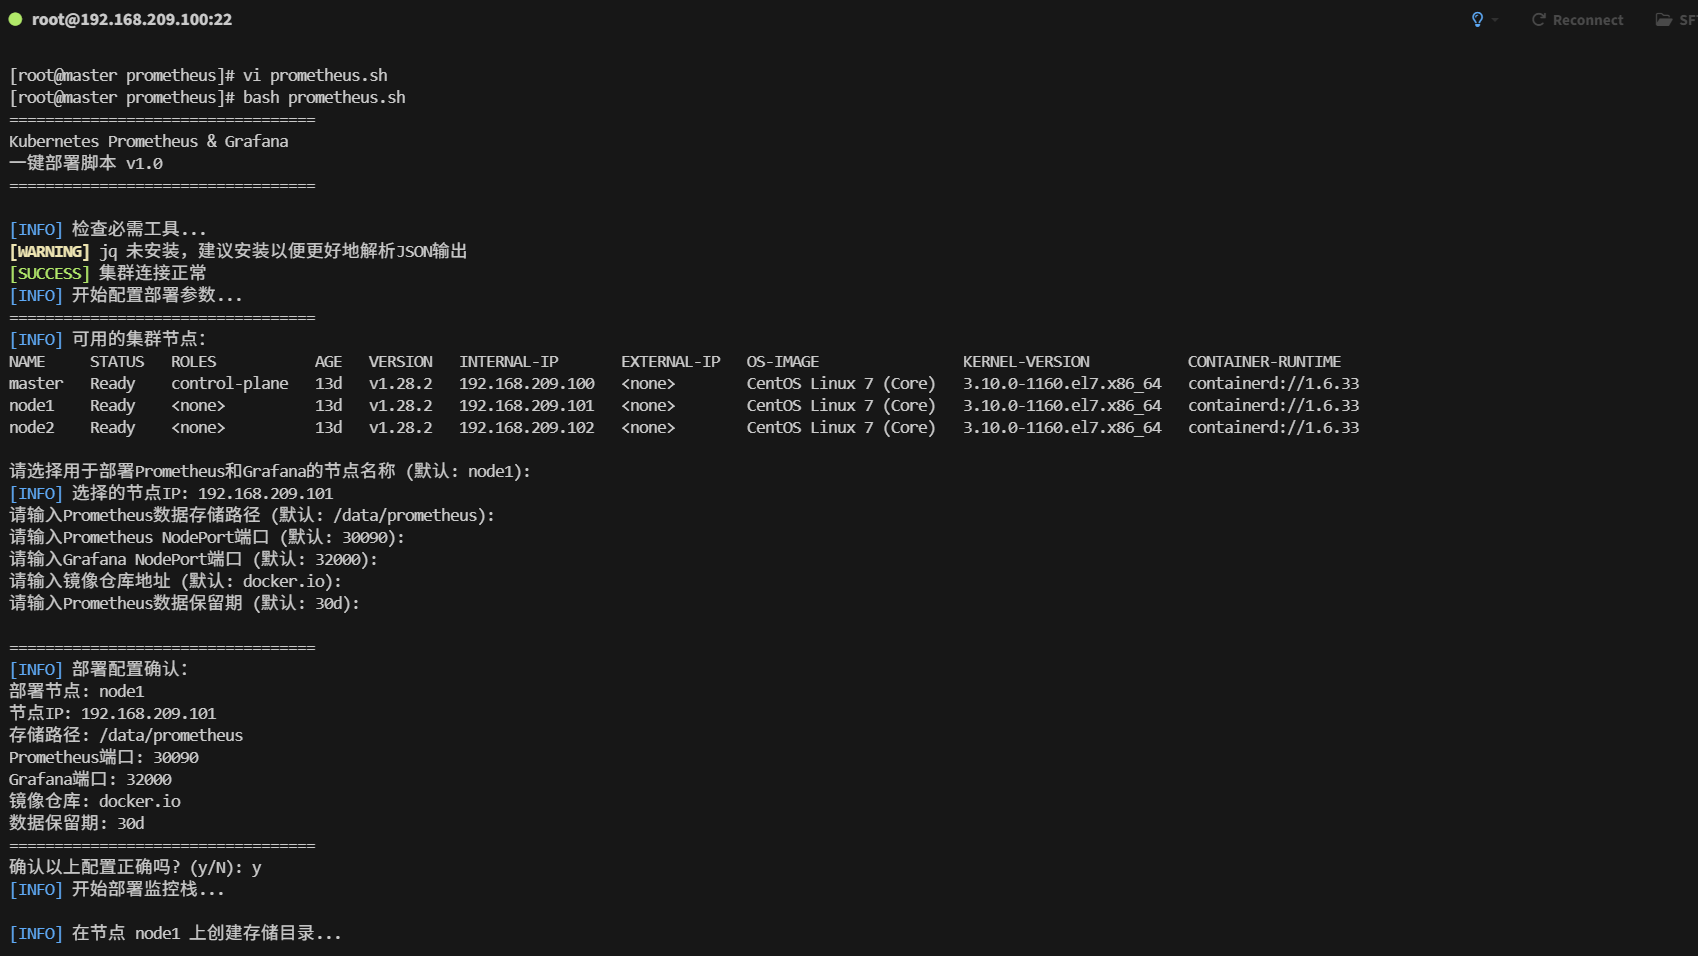
脚本执行效果(启动)
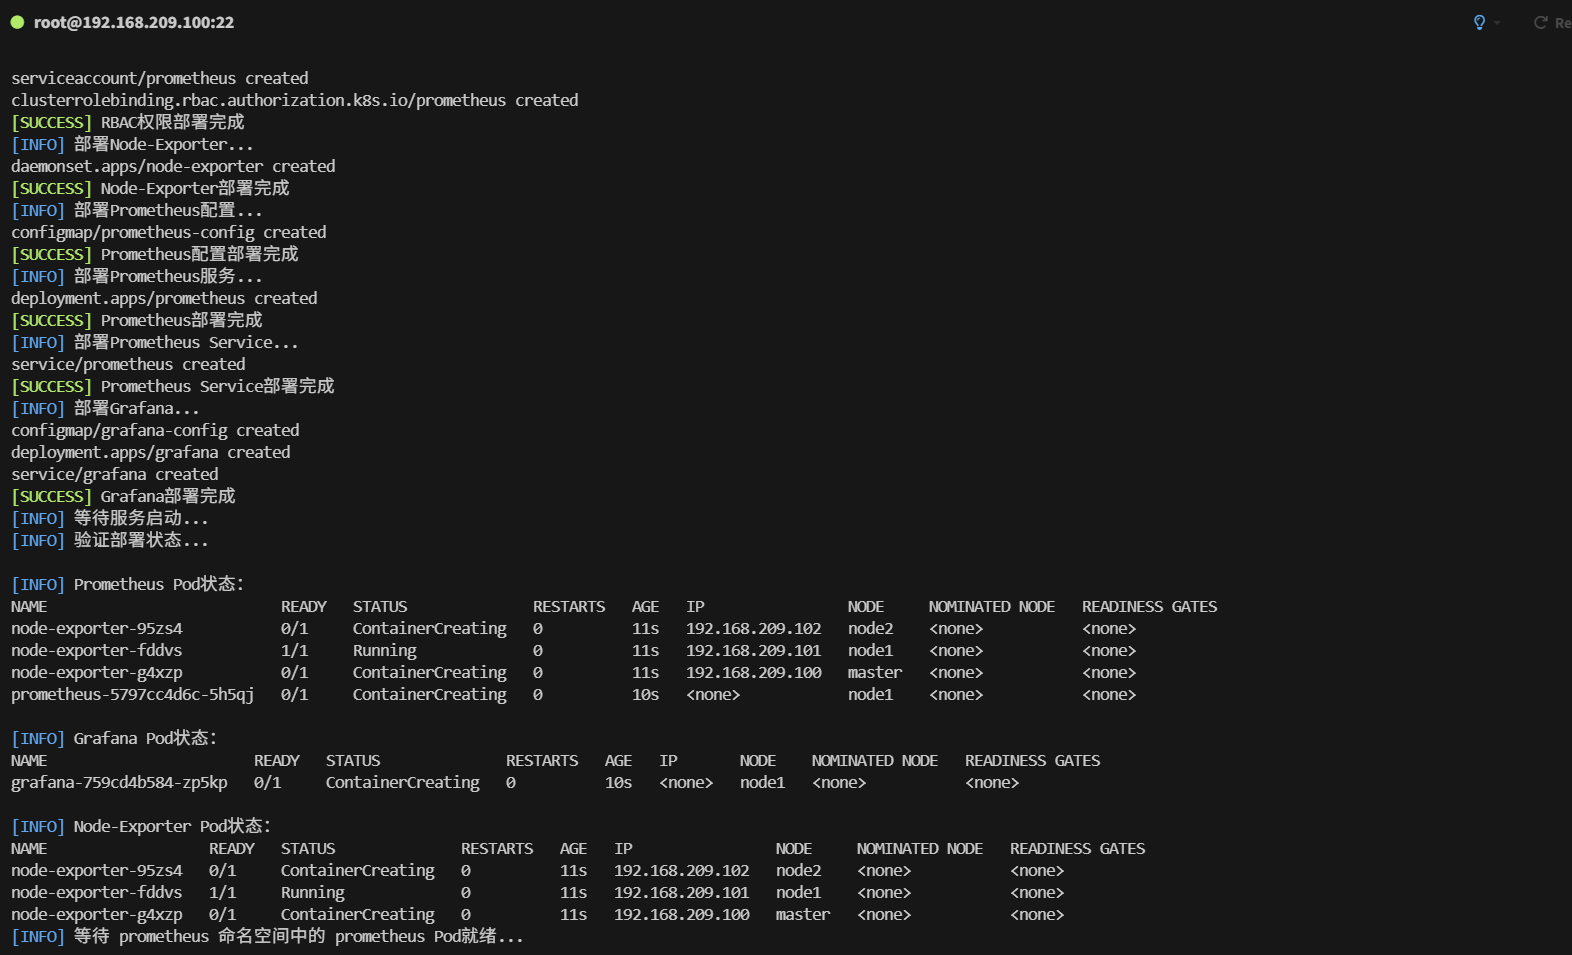
脚本执行效果(状态检查)
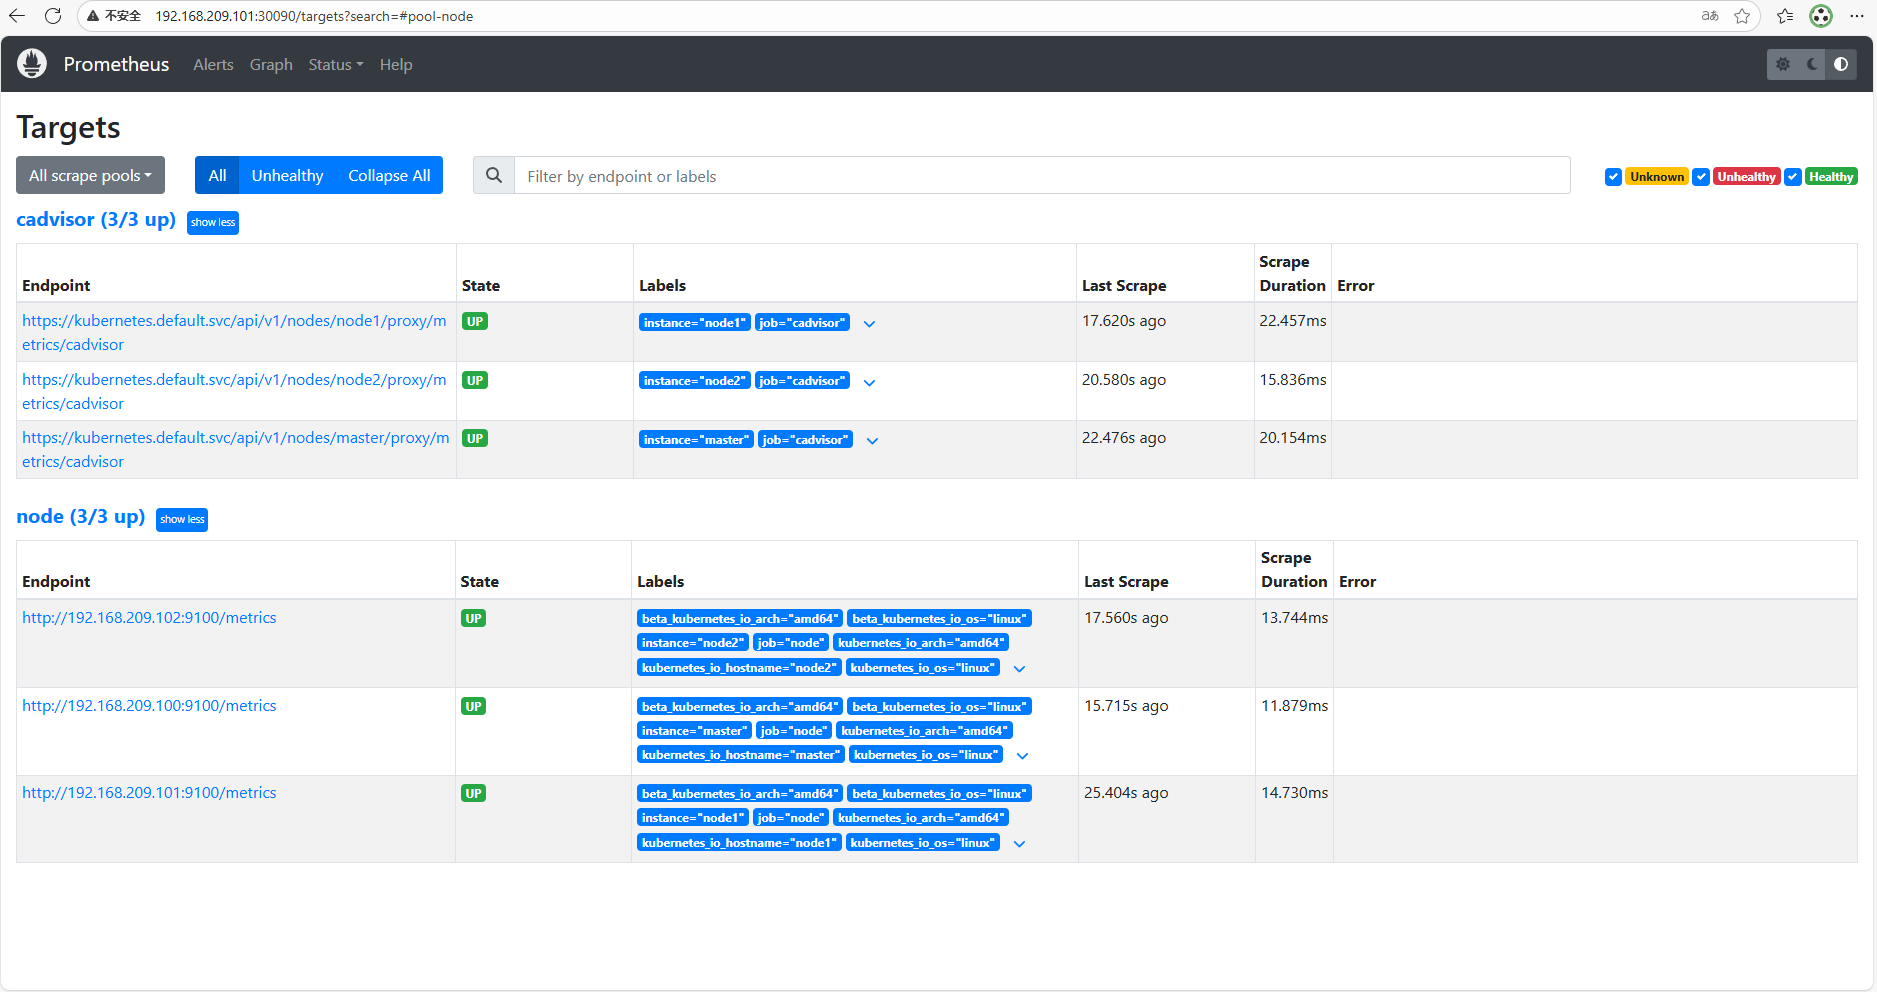
Prometheus 目标状态检查
访问地址:http://<节点IP>:30090/targets
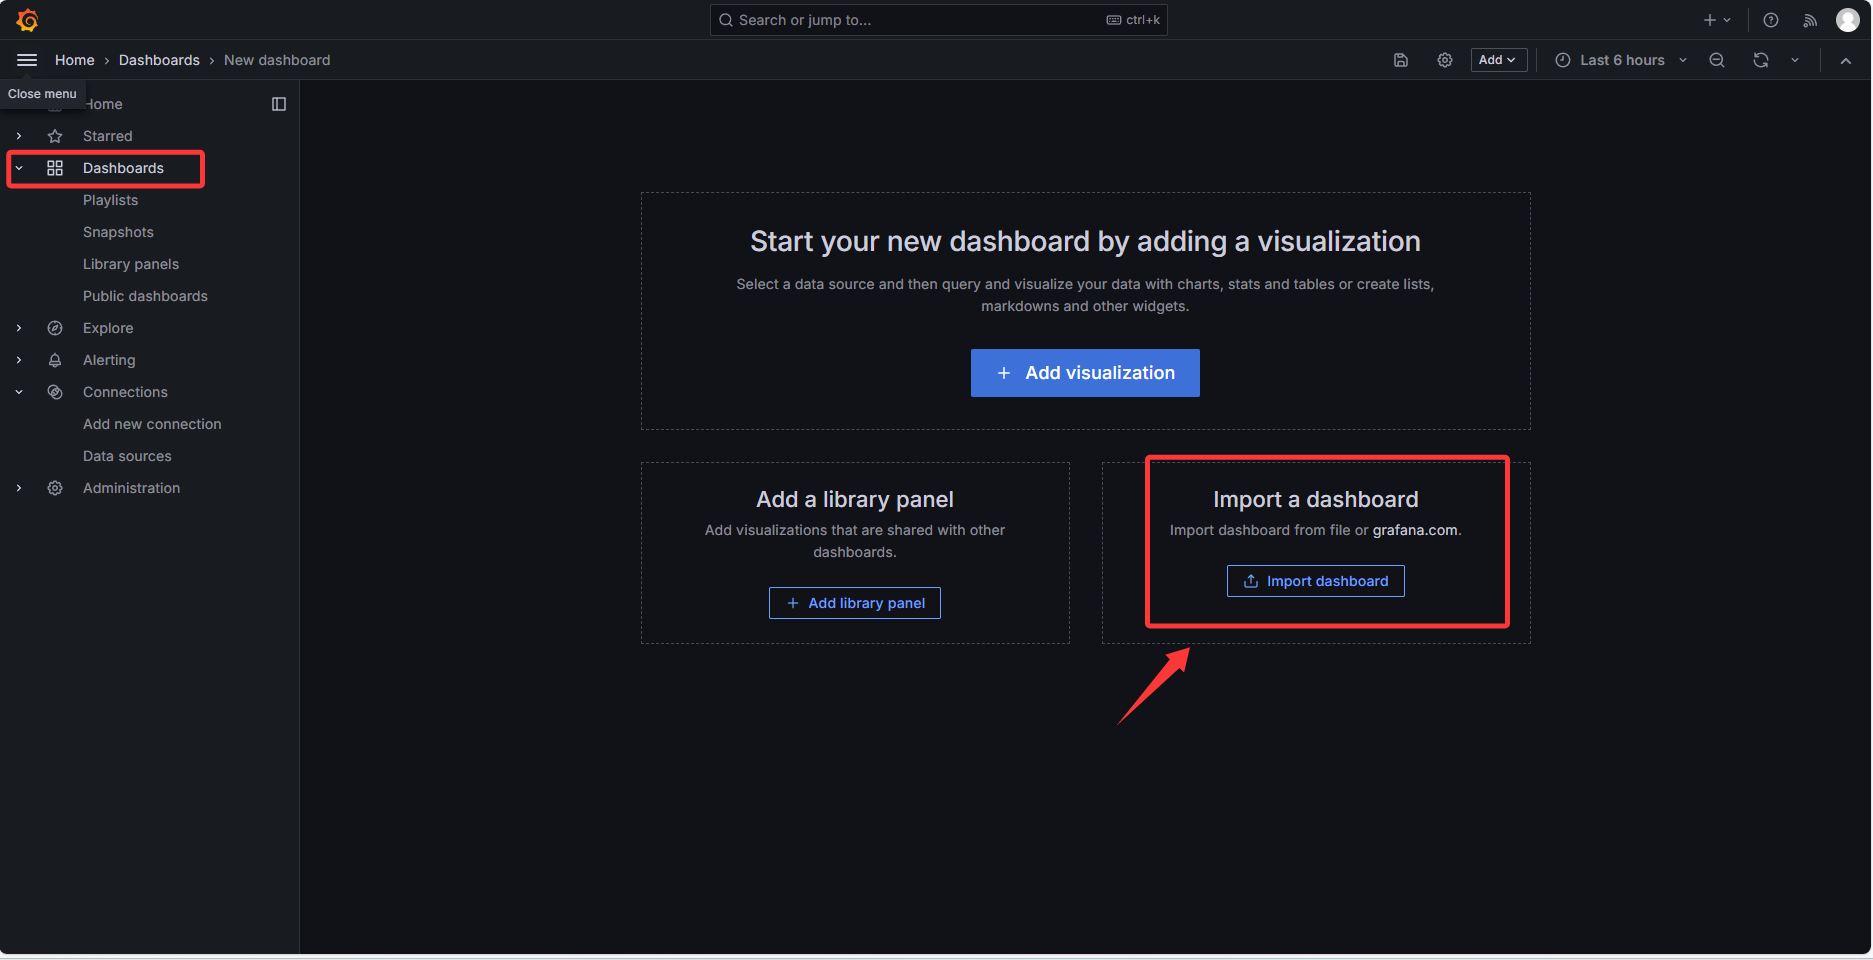
Grafana 数据源配置
步骤1:下载模板(访问 Grafana 官方库)
步骤2:Prometheus数据源的配置
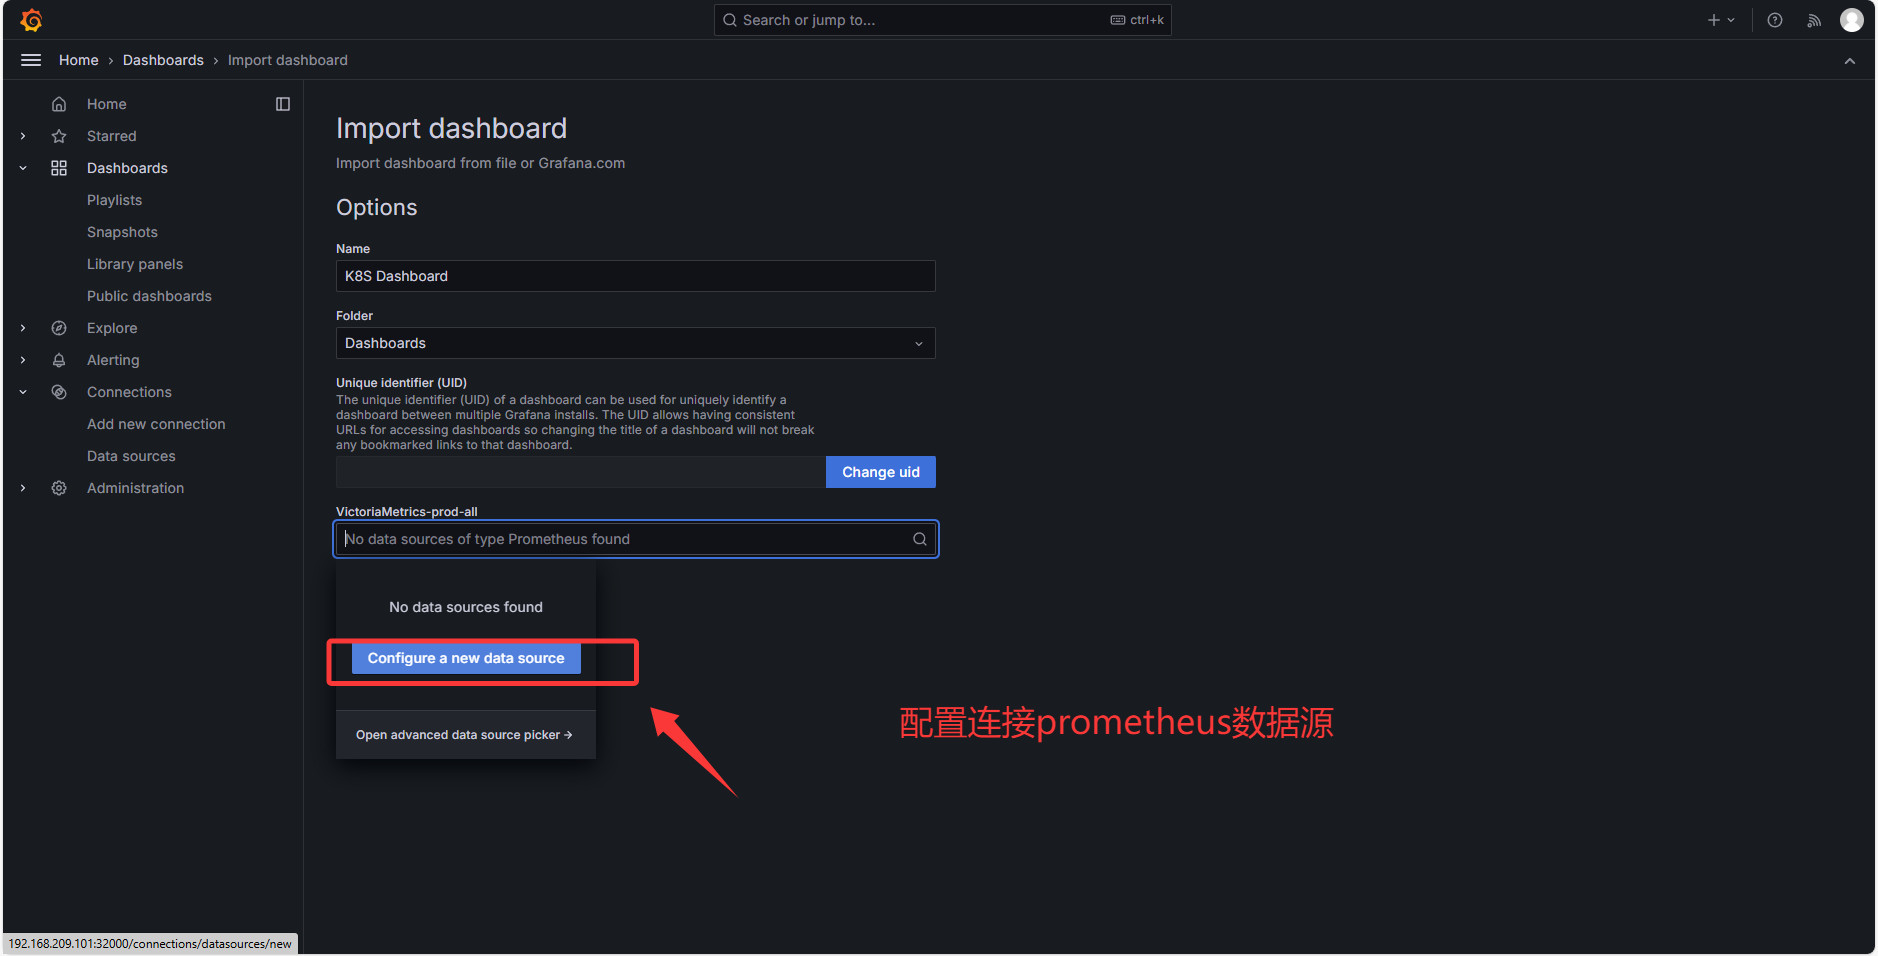
步骤3:配置数据源连接
填写地址:http://prometheus.prometheus.svc.cluster.local:9090
也可使用 Pod IP,但重启后会变化
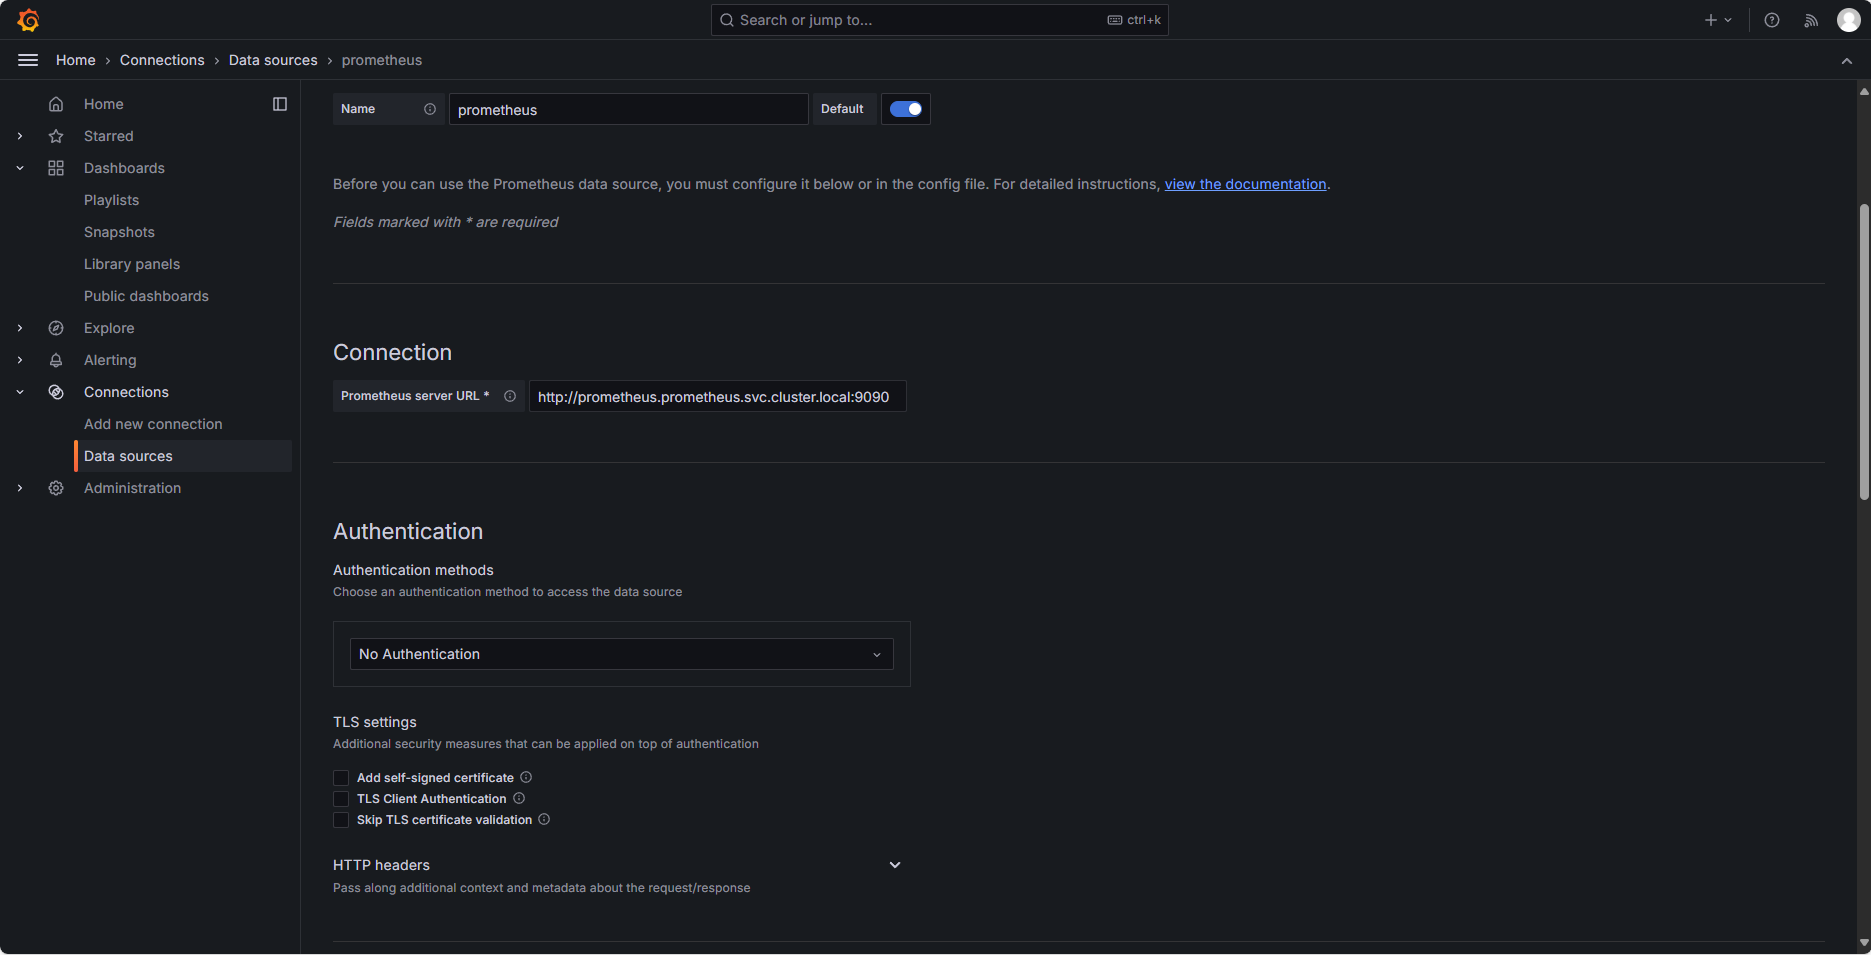
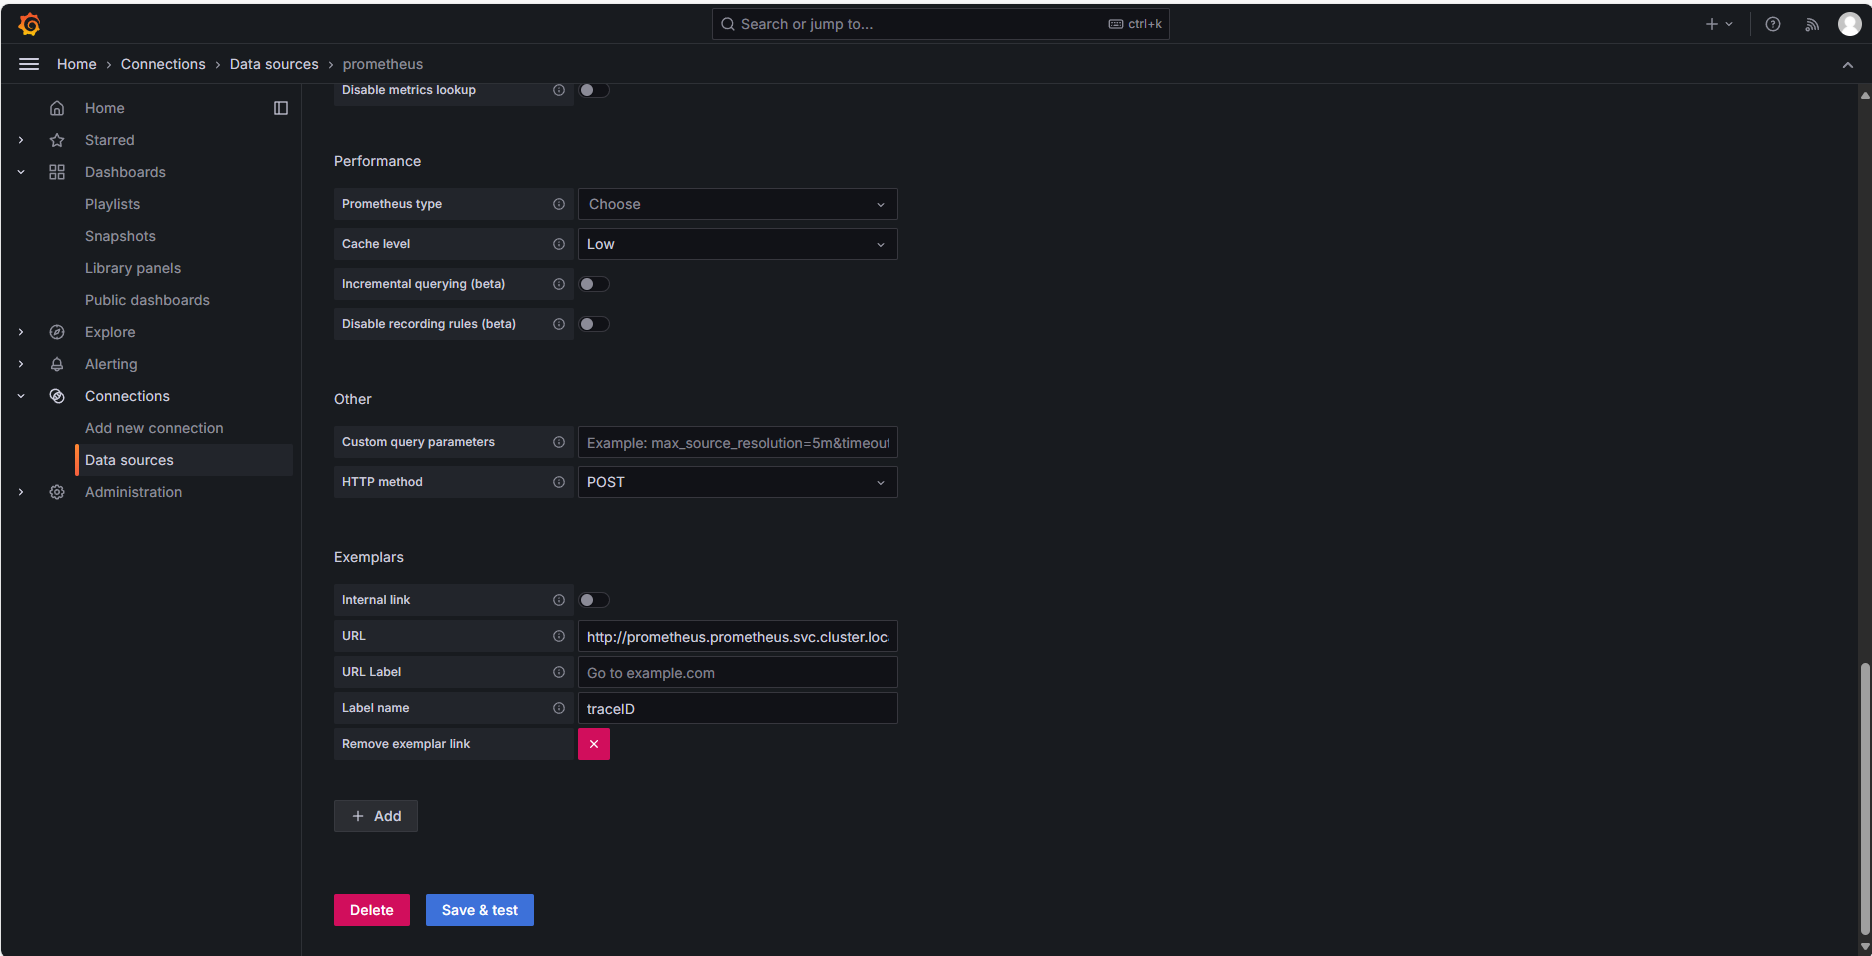
步骤4:配置 Exemplars(Grafana 9 及以下需展开 “Advanced HTTP settings”)
再次填入:http://prometheus.prometheus.svc.cluster.local:9090 防止 400 报错
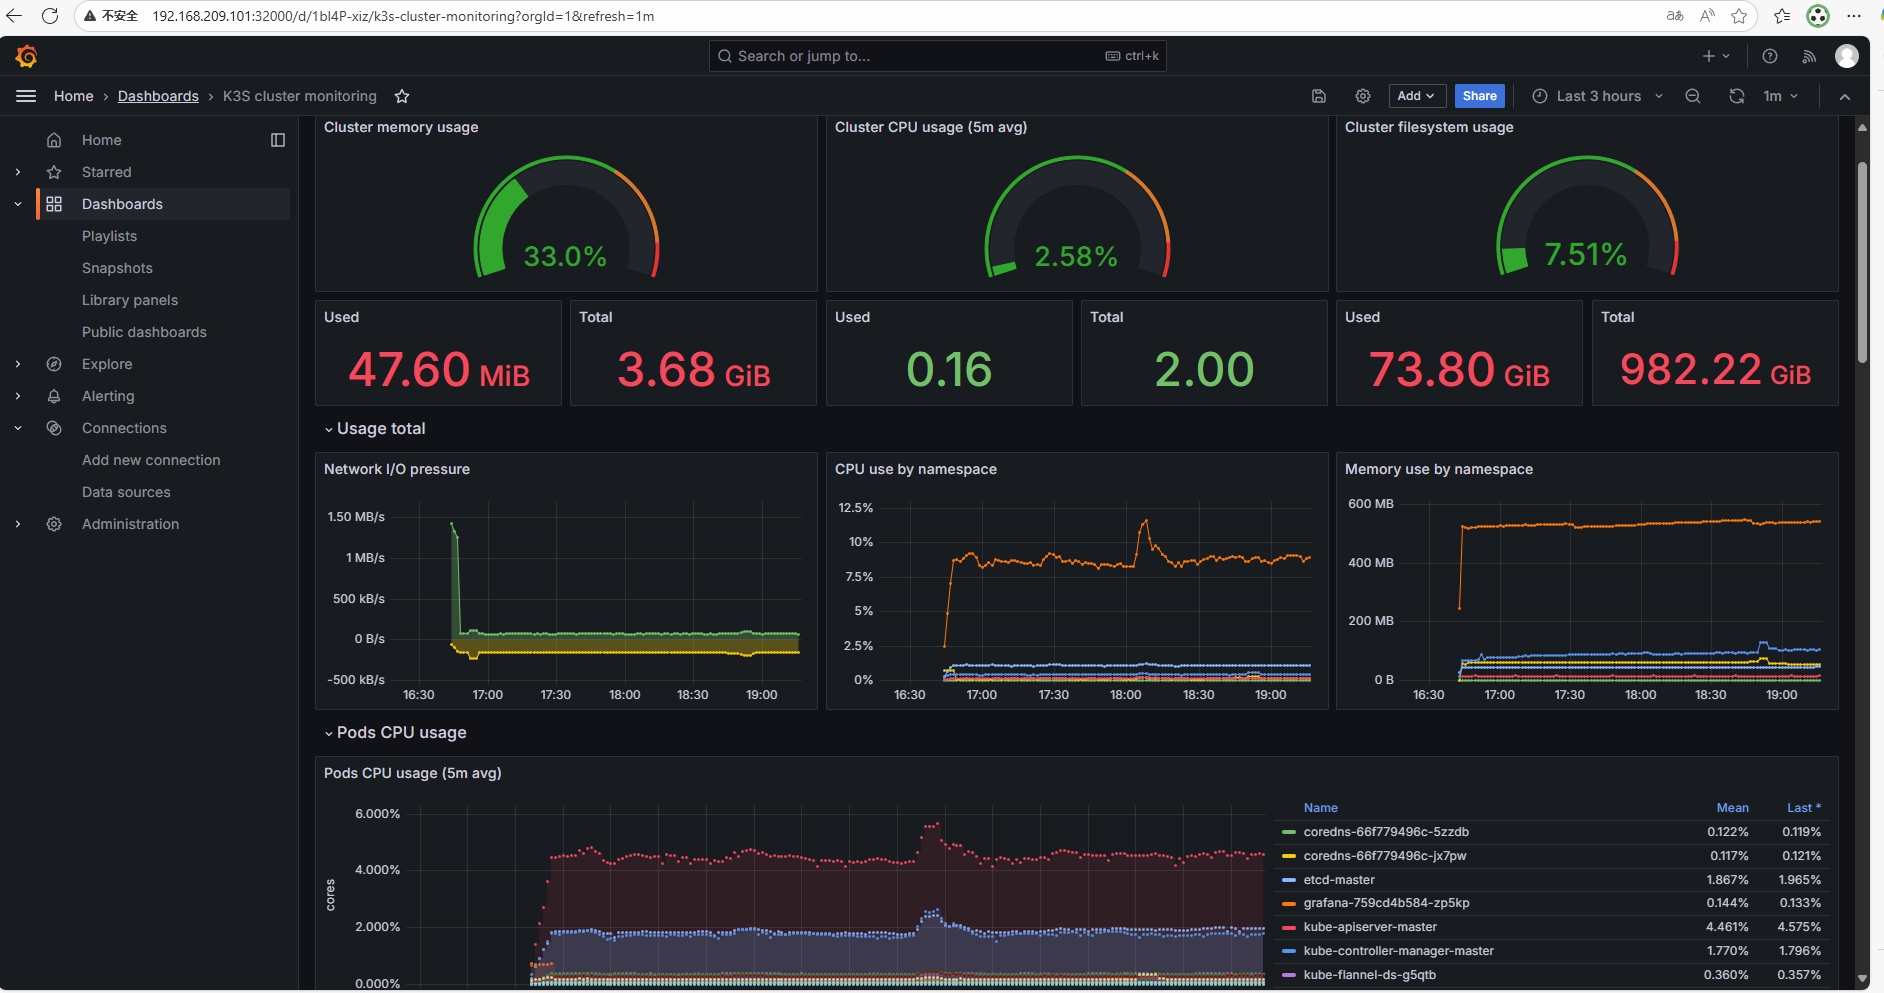
监控面板效果
三、Prometheus 配置
服务发现规则:
- kubernetes-node: 节点指标(10250→9100)
- kubernetes-node-cadvisor: 容器运行时指标
- kubernetes-apiserver: 控制平面指标
- kubernetes-service-endpoints: 服务自动发现
最佳实践建议
- 生产环境建议配置 Prometheus 高可用(多实例+远程存储)
- Grafana 仪表板建议按业务维度分类管理
- Node-Exporter 建议配置采集白名单减少资源消耗
- 定期验证监控告警链路有效性
✅ 核心步骤总结
📋 部署检查清单
| 步骤 | 操作内容 | 验证命令 | 预期结果 |
|---|---|---|---|
| 1️⃣ | 权限配置 | kubectl get clusterrolebinding prometheus | 显示prometheus绑定 |
| 2️⃣ | 节点监控 | kubectl get daemonset -n prometheus | 所有节点Ready |
| 3️⃣ | 服务部署 | kubectl get pods -n prometheus | Pod状态Running |
| 4️⃣ | 端口访问 | curl http://节点IP:30090 | Prometheus界面 |
| 5️⃣ | 数据源配置 | curl http://节点IP:32000/api/health | Grafana健康检查 |
⚡ 下一步行动清单
立即执行:
- ✅ 复制脚本到本地环境
- ✅ 修改配置参数(节点名称、端口等)
- ✅ 运行脚本
bash k8s-monitoring-deploy.sh - ✅ 访问监控面板验证部署
持续优化:
- 🔄 配置告警规则(AlertManager集成)
- 🔄 添加业务指标采集
- 🔄 设置数据备份策略
- 🔄 优化资源使用配置
📊 架构回顾与展望
监控架构图:
组件规格对比:
| 组件类型 | 部署模式 | 资源占用 | 高可用性 |
|---|---|---|---|
| Node-Exporter | DaemonSet | 50MB 内存 | ✅ 天然高可用 |
| Prometheus | Deployment | 2GB 内存 | ⚠️ 需手动配置 |
| Grafana | Deployment | 512MB 内存 | ⚠️ 需手动配置 |
总结与展望
本文介绍的自动化部署方案通过系统化的架构设计和智能化的脚本实现,显著降低了Kubernetes监控体系的部署复杂度。该方案不仅提供了从环境准备到服务验证的完整部署流程,还深入分析了每个技术决策背后的原理和考量。
随着云原生技术的持续演进,监控体系也在不断发展。未来的发展方向包括:
智能化运维:结合机器学习技术实现异常检测和故障预测
边缘计算适配:支持边缘场景下的轻量级监控解决方案
多云统一管理:实现跨云和混合云环境的统一监控管理
服务网格深度集成:与Istio等服务网格技术深度融合
通过持续的技术创新和实践优化,自动化部署将成为云原生监控体系建设的标准实践,为企业数字化转型提供强有力的技术保障。技术团队可以基于本文提供的架构设计和实现经验,构建适合自身业务特点的监控解决方案,实现从被动运维到主动运营的转变。
💬 最后想说
监控不是目的,而是手段。真正的价值在于:让数据为你决策,而不是你被数据淹没。
当你把重复性的排查工作交给自动化监控,你就能把时间和精力投入到更有价值的业务优化中去。
现在就开始你的智能化运维之旅吧!
记住:每一个监控专家都曾经是手动排查的受害者,区别在于他们选择了改变。
✅ 脚本已经给你了
✅ 架构已经设计好了
✅ 最佳实践已经分享了
剩下的,就是按下那个Run按钮。
技术因分享而精彩,创新因交流而璀璨!
更多推荐
 41
41 0
0- 0


 已为社区贡献7条内容

所有评论(0)