
Kubernetes集群管理实践(一):从基础操作到可视化部署
·
Kubernetes集群管理实践
客户端命令kubectl
基础命令
-
create:通过文件或标准输入创建资源
-
expose:将 RC、Service、Deployment、Pod 暴露为新的 Service
-
run:在集群中运行指定镜像
-
set:为对象设置特定属性
-
explain:查看资源的文档说明
-
get:显示一个或多个资源
-
edit:使用默认编辑器编辑资源
-
delete:根据文件、标准输入、资源名或 label 删除资源
#delete使用
[root@master ~]# kubectl get pods -n kube-system
NAME                                       READY   STATUS                            RESTARTS       AGE
calico-kube-controllers-658d97c59c-tk2pk   1/1     Running                           3 (135m ago)   28h
calico-node-57rqw                          1/1     Running                           3 (135m ago)   28h
calico-node-fmdcl                          1/1     Init:CreateContainerConfigError   3 (135m ago)   28h
calico-node-npfm5                          1/1     Running                           3 (135m ago)   28h
coredns-66f779496c-26pcb                   1/1     Running                           3 (135m ago)   29h
coredns-66f779496c-wpc57                   1/1     Running                           3 (135m ago)   29h
etcd-master                                1/1     Running                           3 (135m ago)   29h
kube-apiserver-master                      1/1     Running                           3 (135m ago)   29h
kube-controller-manager-master             1/1     Running                           3 (135m ago)   29h
kube-proxy-cd8gk                           1/1     Running                           3 (135m ago)   28h
kube-proxy-q8prd                           1/1     Running                           3 (135m ago)   29h
kube-proxy-xtfxw                           1/1     Running                           3 (135m ago)   28h
kube-scheduler-master                      1/1     Running                           3 (135m ago)   29h
metrics-server-57999c5cf7-bxjn7            1/1     Running                           3 (61s ago)    8h


#删除
[root@master ~]# kubectl delete pod metrics-server-57999c5cf7-bxjn7 -n kube-system
#强制删除
[root@master ~]# kubectl delete pod metrics-server-57999c5cf7-bxjn7 -n kube-system --grace-period=0 --force
创建metrics-server资源
可以查看资源(CPU、内存、存储)使用情况
[root@master ~]# wget https://github.com/kubernetes-sigs/metrics-server/releases/latest/download/components.yaml -O metrics-server-components.yaml


[root@master ~]# ls
anaconda-ks.cfg                     Desktop               kubeadm-init.log                Pictures
calico.yaml                         Documents             kubeadm-init.yaml               Public
components.yaml                     Downloads             metrics-server-components.yaml  Templates
cri-dockerd-0.3.4-3.el7.x86_64.rpm  initial-setup-ks.cfg  Music                           Videos


[root@master ~]# sed -i 's/registry.k8s.io\/metrics-server/registry.cn-hangzhou.aliyuncs.com\/google_containers/g' metrics-server-components.yaml


[root@master ~]# vim metrics-server-components.yaml
#添加,在“- --secure-port=10250”后面添加
- --kubelet-insecure-tls

#应用配置文件
[root@master ~]# kubectl apply -f metrics-server-components.yaml
serviceaccount/metrics-server created
clusterrole.rbac.authorization.k8s.io/system:aggregated-metrics-reader created
clusterrole.rbac.authorization.k8s.io/system:metrics-server created
rolebinding.rbac.authorization.k8s.io/metrics-server-auth-reader created
clusterrolebinding.rbac.authorization.k8s.io/metrics-server:system:auth-delegator created
clusterrolebinding.rbac.authorization.k8s.io/system:metrics-server created
service/metrics-server created
deployment.apps/metrics-server created
apiservice.apiregistration.k8s.io/v1beta1.metrics.k8s.io created


#获取资源列表
[root@master ~]# kubectl get pods -n kube-system
NAME                                       READY   STATUS    RESTARTS      AGE
calico-kube-controllers-658d97c59c-tk2pk   1/1     Running   1 (16h ago)   20h
calico-node-57rqw                          1/1     Running   1 (16h ago)   20h
calico-node-fmdcl                          1/1     Running   1 (16h ago)   20h
calico-node-npfm5                          1/1     Running   1 (16h ago)   20h
coredns-66f779496c-26pcb                   1/1     Running   1 (16h ago)   21h
coredns-66f779496c-wpc57                   1/1     Running   1 (16h ago)   21h
etcd-master                                1/1     Running   1 (16h ago)   21h
kube-apiserver-master                      1/1     Running   1 (16h ago)   21h
kube-controller-manager-master             1/1     Running   1 (16h ago)   21h
kube-proxy-cd8gk                           1/1     Running   1 (16h ago)   20h
kube-proxy-q8prd                           1/1     Running   1 (16h ago)   21h
kube-proxy-xtfxw                           1/1     Running   1 (16h ago)   20h
kube-scheduler-master                      1/1     Running   1 (16h ago)   21h
metrics-server-57999c5cf7-bxjn7            1/1     Running   0             100s


[root@master ~]# kubectl top node
NAME     CPU(cores)   CPU%   MEMORY(bytes)   MEMORY%
master   226m         5%     1148Mi          31%
node1    112m         2%     767Mi           20%
node2    111m         2%     716Mi           19%
#k8s插件:metrics-server
部署命令
-
rollout:管理资源的版本发布
-
scale:调整 Deployment / RS / RC 的副本数量
-
autoscale:为 Deployment / RS / StatefulSet / RC 配置自动扩缩容
集群管理命令
-
certificate:管理证书
-
cluster-info:显示集群信息
-
top:查看 CPU / 内存使用情况
-
cordon:将节点标记为不可调度
-
uncordon:将节点标记为可调度
-
drain:驱逐节点上的 Pod,为维护做准备
-
taint:为节点设置或更新污点
#显示集群信息
[root@master ~]# kubectl cluster-info
Kubernetes control plane is running at https://192.168.100.72:6443
CoreDNS is running at https://192.168.100.72:6443/api/v1/namespaces/kube-system/services/kube-dns:dns/proxy

To further debug and diagnose cluster problems, use 'kubectl cluster-info dump'.


#获取命名空间列表
[root@master ~]# kubectl get namespaces
NAME              STATUS   AGE
default           Active   23h
kube-node-lease   Active   23h
kube-public       Active   23h
kube-system       Active   23h


#查看Pod资源使用情况
[root@master ~]# kubectl  top pods -n kube-system
NAME                                       CPU(cores)   MEMORY(bytes)
calico-kube-controllers-658d97c59c-tk2pk   3m           73Mi
calico-node-57rqw                          44m          206Mi
calico-node-fmdcl                          34m          197Mi
calico-node-npfm5                          46m          220Mi
coredns-66f779496c-26pcb                   2m           18Mi
coredns-66f779496c-wpc57                   2m           68Mi
etcd-master                                28m          107Mi
kube-apiserver-master                      55m          341Mi
kube-controller-manager-master             20m          152Mi
kube-proxy-cd8gk                           7m           80Mi
kube-proxy-q8prd                           11m          82Mi
kube-proxy-xtfxw                           12m          81Mi
kube-scheduler-master                      4m           74Mi
metrics-server-57999c5cf7-bxjn7            4m           88Mi
故障诊断和调试命令
- describe:查看资源的详细信息
- logs:查看 Pod 中容器的日志
- attach:附着到一个运行中的容器
- exec:在容器中执行命令
- port-forward:将本地端口转发到 Pod
- proxy:运行到 kube-apiserver 的本地代理
- cp:在容器与本地之间复制文件
- auth:查看授权信息
describe
[root@master ~]# kubectl describe pod metrics-server-57999c5cf7-bxjn7 -n kube-system
Name:                 metrics-server-57999c5cf7-bxjn7
Namespace:            kube-system
Priority:             2000000000
Priority Class Name:  system-cluster-critical
Service Account:      metrics-server
Node:                 node2/192.168.100.71
Start Time:           Fri, 14 Nov 2025 11:19:05 +0800
Labels:               k8s-app=metrics-server
                      pod-template-hash=57999c5cf7
Annotations:          cni.projectcalico.org/containerID: bd4300212723afbf3d91128682fffb9eb727fa6875c68348980ad70dc699b552
                      cni.projectcalico.org/podIP: 10.244.104.6/32
                      cni.projectcalico.org/podIPs: 10.244.104.6/32
Status:               Running
IP:                   10.244.104.6
IPs:
  IP:           10.244.104.6
Controlled By:  ReplicaSet/metrics-server-57999c5cf7
Containers:
  metrics-server:
    Container ID:    docker://3ea1cf5ab1eb43bf48957e68e211c7ef21ef6a2833739f52bd8fd47ef4f2f834
    Image:           registry.cn-hangzhou.aliyuncs.com/google_containers/metrics-server:v0.8.0
    Image ID:        docker-pullable://registry.cn-hangzhou.aliyuncs.com/google_containers/metrics-server@sha256:421ca80cdee35ba18b1319e0e7d2d677a5d5be111f8c9537dd4b03dc90792bf9
    Port:            10250/TCP
    Host Port:       0/TCP
    SeccompProfile:  RuntimeDefault
    Args:
      --cert-dir=/tmp
      --secure-port=10250
      --kubelet-insecure-tls
      --kubelet-preferred-address-types=InternalIP,ExternalIP,Hostname
      --kubelet-use-node-status-port
      --metric-resolution=15s
    State:          Running
      Started:      Fri, 14 Nov 2025 13:25:49 +0800
    Last State:     Terminated
      Reason:       Error
      Exit Code:    255
      Started:      Fri, 14 Nov 2025 11:19:16 +0800
      Finished:     Fri, 14 Nov 2025 13:24:32 +0800
    Ready:          True
    Restart Count:  1
    Requests:
      cpu:        100m
      memory:     200Mi
    Liveness:     http-get https://:https/livez delay=0s timeout=1s period=10s #success=1 #failure=3
    Readiness:    http-get https://:https/readyz delay=20s timeout=1s period=10s #success=1 #failure=3
    Environment:  <none>
    Mounts:
      /tmp from tmp-dir (rw)
      /var/run/secrets/kubernetes.io/serviceaccount from kube-api-access-jq5cj (ro)
Conditions:
  Type              Status
  Initialized       True
  Ready             True
  ContainersReady   True
  PodScheduled      True
Volumes:
  tmp-dir:
    Type:       EmptyDir (a temporary directory that shares a pod's lifetime)
    Medium:
    SizeLimit:  <unset>
  kube-api-access-jq5cj:
    Type:                    Projected (a volume that contains injected data from multiple sources)
    TokenExpirationSeconds:  3607
    ConfigMapName:           kube-root-ca.crt
    ConfigMapOptional:       <nil>
    DownwardAPI:             true
QoS Class:                   Burstable
Node-Selectors:              kubernetes.io/os=linux
Tolerations:                 node.kubernetes.io/not-ready:NoExecute op=Exists for 300s
                             node.kubernetes.io/unreachable:NoExecute op=Exists for 300s
Events:
  Type    Reason          Age   From               Message
  ----    ------          ----  ----               -------
  Normal  Scheduled       144m  default-scheduler  Successfully assigned kube-system/metrics-server-57999c5cf7-bxjn7 to node2
  Normal  Pulling         144m  kubelet            Pulling image "registry.cn-hangzhou.aliyuncs.com/google_containers/metrics-server:v0.8.0"
  Normal  Pulled          144m  kubelet            Successfully pulled image "registry.cn-hangzhou.aliyuncs.com/google_containers/metrics-server:v0.8.0" in 9.987s (9.987s including waiting)
  Normal  Created         144m  kubelet            Created container metrics-server
  Normal  Started         144m  kubelet            Started container metrics-server
  Normal  SandboxChanged  17m   kubelet            Pod sandbox changed, it will be killed and re-created.
  Normal  Pulled          17m   kubelet            Container image "registry.cn-hangzhou.aliyuncs.com/google_containers/metrics-server:v0.8.0" already present on machine
  Normal  Created         17m   kubelet            Created container metrics-server
  Normal  Started         17m   kubelet            Started container metrics-server
其他命令
查看创建资源对象类型和版本
#列出Kubernetes API资源清单
[root@master ~]# kubectl api-resources


#查看Deployment配置字段文档
#用explain查找yaml文件里面所需要的标签
[root@master ~]# kubectl explain deployment.spec
GROUP:      apps
KIND:       Deployment
VERSION:    v1

FIELD: spec <DeploymentSpec>

DESCRIPTION:
    Specification of the desired behavior of the Deployment.
    DeploymentSpec is the specification of the desired behavior of the
    Deployment.

FIELDS:
  minReadySeconds	<integer>
    Minimum number of seconds for which a newly created pod should be ready
    without any of its container crashing, for it to be considered available.
    Defaults to 0 (pod will be considered available as soon as it is ready)

  paused	<boolean>
    Indicates that the deployment is paused.

  progressDeadlineSeconds	<integer>
    The maximum time in seconds for a deployment to make progress before it is
    considered to be failed. The deployment controller will continue to process
    failed deployments and a condition with a ProgressDeadlineExceeded reason
    will be surfaced in the deployment status. Note that progress will not be
    estimated during the time a deployment is paused. Defaults to 600s.

  replicas	<integer>
    Number of desired pods. This is a pointer to distinguish between explicit
    zero and not specified. Defaults to 1.

  revisionHistoryLimit	<integer>
    The number of old ReplicaSets to retain to allow rollback. This is a pointer
    to distinguish between explicit zero and not specified. Defaults to 10.

  selector	<LabelSelector> -required-
    Label selector for pods. Existing ReplicaSets whose pods are selected by
    this will be the ones affected by this deployment. It must match the pod
    template's labels.

  strategy	<DeploymentStrategy>
    The deployment strategy to use to replace existing pods with new ones.

  template	<PodTemplateSpec> -required-
    Template describes the pods that will be created. The only allowed
    template.spec.restartPolicy value is "Always".


#获取命名空间列表
[root@master ~]# kubectl get ns
NAME              STATUS   AGE
default           Active   24h
kube-node-lease   Active   24h
kube-public       Active   24h
kube-system       Active   24h
集群Node管理
查看集群信息
[root@master ~]# kubectl cluster-info
Kubernetes control plane is running at https://192.168.100.72:6443
CoreDNS is running at https://192.168.100.72:6443/api/v1/namespaces/kube-system/services/kube-dns:dns/proxy

To further debug and diagnose cluster problems, use 'kubectl cluster-info dump'.
查看节点信息
#查看集群节点详细信息
[root@master ~]# kubectl get nodes -n default -o wide
NAME     STATUS   ROLES           AGE   VERSION   INTERNAL-IP      EXTERNAL-IP   OS-IMAGE                KERNEL-VERSION                 CONTAINER-RUNTIME
master   Ready    control-plane   24h   v1.28.0   192.168.100.72   <none>        CentOS Linux 7 (Core)   3.10.0-1160.119.1.el7.x86_64   docker://26.1.4
node1    Ready    <none>          24h   v1.28.0   192.168.100.70   <none>        CentOS Linux 7 (Core)   3.10.0-1160.119.1.el7.x86_64   docker://26.1.4
node2    Ready    <none>          24h   v1.28.0   192.168.100.71   <none>        CentOS Linux 7 (Core)   3.10.0-1160.119.1.el7.x86_64   docker://26.1.4


#查看节点描述详细信息
[root@master ~]# kubectl describe node master
Name:               master
Roles:              control-plane
Labels:             beta.kubernetes.io/arch=amd64
                    beta.kubernetes.io/os=linux
                    kubernetes.io/arch=amd64
                    kubernetes.io/hostname=master
                    kubernetes.io/os=linux
                    node-role.kubernetes.io/control-plane=
                    node.kubernetes.io/exclude-from-external-load-balancers=
Annotations:        kubeadm.alpha.kubernetes.io/cri-socket: unix:///var/run/cri-dockerd.sock
                    node.alpha.kubernetes.io/ttl: 0
                    projectcalico.org/IPv4Address: 192.168.100.72/24
                    projectcalico.org/IPv4IPIPTunnelAddr: 10.244.219.64
                    volumes.kubernetes.io/controller-managed-attach-detach: true
CreationTimestamp:  Thu, 13 Nov 2025 14:18:14 +0800
Taints:             node-role.kubernetes.io/control-plane:NoSchedule
Unschedulable:      false
Lease:
  HolderIdentity:  master
  AcquireTime:     <unset>
  RenewTime:       Fri, 14 Nov 2025 15:16:57 +0800
Conditions:
  Type                 Status  LastHeartbeatTime                 LastTransitionTime                Reason                       Message
  ----                 ------  -----------------                 ------------------                ------                       -------
  NetworkUnavailable   False   Fri, 14 Nov 2025 13:27:24 +0800   Fri, 14 Nov 2025 13:27:24 +0800   CalicoIsUp                   Calico is running on this node
  MemoryPressure       False   Fri, 14 Nov 2025 15:12:56 +0800   Thu, 13 Nov 2025 14:18:12 +0800   KubeletHasSufficientMemory   kubelet has sufficient memory available
  DiskPressure         False   Fri, 14 Nov 2025 15:12:56 +0800   Thu, 13 Nov 2025 14:18:12 +0800   KubeletHasNoDiskPressure     kubelet has no disk pressure
  PIDPressure          False   Fri, 14 Nov 2025 15:12:56 +0800   Thu, 13 Nov 2025 14:18:12 +0800   KubeletHasSufficientPID      kubelet has sufficient PID available
  Ready                True    Fri, 14 Nov 2025 15:12:56 +0800   Thu, 13 Nov 2025 15:14:13 +0800   KubeletReady                 kubelet is posting ready status
Addresses:
  InternalIP:  192.168.100.72
  Hostname:    master
Capacity:
  cpu:                4
  ephemeral-storage:  51175Mi
  hugepages-1Gi:      0
  hugepages-2Mi:      0
  memory:             3861072Ki
  pods:               110
Allocatable:
  cpu:                4
  ephemeral-storage:  48294789041
  hugepages-1Gi:      0
  hugepages-2Mi:      0
  memory:             3758672Ki
  pods:               110
System Info:
  Machine ID:                 81adbc8ef2714976934e7268986845df
  System UUID:                9B574D56-541E-0FCF-60FA-FAB65961603A
  Boot ID:                    a59d1d69-c9b6-4027-86dd-9e9a2e3ec0d4
  Kernel Version:             3.10.0-1160.119.1.el7.x86_64
  OS Image:                   CentOS Linux 7 (Core)
  Operating System:           linux
  Architecture:               amd64
  Container Runtime Version:  docker://26.1.4
  Kubelet Version:            v1.28.0
  Kube-Proxy Version:         v1.28.0
PodCIDR:                      10.244.0.0/24
PodCIDRs:                     10.244.0.0/24
Non-terminated Pods:          (6 in total)
  Namespace                   Name                              CPU Requests  CPU Limits  Memory Requests  Memory Limits  Age
  ---------                   ----                              ------------  ----------  ---------------  -------------  ---
  kube-system                 calico-node-fmdcl                 250m (6%)     0 (0%)      0 (0%)           0 (0%)         24h
  kube-system                 etcd-master                       100m (2%)     0 (0%)      100Mi (2%)       0 (0%)         24h
  kube-system                 kube-apiserver-master             250m (6%)     0 (0%)      0 (0%)           0 (0%)         24h
  kube-system                 kube-controller-manager-master    200m (5%)     0 (0%)      0 (0%)           0 (0%)         24h
  kube-system                 kube-proxy-q8prd                  0 (0%)        0 (0%)      0 (0%)           0 (0%)         24h
  kube-system                 kube-scheduler-master             100m (2%)     0 (0%)      0 (0%)           0 (0%)         24h
Allocated resources:
  (Total limits may be over 100 percent, i.e., overcommitted.)
  Resource           Requests    Limits
  --------           --------    ------
  cpu                900m (22%)  0 (0%)
  memory             100Mi (2%)  0 (0%)
  ephemeral-storage  0 (0%)      0 (0%)
  hugepages-1Gi      0 (0%)      0 (0%)
  hugepages-2Mi      0 (0%)      0 (0%)
Events:              <none>
worker node节点管理集群
#在node节点管理不了
[root@node1 ~]# kubectl get nodes
E1114 15:19:36.088668  120389 memcache.go:265] couldn't get current server API group list: Get "http://localhost:8080/api?timeout=32s": dial tcp [::1]:8080: connect: connection refused
E1114 15:19:36.089432  120389 memcache.go:265] couldn't get current server API group list: Get "http://localhost:8080/api?timeout=32s": dial tcp [::1]:8080: connect: connection refused
E1114 15:19:36.092663  120389 memcache.go:265] couldn't get current server API group list: Get "http://localhost:8080/api?timeout=32s": dial tcp [::1]:8080: connect: connection refused
E1114 15:19:36.093132  120389 memcache.go:265] couldn't get current server API group list: Get "http://localhost:8080/api?timeout=32s": dial tcp [::1]:8080: connect: connection refused
E1114 15:19:36.095271  120389 memcache.go:265] couldn't get current server API group list: Get "http://localhost:8080/api?timeout=32s": dial tcp [::1]:8080: connect: connection refused
The connection to the server localhost:8080 was refused - did you specify the right host or port?
解决
#在需求节点创建文件夹
[root@node1 ~]# mkdir .kube

#复制证书到需求节点
[root@master ~]# scp /etc/kubernetes/admin.conf node1:/root/.kube/config
The authenticity of host 'node1 (192.168.100.70)' can't be established.
ECDSA key fingerprint is SHA256:ZOS3UQbjkPP8ybhVt7qtsh6DZUXpSgZGEvEKE5Mo2Tw.
ECDSA key fingerprint is MD5:3e:67:d7:93:8d:40:8e:e0:44:8e:93:0d:04:83:63:70.
Are you sure you want to continue connecting (yes/no)? yes
Warning: Permanently added 'node1,192.168.100.70' (ECDSA) to the list of known hosts.
root@node1's password:
admin.conf                                                        100% 5646     3.2MB/s   00:00


#可以管理了
[root@node1 ~]# kubectl get nodes
NAME     STATUS   ROLES           AGE   VERSION
master   Ready    control-plane   25h   v1.28.0
node1    Ready    <none>          24h   v1.28.0
node2    Ready    <none>          24h   v1.28.0
[root@node1 ~]# kubectl get pod
NAME                     READY   STATUS    RESTARTS       AGE
nginx-7854ff8877-4lss5   1/1     Running   2 (123m ago)   23h
nginx-7854ff8877-fzbfm   1/1     Running   2 (123m ago)   23h
nginx-7854ff8877-mrmww   1/1     Running   2 (123m ago)   23h

#同理另外需求节点也可按照此
dashboard界面
下载并安装
[root@master ~]# wget https://raw.githubusercontent.com/kubernetes/dashboard/v2.6.1/aio/deploy/recommended.yaml
--2025-11-14 15:34:02--  https://raw.githubusercontent.com/kubernetes/dashboard/v2.6.1/aio/deploy/recommended.yaml
Resolving raw.githubusercontent.com (raw.githubusercontent.com)... 185.199.109.133, 185.199.110.133, 185.199.108.133, ...
Connecting to raw.githubusercontent.com (raw.githubusercontent.com)|185.199.109.133|:443... connected.
HTTP request sent, awaiting response... 200 OK
Length: 7621 (7.4K) [text/plain]
Saving to: ‘recommended.yaml’

100%[==========================================================>] 7,621       8.96KB/s   in 0.8s

2025-11-14 15:34:06 (8.96 KB/s) - ‘recommended.yaml’ saved [7621/7621]


[root@master ~]# vim recommended.yaml
//32行开始
kind: Service
apiVersion: v1
metadata:
 labels:
   k8s-app: kubernetes-dashboard
 name: kubernetes-dashboard
 namespace: kubernetes-dashboard
spec:
 ports:
    - port: 443
     targetPort: 8443
     nodePort: 30001               #添加
 selector:
   k8s-app: kubernetes-dashboard
 type: NodePort                  #添加


#应用修改后配置
[root@master ~]# kubectl apply -f recommended.yaml
namespace/kubernetes-dashboard created
serviceaccount/kubernetes-dashboard created
service/kubernetes-dashboard created
secret/kubernetes-dashboard-certs created
secret/kubernetes-dashboard-csrf created
secret/kubernetes-dashboard-key-holder created
configmap/kubernetes-dashboard-settings created
role.rbac.authorization.k8s.io/kubernetes-dashboard created
clusterrole.rbac.authorization.k8s.io/kubernetes-dashboard created
rolebinding.rbac.authorization.k8s.io/kubernetes-dashboard created
clusterrolebinding.rbac.authorization.k8s.io/kubernetes-dashboard created
deployment.apps/kubernetes-dashboard created
service/dashboard-metrics-scraper created
deployment.apps/dashboard-metrics-scraper created


#查看Pod状态
[root@master ~]# kubectl get ns
NAME                   STATUS   AGE
default                Active   25h
kube-node-lease        Active   25h
kube-public            Active   25h
kube-system            Active   25h
kubernetes-dashboard   Active   19s


#查看Pod状态
#之前
[root@master ~]# kubectl get pods -n kubernetes-dashboard
NAME                                         READY   STATUS              RESTARTS   AGE
dashboard-metrics-scraper-5657497c4c-plsqd   0/1     ContainerCreating   0          40s
kubernetes-dashboard-746fbfd67c-6zxnm        0/1     ContainerCreating   0          40s

#之后
[root@master ~]# kubectl get pods -n kubernetes-dashboard
NAME                                         READY   STATUS    RESTARTS   AGE
dashboard-metrics-scraper-5657497c4c-plsqd   1/1     Running   0          103s
kubernetes-dashboard-746fbfd67c-6zxnm        1/1     Running   0          103s


#查看Service暴露端口
[root@master ~]# kubectl get svc -n kubernetes-dashboard
NAME                        TYPE        CLUSTER-IP      EXTERNAL-IP   PORT(S)         AGE
dashboard-metrics-scraper   ClusterIP   10.99.240.30    <none>        8000/TCP        37m
kubernetes-dashboard        NodePort    10.103.180.61   <none>        443:30001/TCP   37m
访问dashborad界面
在浏览器中输入https://192.168.100.70:30001/
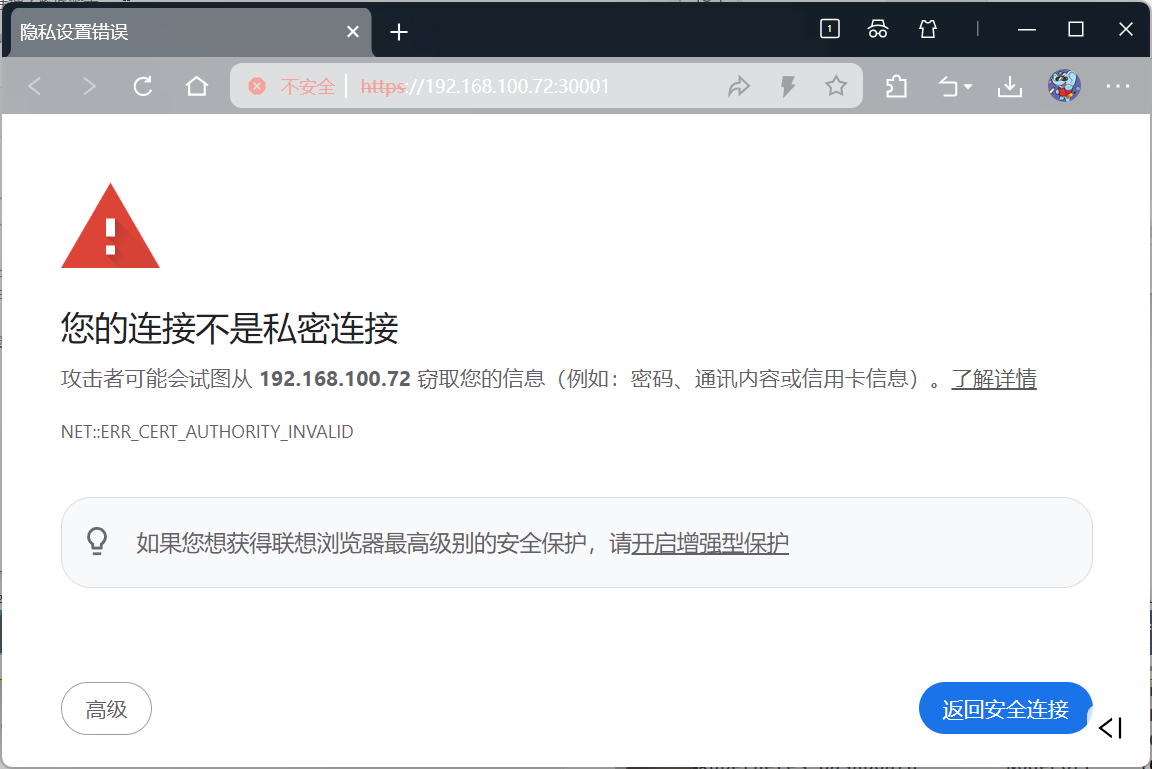
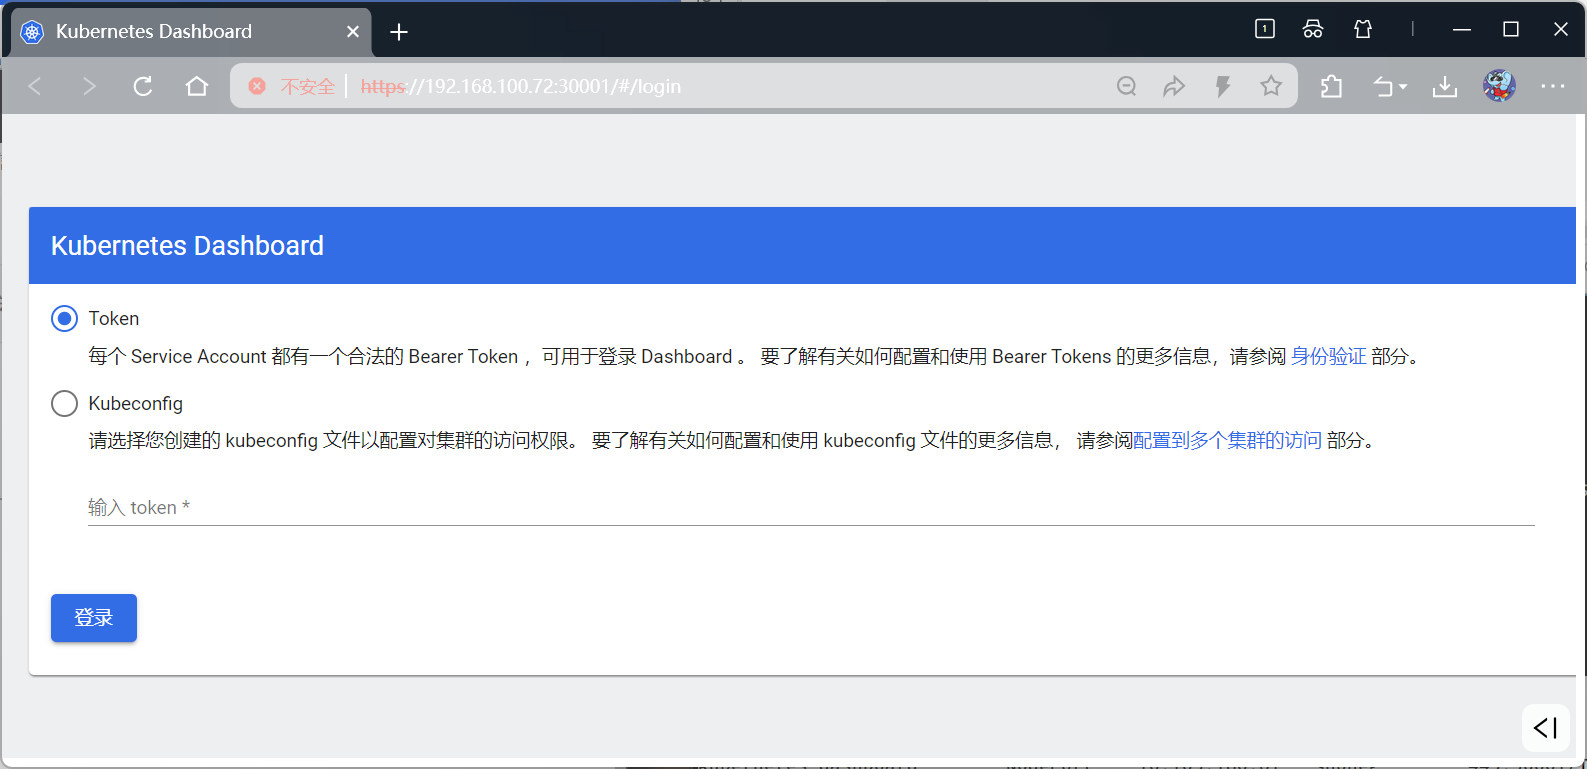
发现需要token,现在还没有,所以
创建访问令牌(Token)
#配置管理员账户
#创建rbac.yaml文件
[root@master ~]# vim rbac.yaml
[root@master ~]# cat rbac.yaml
apiVersion: v1
kind: ServiceAccount
metadata:
  name: dashboard-admin
  namespace: kube-system
---
apiVersion: rbac.authorization.k8s.io/v1
kind: ClusterRoleBinding
metadata:
  name: dashboard-admin
roleRef:
  apiGroup: rbac.authorization.k8s.io
  kind: ClusterRole
  name: cluster-admin
subjects:
- kind: ServiceAccount
  name: dashboard-admin
  namespace: kube-system


#应用配置并获取Token
[root@master ~]# kubectl apply -f rbac.yaml
serviceaccount/dashboard-admin created
clusterrolebinding.rbac.authorization.k8s.io/dashboard-admin created


#获取token
[root@master ~]# kubectl create token dashboard-admin --namespace kube-system
eyJhbGciOiJSUzI1NiIsImtpZCI6IjEzcEdFMjZoZVlOYUsyN0FFY3RldURDWGY4OWFRdlNuOFNscnZxMDRiS0kifQ.eyJhdWQiOlsiaHR0cHM6Ly9rdWJlcm5ldGVzLmRlZmF1bHQuc3ZjLmNsdXN0ZXIubG9jYWwiXSwiZXhwIjoxNzYzMTEyMTAxLCJpYXQiOjE3NjMxMDg1MDEsImlzcyI6Imh0dHBzOi8va3ViZXJuZXRlcy5kZWZhdWx0LnN2Yy5jbHVzdGVyLmxvY2FsIiwia3ViZXJuZXRlcy5pbyI6eyJuYW1lc3BhY2UiOiJrdWJlLXN5c3RlbSIsInNlcnZpY2VhY2NvdW50Ijp7Im5hbWUiOiJkYXNoYm9hcmQtYWRtaW4iLCJ1aWQiOiJmMzNjZTZkNy00M2MxLTQ5NTUtYTQ4NS0yNTQ2ZWI2YjAxNzAifX0sIm5iZiI6MTc2MzEwODUwMSwic3ViIjoic3lzdGVtOnNlcnZpY2VhY2NvdW50Omt1YmUtc3lzdGVtOmRhc2hib2FyZC1hZG1pbiJ9.dno4yrdy4_HRoqVWVSruqN4RP6UCrxrepsGf_c0U-l7cO64ybvhVbHJD_oZOr-QI7hpS-V1R246r-xk7yjfIZ4HgZtzEiQ9lSZEYxo5GFcdlBcUDXZ58DWd0tXMjZqIh9wr6LWq91e6DDz1kyDnKCfNL5wb01zSvg7DGsG2HrjED0OyJNrhX2glMAOjUotaCgzMThzsr_GlqYZ7MSa0ep9bftFAc6lkM3WN9lISyvdzanoIGAD4QKHEH2tKRlQv5l_UXWT7brruGythJbUC16bWxIWq0F_kzGwmYCP22bCYYbhH3Gw9J5wDzKxyv7XeRtREdHRBovbkBRuXkzouJFw

#输出的就是token,有效期1h,再次执行命令就会给新的旧的会消失
#复制到浏览器输入框中就可以
#如下图
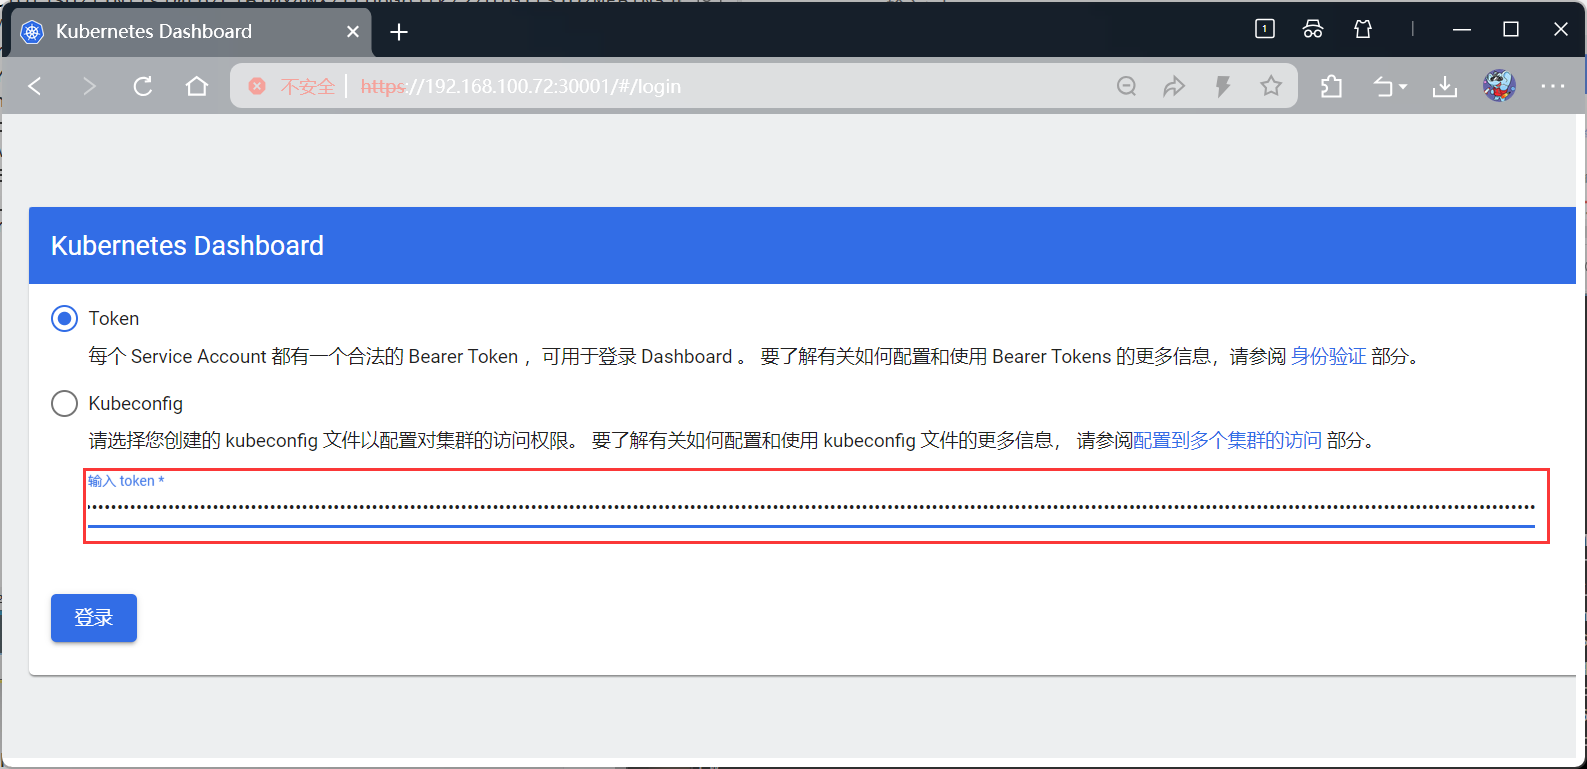
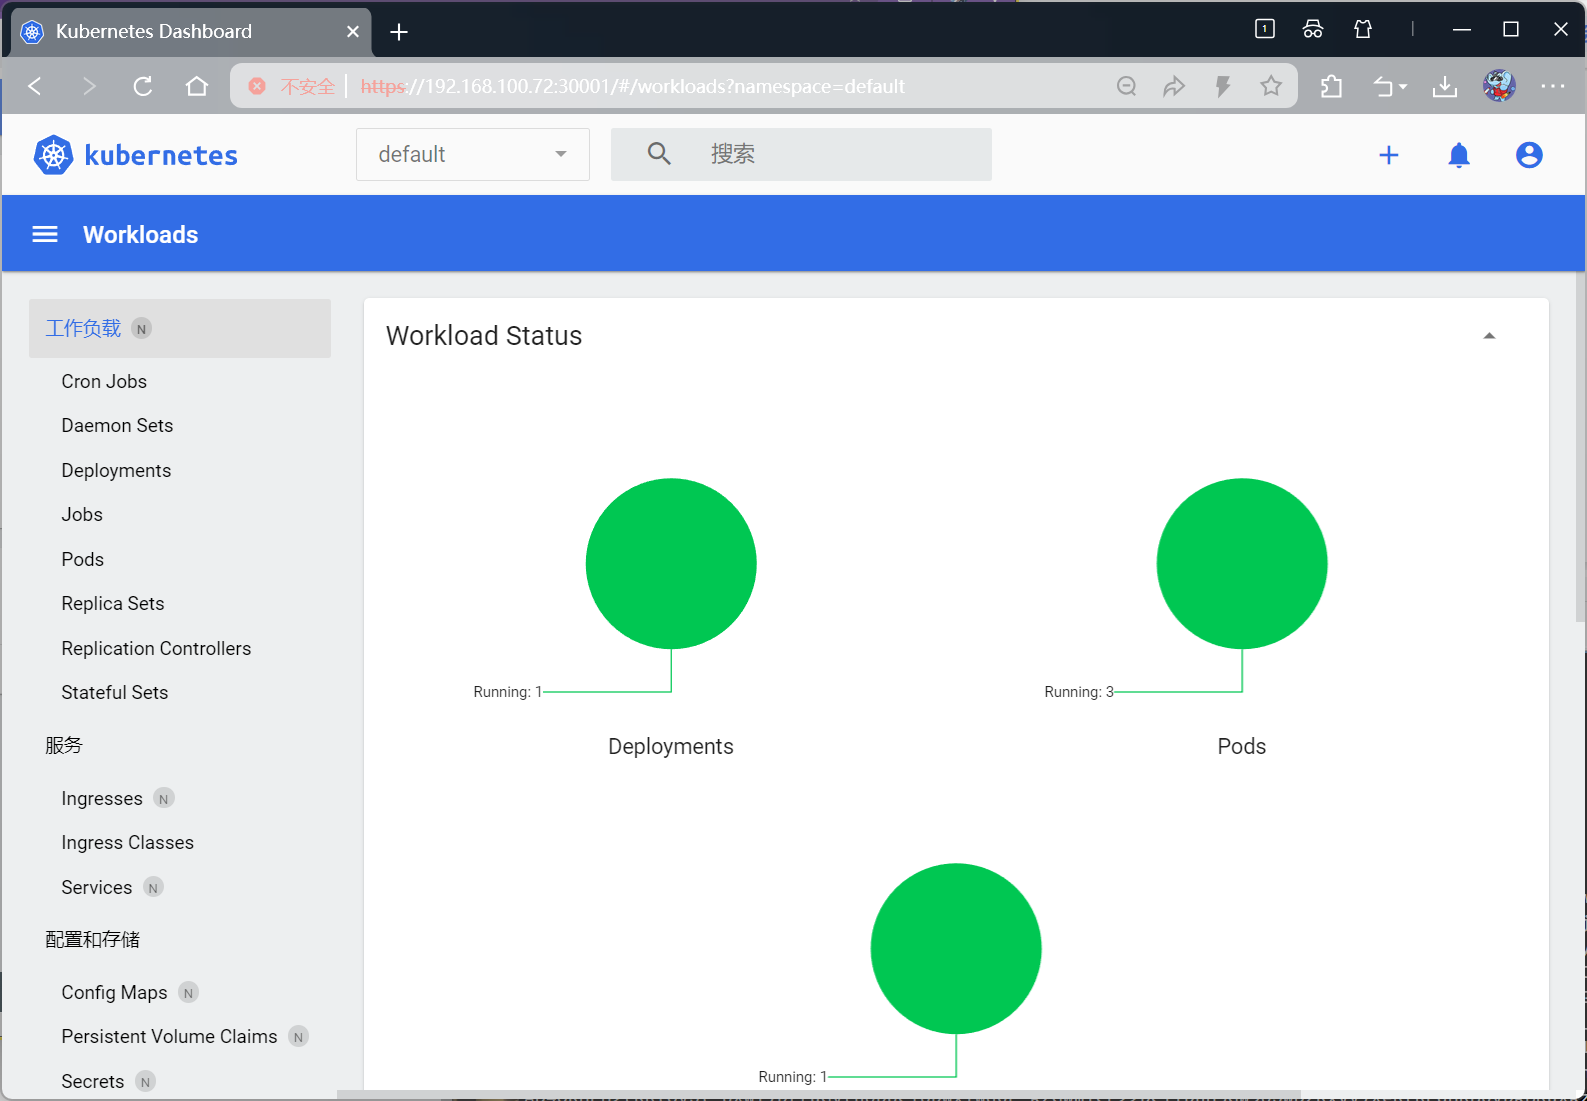
完成部署
更多推荐

 5
5 0
0- 0


 已为社区贡献11条内容

所有评论(0)