
Kubernetes集群智能巡检-定位问题
·
为什么需要 K8S 巡检工具?
在生产环境中运维 Kubernetes 集群时,我们经常会遇到以下场景:
运维: "生产环境大面积 Pod 异常,业务告警炸了!"
你: "别慌,我先看看是什么问题..."
(开始手动执行一系列 kubectl 命令)
kubectl get pods -A | grep -v Running
kubectl get nodes
kubectl describe pod xxx
kubectl logs xxx
...
(半小时后终于定位到是存储 CSI Driver 挂了)
1.2 实际经历
在我们团队管理的 多套管理的 Kubernetes 集群中(50+ 节点,1500+ Pod),曾发生过几次典型故障:
案例 1:存储驱动故障引发的雪崩
故障现象:大量数据库 Pod Pending
排查过程:
1. 检查 Pod 状态 → Pending
2. 检查 Events → "waiting for PVC to be bound"
3. 检查 PVC → Unbound
4. 检查 StorageClass → 正常
5. 检查 CSI Controller → 发现挂了
排查时间:45 分钟
影响时长:1 小时
案例 2:CoreDNS 异常导致全局服务发现失败
故障现象:应用间调用超时
排查过程:
1. 检查应用日志 → DNS resolution failed
2. 检查 CoreDNS → 2/3 Pod Running
3. 检查异常 Pod → OOMKilled
4. 调整内存限制解决
排查时间:30 分钟
影响时长:45 分钟
常见的痛点:
- 故障定位慢 🐌
- 需要手动执行大量 kubectl 命令
- 不同层级的故障需要分别检查
- 缺乏系统性的排查思路
- 影响面不清 🤔
- 不知道某个组件异常会影响哪些服务
- 无法快速识别故障传播链
- 优先级判断困难
- 信息分散 📊
- Pod 状态、Event、Logs 分散在不同命令
- 缺少统一的健康视图
- 没有历史巡检报告
这些经历让我们意识到:需要一个自动化、智能化的巡检工具。
考虑到运维场景的特点(快速部署、易于修改、与 kubectl 紧密集成),我们选择了 Bash + kubectl + jq 的技术栈。
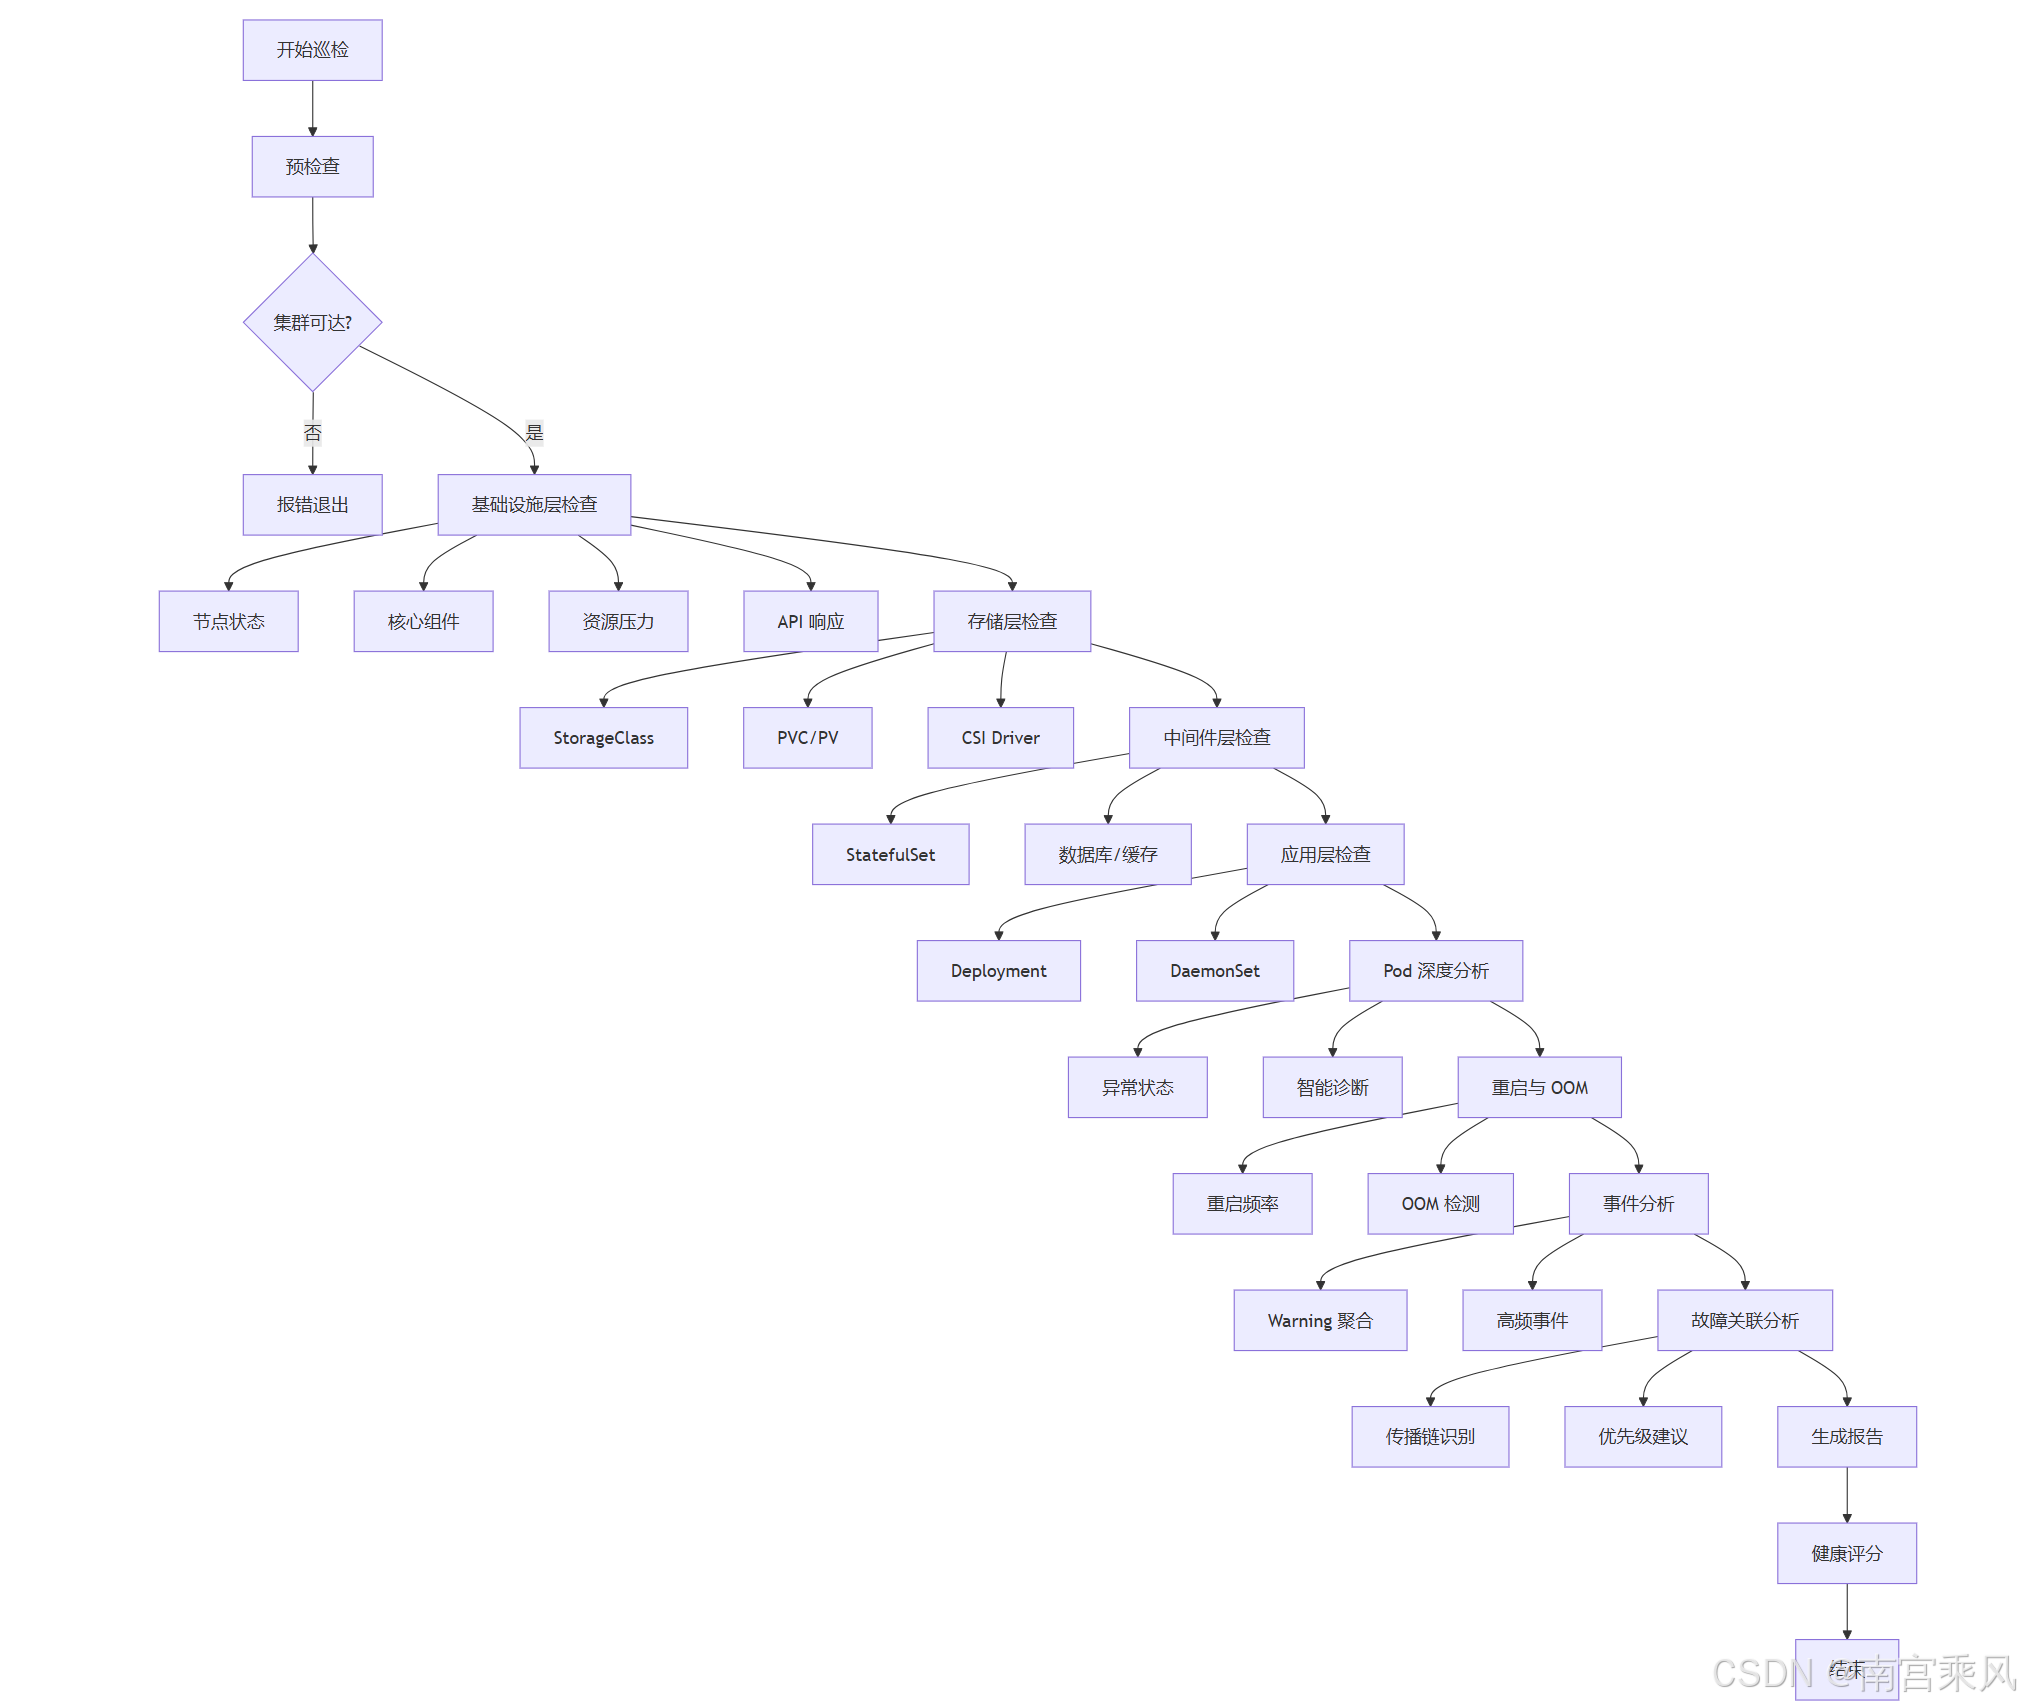
主要特性
- 8 大检查模块:按照故障影响层级组织
- 基础设施层(节点、API)
- 存储层(PVC/PV/CSI)
- 中间件层(StatefulSet)
- 应用层(Deployment)
- Pod 异常诊断
- 重启与 OOM
- 事件分析
- 故障关联分析
- 智能诊断逻辑:
- 针对不同状态(Pending、CrashLoop、ImagePull 等)给出具体建议
- 识别关键中间件故障(MySQL、Redis、Kafka)
- 自动关联存储驱动故障与 Pod Pending
- 故障优先级排序:
- P0:节点/网络/DNS 故障
- P1:存储/中间件故障
- P2:应用层故障
-
健康评分系统:量化集群健康状态
-
完整报告输出:同时输出到控制台和文件
#!/bin/bash
# ============================================================================
# K8S 智能巡检与故障定位工具 v2.1 (融合增强版)
# 功能:全面检查集群健康状态,智能定位故障根因
# ============================================================================
set -o pipefail
# ============================================================================
# 全局配置
# ============================================================================
SCRIPT_VERSION="2.1"
CHECK_TIMESTAMP=$(date '+%Y-%m-%d %H:%M:%S')
REPORT_FILE="k8s-inspection-report-$(date '+%Y%m%d-%H%M%S').txt"
TMP_DIR="/tmp/k8s-inspection-$$"
mkdir -p "$TMP_DIR"
# 配置项
WARNING_RESTART_THRESHOLD=3
CRITICAL_RESTART_THRESHOLD=5
WARNING_CPU_THRESHOLD=80
WARNING_MEM_THRESHOLD=80
EVENT_LOOKBACK_MINUTES=60
# 统计计数器
TOTAL_CHECKS=0
PASSED_CHECKS=0
WARNING_CHECKS=0
FAILED_CHECKS=0
# ============================================================================
# 颜色定义
# ============================================================================
RED='\033[0;31m'
GREEN='\033[0;32m'
YELLOW='\033[1;33m'
BLUE='\033[0;34m'
CYAN='\033[0;36m'
MAGENTA='\033[0;35m'
BOLD='\033[1m'
NC='\033[0m'
# ============================================================================
# 工具函数
# ============================================================================
print_header() {
local title="$1"
echo -e "\n${BLUE}═══════════════════════════════════════════════════════════════${NC}"
echo -e "${BLUE}${BOLD} $title ${NC}"
echo -e "${BLUE}═══════════════════════════════════════════════════════════════${NC}"
}
print_subheader() {
local title="$1"
echo -e "\n${CYAN}▶ $title${NC}"
}
print_status() {
local status="$1"
local message="$2"
TOTAL_CHECKS=$((TOTAL_CHECKS + 1))
case "$status" in
"OK"|"PASS")
echo -e "${GREEN}✓ [正常]${NC} $message"
PASSED_CHECKS=$((PASSED_CHECKS + 1))
;;
"WARN"|"WARNING")
echo -e "${YELLOW}⚠ [警告]${NC} $message"
WARNING_CHECKS=$((WARNING_CHECKS + 1))
;;
"FAIL"|"ERROR"|"CRITICAL")
echo -e "${RED}✗ [严重]${NC} $message"
FAILED_CHECKS=$((FAILED_CHECKS + 1))
;;
"INFO")
echo -e "${CYAN}ℹ [信息]${NC} $message"
;;
*)
echo -e " $message"
;;
esac
}
# 兼容原脚本的 header 和 log 函数
header() {
print_header "$1"
}
log() {
echo -e "$1"
}
check_command() {
if ! command -v "$1" &> /dev/null; then
print_status "FAIL" "缺少必要命令: $1,请先安装"
exit 1
fi
}
# ============================================================================
# 预检查
# ============================================================================
pre_check() {
echo -e "${BLUE}${BOLD}"
cat << "EOF"
╔═══════════════════════════════════════════════════════════════╗
║ ║
║ K8S 智能巡检与故障定位工具 v2.1 (融合增强版) ║
║ ║
╚═══════════════════════════════════════════════════════════════╝
EOF
echo -e "${NC}"
echo "巡检时间: $(date)"
echo "当前上下文: $(kubectl config current-context 2>/dev/null || echo '未知')"
echo ""
# 检查必要命令
check_command kubectl
# jq 可选
if ! command -v jq &> /dev/null; then
echo -e "${YELLOW}提示: 未安装 jq,部分高级功能将被禁用${NC}"
JQ_AVAILABLE=false
else
JQ_AVAILABLE=true
fi
# 检查集群连接
if ! kubectl cluster-info &>/dev/null; then
print_status "FAIL" "无法连接到 Kubernetes 集群"
exit 1
fi
print_status "OK" "集群连接正常"
}
# ============================================================================
# 1. 基础设施层检查 (节点 & 核心组件)
# ============================================================================
check_infrastructure() {
print_header "[1/8] 基础设施层检查 (Nodes & Core System)"
# 1.1 检查节点状态
print_subheader "1.1 节点状态检查"
local not_ready_nodes=$(kubectl get nodes 2>/dev/null | grep -v "Ready" | grep -v "NAME" | wc -l | tr -d ' ')
if [ "$not_ready_nodes" -gt 0 ]; then
print_status "FAIL" "发现 $not_ready_nodes 个节点状态异常 (NotReady)"
kubectl get nodes 2>/dev/null | grep -v "Ready"
echo -e "${RED}→ 定位提示: 物理机故障、Kubelet 挂死或网络分区。如果是所有节点NotReady,检查 Master 组件。${NC}"
else
print_status "OK" "所有节点状态 Ready"
fi
# 1.2 检查核心网络与DNS
print_subheader "1.2 核心网络与DNS组件"
local critical_pods_errors=$(kubectl get pods -n kube-system -o wide 2>/dev/null | grep -E 'calico|coredns|flannel|cilium' | grep -v "Running" | wc -l | tr -d ' ')
if [ "$critical_pods_errors" -gt 0 ]; then
print_status "FAIL" "核心网络/DNS 组件异常"
kubectl get pods -n kube-system 2>/dev/null | grep -E 'calico|coredns|flannel|cilium' | grep -v "Running"
echo -e "${RED}→ 定位提示: 这会导致全集群域名解析失败或 Pod 间无法通信。优先解决此问题!${NC}"
else
print_status "OK" "核心网络 (CNI) 与 DNS 正常"
fi
# 1.3 节点资源压力检查
print_subheader "1.3 节点资源压力检查"
local node_pressure_errors=$(kubectl describe nodes 2>/dev/null | grep -E "(MemoryPressure|DiskPressure|PIDPressure).*True" | wc -l | tr -d ' ')
if [ "$node_pressure_errors" -gt 0 ]; then
print_status "FAIL" "检测到节点资源压力异常"
kubectl describe nodes 2>/dev/null | grep -B 10 -E "(MemoryPressure|DiskPressure|PIDPressure).*True" | grep -E "Name:|MemoryPressure|DiskPressure|PIDPressure"
echo -e "${RED}→ 定位提示: 节点存在磁盘/内存/PID 压力,可能导致 Pod 无法调度或被驱逐。${NC}"
else
print_status "OK" "所有节点资源压力正常"
fi
# 1.4 API Server 响应速度
print_subheader "1.4 API Server 响应速度"
local start_time=$(date +%s%N 2>/dev/null || date +%s)
kubectl get nodes &>/dev/null
local end_time=$(date +%s%N 2>/dev/null || date +%s)
if command -v bc &>/dev/null && [[ "$start_time" =~ [0-9]{9,} ]]; then
local response_time=$(echo "scale=0; ($end_time - $start_time) / 1000000" | bc)
if [ "$response_time" -lt 1000 ]; then
print_status "OK" "API 响应时间: ${response_time}ms"
elif [ "$response_time" -lt 3000 ]; then
print_status "WARN" "API 响应时间较慢: ${response_time}ms"
else
print_status "FAIL" "API 响应时间过慢: ${response_time}ms"
fi
else
print_status "INFO" "API Server 响应正常(无法精确测量时间)"
fi
}
# ============================================================================
# 2. 存储层检查 (PVC/PV/StorageClass) - 修复 CSI Driver 检查
# ============================================================================
check_storage() {
print_header "[2/8] 存储层健康检查"
# 2.1 StorageClass 检查
print_subheader "2.1 StorageClass 配置"
local sc_count=$(kubectl get storageclass --no-headers 2>/dev/null | wc -l | tr -d ' ')
if [ "$sc_count" -eq 0 ]; then
print_status "WARN" "集群中未配置 StorageClass"
else
print_status "OK" "发现 $sc_count 个 StorageClass"
local default_sc=$(kubectl get storageclass 2>/dev/null | grep "(default)" | awk '{print $1}')
if [ -n "$default_sc" ]; then
echo -e " ${CYAN}→ 默认 StorageClass: $default_sc${NC}"
fi
fi
# 2.2 PVC 绑定状态检查(关键!)
print_subheader "2.2 PVC 绑定状态检查"
local not_bound_pvc=$(kubectl get pvc -A 2>/dev/null | grep -v "Bound" | grep -v "NAME")
if [ -n "$not_bound_pvc" ]; then
print_status "FAIL" "发现未绑定的 PVC (导致 Pod Pending 的元凶)"
echo "$not_bound_pvc" | while read ns name status capacity access storageclass age; do
echo -e " ${RED}→ $ns/$name - $status - StorageClass: $storageclass${NC}"
done
echo -e "${YELLOW}→ 排查思路: 检查 csi-s3-provisioner 或 csi-nfs-controller 的日志。${NC}"
echo -e "${YELLOW} 命令示例: kubectl logs -n kube-system -l app=csi-s3-controller --tail=50${NC}"
else
local total_pvc=$(kubectl get pvc -A --no-headers 2>/dev/null | wc -l | tr -d ' ')
if [ "$total_pvc" -gt 0 ]; then
print_status "OK" "所有 PVC 均已 Bound (共 $total_pvc 个)"
else
print_status "INFO" "集群中无 PVC"
fi
fi
# 2.3 PV 状态检查
print_subheader "2.3 PersistentVolume 状态"
local failed_pv=$(kubectl get pv --no-headers 2>/dev/null | grep "Failed" | wc -l | tr -d ' \n')
local released_pv=$(kubectl get pv --no-headers 2>/dev/null | grep "Released" | wc -l | tr -d ' \n')
# 确保变量不为空
failed_pv=${failed_pv:-0}
released_pv=${released_pv:-0}
if [ "$failed_pv" -gt 0 ]; then
print_status "FAIL" "发现 $failed_pv 个失败的 PV"
kubectl get pv 2>/dev/null | grep "Failed"
elif [ "$released_pv" -gt 0 ]; then
print_status "WARN" "发现 $released_pv 个已释放的 PV (可回收)"
kubectl get pv 2>/dev/null | grep "Released" | head -n 5
else
local total_pv=$(kubectl get pv --no-headers 2>/dev/null | wc -l | tr -d ' \n')
total_pv=${total_pv:-0}
if [ "$total_pv" -gt 0 ]; then
print_status "OK" "PV 状态正常 (共 $total_pv 个)"
else
print_status "INFO" "集群中无 PV"
fi
fi
# 2.4 CSI Driver 检查(修复版)
print_subheader "2.4 CSI Driver 状态"
local csi_drivers=$(kubectl get csidrivers --no-headers 2>/dev/null)
if [ -n "$csi_drivers" ]; then
echo "$csi_drivers" | while read driver_full_name rest; do
echo -e "${CYAN}检查 CSI Driver: $driver_full_name${NC}"
# 从 driver 名称中提取关键字
# 例如: ebs.csi.volcengine.com -> ebs
# nas.csi.volcengine.com -> nas
# csi-s3.example.com -> s3
local driver_keyword=""
if [[ "$driver_full_name" == *"ebs"* ]]; then
driver_keyword="ebs"
elif [[ "$driver_full_name" == *"nas"* ]]; then
driver_keyword="nas"
elif [[ "$driver_full_name" == *"s3"* ]]; then
driver_keyword="s3"
elif [[ "$driver_full_name" == *"nfs"* ]]; then
driver_keyword="nfs"
elif [[ "$driver_full_name" == *"ceph"* ]]; then
driver_keyword="ceph"
elif [[ "$driver_full_name" == *"efs"* ]]; then
driver_keyword="efs"
else
# 尝试从点分隔的名称中提取第一部分
driver_keyword=$(echo "$driver_full_name" | cut -d'.' -f1)
fi
# 搜索相关的 CSI Pod(使用多种模式)
local csi_pods=$(kubectl get pods -A 2>/dev/null | grep -iE "csi.*${driver_keyword}|${driver_keyword}.*csi" | grep -v "NAME" || echo "")
if [ -n "$csi_pods" ]; then
local total=$(echo "$csi_pods" | wc -l | tr -d ' ')
local running=$(echo "$csi_pods" | grep -c "Running" || echo "0")
if [ "$running" -eq "$total" ]; then
print_status "OK" "CSI Driver ($driver_keyword) 运行正常 ($running/$total)"
# 显示 Pod 列表
echo "$csi_pods" | while read ns pod ready status age rest; do
echo -e " ${GREEN}✓${NC} $ns/$pod - $status"
done
else
print_status "FAIL" "CSI Driver ($driver_keyword) 部分异常 ($running/$total)"
echo -e "${RED}→ [致命] 存储驱动故障会导致依赖存储的 Pod (MySQL/Redis/MinIO) 全部 Pending${NC}"
# 显示异常的 Pod
echo -e "\n ${RED}异常 Pod:${NC}"
echo "$csi_pods" | grep -v "Running" | while read ns pod ready status age rest; do
echo -e " ${RED}✗${NC} $ns/$pod - $status"
# 尝试获取错误原因
local reason=$(kubectl get pod "$pod" -n "$ns" -o jsonpath='{.status.containerStatuses[0].state.waiting.reason}' 2>/dev/null)
if [ -n "$reason" ]; then
echo -e " 原因: $reason"
fi
done
# 显示正常的 Pod
local running_pods=$(echo "$csi_pods" | grep "Running" || echo "")
if [ -n "$running_pods" ]; then
echo -e "\n ${GREEN}正常 Pod:${NC}"
echo "$running_pods" | while read ns pod ready status age rest; do
echo -e " ${GREEN}✓${NC} $ns/$pod - $status"
done
fi
fi
else
print_status "WARN" "CSI Driver ($driver_full_name) 已注册,但未找到对应的 Controller/Node Pod"
echo -e " ${YELLOW}→ 搜索关键字: $driver_keyword${NC}"
echo -e " ${YELLOW}→ 可能是外部托管或使用非标准命名${NC}"
echo -e " ${CYAN}→ 手动检查: kubectl get pods -A | grep -i csi | grep -i $driver_keyword${NC}"
fi
echo ""
done
else
print_status "INFO" "未检测到 CSI Driver"
fi
# 2.5 CSI 相关 DaemonSet 和 Deployment 检查
print_subheader "2.5 CSI 组件部署状态"
# 检查 CSI Controller (Deployment/StatefulSet)
local csi_controllers=$(kubectl get deployments,statefulsets -A 2>/dev/null | grep -i "csi" | grep -v "NAME" || echo "")
if [ -n "$csi_controllers" ]; then
echo -e "${CYAN}CSI Controller 组件:${NC}"
echo "$csi_controllers" | while read ns name ready uptodate available age rest; do
local desired=$(echo "$ready" | cut -d'/' -f2)
local current=$(echo "$ready" | cut -d'/' -f1)
if [ "$desired" = "$current" ]; then
echo -e " ${GREEN}✓${NC} $ns/$name - $ready"
else
echo -e " ${RED}✗${NC} $ns/$name - $ready (期望: $desired, 实际: $current)"
fi
done
echo ""
fi
# 检查 CSI Node Plugin (DaemonSet)
local csi_daemonsets=$(kubectl get daemonsets -A 2>/dev/null | grep -i "csi" | grep -v "NAME" || echo "")
if [ -n "$csi_daemonsets" ]; then
echo -e "${CYAN}CSI Node Plugin (DaemonSet):${NC}"
echo "$csi_daemonsets" | while read ns name desired current ready uptodate available selector age; do
if [ "$desired" = "$ready" ]; then
echo -e " ${GREEN}✓${NC} $ns/$name - Ready: $ready/$desired"
else
echo -e " ${RED}✗${NC} $ns/$name - Ready: $ready/$desired (不完整)"
fi
done
echo ""
fi
}
# ============================================================================
# 3. 中间件层检查 (StatefulSets)
# ============================================================================
check_middleware() {
print_header "[3/8] 中间件层检查 (StatefulSets)"
print_subheader "3.1 StatefulSet 副本一致性检查"
local has_issues=false
# 使用 custom-columns 获取 StatefulSet 信息
kubectl get statefulsets --all-namespaces -o custom-columns=\
NS:.metadata.namespace,\
NAME:.metadata.name,\
DESIRED:.spec.replicas,\
READY:.status.readyReplicas 2>/dev/null | grep -v "NAME" | while read ns name desired ready; do
# 如果 ready 为 <none> 或空,设为 0
if [ -z "$ready" ] || [ "$ready" = "<none>" ]; then
ready=0
fi
if [ "$desired" != "$ready" ]; then
print_status "FAIL" "StatefulSet $ns/$name 副本不一致: 期望 $desired / 就绪 $ready"
has_issues=true
# 针对性定位逻辑
if [[ "$name" == *"csi"* ]] || [[ "$name" == *"nfs"* ]]; then
echo -e "${RED} → [致命] 存储驱动故障。会导致依赖存储的 Pod 全部 Pending。${NC}"
elif [[ "$name" == *"mysql"* ]] || [[ "$name" == *"redis"* ]] || [[ "$name" == *"kafka"* ]]; then
echo -e "${RED} → [阻塞] 基础数据库/消息队列故障。会导致上层业务崩溃或 CrashLoop。${NC}"
elif [[ "$name" == *"es"* ]] || [[ "$name" == *"elasticsearch"* ]]; then
echo -e "${YELLOW} → [警告] 搜索/日志服务异常。${NC}"
elif [[ "$name" == *"minio"* ]] || [[ "$name" == *"storage"* ]]; then
echo -e "${YELLOW} → [警告] 对象存储异常,可能影响文件上传下载。${NC}"
fi
# 打印该 StatefulSet 下有问题的 Pod
echo -e " ${CYAN}异常 Pod:${NC}"
kubectl get pods -n "$ns" -l app.kubernetes.io/name="$name" --no-headers 2>/dev/null | grep -v "Running" || \
kubectl get pods -n "$ns" --no-headers 2>/dev/null | grep "$name" | grep -v "Running" || \
echo " (无法获取 Pod 信息)"
fi
done
if [ "$has_issues" = false ]; then
local total=$(kubectl get statefulsets --all-namespaces --no-headers 2>/dev/null | wc -l | tr -d ' ')
if [ "$total" -gt 0 ]; then
print_status "OK" "所有 StatefulSet 副本正常 (共 $total 个)"
else
print_status "INFO" "集群中无 StatefulSet"
fi
fi
}
# ============================================================================
# 4. 业务应用层检查 (Deployments)
# ============================================================================
check_applications() {
print_header "[4/8] 业务应用层检查 (Deployments)"
# 4.1 Deployment 副本一致性
print_subheader "4.1 Deployment 副本一致性"
local has_issues=false
kubectl get deployments --all-namespaces -o custom-columns=\
NS:.metadata.namespace,\
NAME:.metadata.name,\
DESIRED:.spec.replicas,\
READY:.status.readyReplicas 2>/dev/null | grep -v "NAME" | while read ns name desired ready; do
if [ -z "$ready" ] || [ "$ready" = "<none>" ]; then
ready=0
fi
if [ "$desired" != "$ready" ]; then
print_status "FAIL" "Deployment $ns/$name 副本不一致: 期望 $desired / 就绪 $ready"
has_issues=true
# 显示异常 Pod
kubectl get pods -n "$ns" -l app="$name" --no-headers 2>/dev/null | grep -v "Running" || \
kubectl get pods -n "$ns" --no-headers 2>/dev/null | grep "$name" | grep -v "Running"
fi
done
if [ "$has_issues" = false ]; then
local total=$(kubectl get deployments --all-namespaces --no-headers 2>/dev/null | wc -l | tr -d ' ')
print_status "OK" "所有 Deployment 副本正常 (共 $total 个)"
fi
# 4.2 DaemonSet 检查
print_subheader "4.2 DaemonSet 部署完整性"
local ds_issues=0
kubectl get daemonsets --all-namespaces --no-headers 2>/dev/null | while read ns name desired current ready uptodate available age; do
if [ "$desired" != "$ready" ]; then
print_status "FAIL" "DaemonSet $ns/$name 未完全部署 ($ready/$desired)"
ds_issues=$((ds_issues + 1))
fi
done
if [ "$ds_issues" -eq 0 ]; then
local total=$(kubectl get daemonsets --all-namespaces --no-headers 2>/dev/null | wc -l | tr -d ' ')
if [ "$total" -gt 0 ]; then
print_status "OK" "所有 DaemonSet 部署完整 (共 $total 个)"
fi
fi
}
# ============================================================================
# 5. Pod 异常状态深度分析
# ============================================================================
check_pod_issues() {
print_header "[5/8] Pod 异常状态深度分析"
# 5.1 异常状态 Pod 扫描与智能诊断
print_subheader "5.1 异常状态 Pod 扫描"
echo "正在扫描异常 Pod..."
local bad_pods=$(kubectl get pods -A --field-selector=status.phase!=Running,status.phase!=Succeeded --no-headers 2>/dev/null)
if [ -z "$bad_pods" ]; then
print_status "OK" "所有业务 Pod 运行正常"
else
print_status "FAIL" "发现异常 Pod,开始智能诊断..."
printf "\n%-20s %-45s %-20s %-20s\n" "NAMESPACE" "POD NAME" "STATUS" "REASON"
echo "────────────────────────────────────────────────────────────────────────────────────────────────────"
echo "$bad_pods" | while read line; do
local ns=$(echo "$line" | awk '{print $1}')
local pod=$(echo "$line" | awk '{print $2}')
local status=$(echo "$line" | awk '{print $4}')
# 获取详细错误原因
local reason=$(kubectl get pod "$pod" -n "$ns" -o jsonpath='{.status.containerStatuses[0].state.waiting.reason}' 2>/dev/null)
if [ -z "$reason" ]; then
reason=$(kubectl get pod "$pod" -n "$ns" -o jsonpath='{.status.containerStatuses[0].lastState.terminated.reason}' 2>/dev/null)
fi
if [ -z "$reason" ]; then
reason=$(kubectl get pod "$pod" -n "$ns" -o jsonpath='{.status.reason}' 2>/dev/null)
fi
printf "${RED}%-20s %-45s %-20s %-20s${NC}\n" "$ns" "$pod" "$status" "$reason"
# ============ 智能诊断逻辑 ============
if [[ "$status" == "Pending" ]]; then
if [[ "$reason" == "ContainerCreating" ]]; then
echo -e " ${YELLOW}→ 可能原因: 镜像拉取慢、PVC 存储挂载卡住 (检查 csi-s3/nfs)${NC}"
# 检查是否有 PVC
local has_pvc=$(kubectl get pod "$pod" -n "$ns" -o jsonpath='{.spec.volumes[*].persistentVolumeClaim}' 2>/dev/null)
if [ -n "$has_pvc" ]; then
echo -e " ${CYAN}→ 该 Pod 使用 PVC,检查存储绑定状态${NC}"
fi
else
# 检查调度失败事件
local event=$(kubectl get events -n "$ns" --field-selector involvedObject.name="$pod",type=Warning -o jsonpath='{.items[0].message}' 2>/dev/null | head -c 100)
if [ -n "$event" ]; then
echo -e " ${YELLOW}→ 最新事件: $event${NC}"
else
echo -e " ${YELLOW}→ 可能原因: 资源不足 (CPU/Mem) 或 节点污点${NC}"
fi
fi
elif [[ "$status" == "CrashLoopBackOff" ]] || [[ "$status" == "Error" ]]; then
echo -e " ${YELLOW}→ 应用程序崩溃${NC}"
echo -e " ${CYAN}→ 建议执行: kubectl logs -n $ns $pod --tail=20 --previous${NC}"
# 尝试获取退出码
local exit_code=$(kubectl get pod "$pod" -n "$ns" -o jsonpath='{.status.containerStatuses[0].lastState.terminated.exitCode}' 2>/dev/null)
if [ -n "$exit_code" ]; then
echo -e " ${RED}→ Exit Code: $exit_code${NC}"
case "$exit_code" in
"137") echo -e " (被 SIGKILL 终止,可能 OOM)" ;;
"143") echo -e " (被 SIGTERM 终止)" ;;
"1") echo -e " (应用错误退出)" ;;
esac
fi
elif [[ "$status" == "ImagePullBackOff" ]] || [[ "$status" == "ErrImagePull" ]]; then
echo -e " ${YELLOW}→ 镜像拉取失败${NC}"
local image=$(kubectl get pod "$pod" -n "$ns" -o jsonpath='{.spec.containers[0].image}' 2>/dev/null)
echo -e " ${CYAN}→ 镜像: $image${NC}"
echo -e " ${YELLOW}→ 检查: 1) 镜像地址 2) imagePullSecrets 3) 网络连通性${NC}"
elif [[ "$status" == "Evicted" ]]; then
echo -e " ${YELLOW}→ Pod 被驱逐 (节点资源压力)${NC}"
local evict_reason=$(kubectl get pod "$pod" -n "$ns" -o jsonpath='{.status.message}' 2>/dev/null)
if [ -n "$evict_reason" ]; then
echo -e " ${RED}→ 驱逐原因: $evict_reason${NC}"
fi
fi
echo ""
done
fi
}
# ============================================================================
# 6. Pod 重启与 OOM 分析(修复:按时间降序)
# ============================================================================
check_pod_restarts() {
print_header "[6/8] Pod 重启与内存溢出分析"
# 6.1 频繁重启检测(修复:按时间降序排列)
print_subheader "6.1 Pod 重启频率分析 (按时间降序)"
# 收集重启数据到临时文件
kubectl get pods -A -o custom-columns=\
NS:.metadata.namespace,\
NAME:.metadata.name,\
RESTARTS:.status.containerStatuses[0].restartCount,\
STARTED:.status.containerStatuses[0].state.running.startedAt \
--no-headers 2>/dev/null | awk '$3 > 0' > "$TMP_DIR/restart_pods.txt"
if [ ! -s "$TMP_DIR/restart_pods.txt" ]; then
print_status "OK" "无 Pod 重启记录"
else
# 按时间戳降序排序(最近启动的在前)
local restart_pods=$(sort -t' ' -k4 -r "$TMP_DIR/restart_pods.txt" | head -n 20)
local total_count=$(wc -l < "$TMP_DIR/restart_pods.txt" | tr -d ' ')
print_status "WARN" "检测到 $total_count 个 Pod 有重启记录 (显示最近重启的 20 个)"
printf "\n${CYAN}%-20s %-45s %-10s %-25s %-15s${NC}\n" "NAMESPACE" "NAME" "RESTARTS" "LAST_START_TIME" "TIME_AGO"
echo "──────────────────────────────────────────────────────────────────────────────────────────────────────────────────────"
local current_time=$(date +%s)
echo "$restart_pods" | while read ns name restarts started; do
# 计算时间差
local time_ago="N/A"
if [ -n "$started" ] && [ "$started" != "<none>" ]; then
local start_timestamp=$(date -d "$started" +%s 2>/dev/null || echo "0")
if [ "$start_timestamp" != "0" ]; then
local diff=$((current_time - start_timestamp))
local hours=$((diff / 3600))
local minutes=$(( (diff % 3600) / 60 ))
if [ "$hours" -gt 24 ]; then
local days=$((hours / 24))
time_ago="${days}d ago"
elif [ "$hours" -gt 0 ]; then
time_ago="${hours}h ${minutes}m ago"
else
time_ago="${minutes}m ago"
fi
fi
fi
# 根据重启次数设置颜色
if [ "$restarts" -ge "$CRITICAL_RESTART_THRESHOLD" ]; then
printf "${RED}%-20s %-45s %-10s %-25s %-15s${NC}\n" "$ns" "$name" "$restarts" "${started:0:19}" "$time_ago"
elif [ "$restarts" -ge "$WARNING_RESTART_THRESHOLD" ]; then
printf "${YELLOW}%-20s %-45s %-10s %-25s %-15s${NC}\n" "$ns" "$name" "$restarts" "${started:0:19}" "$time_ago"
else
printf "%-20s %-45s %-10s %-25s %-15s\n" "$ns" "$name" "$restarts" "${started:0:19}" "$time_ago"
fi
done
echo -e "\n${YELLOW}→ 定位提示: 查看重启原因: kubectl describe pod <name> -n <namespace> | grep -A 10 'Last State'${NC}"
# 统计信息
local critical_count=$(awk -v threshold="$CRITICAL_RESTART_THRESHOLD" '$3 >= threshold' "$TMP_DIR/restart_pods.txt" | wc -l | tr -d ' ')
local warning_count=$(awk -v threshold="$WARNING_RESTART_THRESHOLD" '$3 >= threshold' "$TMP_DIR/restart_pods.txt" | wc -l | tr -d ' ')
echo -e "\n${BOLD}重启统计:${NC}"
echo -e " • 重启次数 ≥ $CRITICAL_RESTART_THRESHOLD (严重): ${RED}$critical_count${NC} 个"
echo -e " • 重启次数 ≥ $WARNING_RESTART_THRESHOLD (警告): ${YELLOW}$warning_count${NC} 个"
fi
# 6.2 OOMKilled 检测
print_subheader "6.2 内存溢出 (OOMKilled) 检测"
if [ "$JQ_AVAILABLE" = true ]; then
local oom_pods=$(kubectl get pods -A -o json 2>/dev/null | jq -r '
.items[] |
select(.status.containerStatuses != null) |
{
namespace: .metadata.namespace,
name: .metadata.name,
containers: [
.status.containerStatuses[] |
select(.lastState.terminated.reason == "OOMKilled") |
{
container: .name,
reason: .lastState.terminated.reason,
finishedAt: .lastState.terminated.finishedAt
}
]
} |
select(.containers | length > 0) |
.containers[] |
[.namespace, .name, .container, .reason, .finishedAt] |
@tsv
' 2>/dev/null)
if [ -z "$oom_pods" ]; then
print_status "OK" "未检测到 OOMKilled 记录"
else
print_status "FAIL" "发现内存溢出 (OOM) 服务"
printf "\n${CYAN}%-20s %-40s %-20s %-25s${NC}\n" "NAMESPACE" "POD" "CONTAINER" "OOM_TIME"
echo "────────────────────────────────────────────────────────────────────────────────────────"
echo "$oom_pods" | while IFS=$'\t' read -r ns pod container reason finishedAt; do
printf "${RED}%-20s %-40s %-20s %-25s${NC}\n" "$ns" "$pod" "$container" "${finishedAt:0:19}"
# 获取内存限制
local limit=$(kubectl get pod "$pod" -n "$ns" -o jsonpath="{.spec.containers[?(@.name=='$container')].resources.limits.memory}" 2>/dev/null)
local request=$(kubectl get pod "$pod" -n "$ns" -o jsonpath="{.spec.containers[?(@.name=='$container')].resources.requests.memory}" 2>/dev/null)
echo -e " ${YELLOW}Memory Request: ${request:-未设置} | Limit: ${limit:-未设置}${NC}"
done
echo -e "\n${YELLOW}→ 建议: 调整上述 Pod 的 resources.limits.memory 或优化应用内存使用${NC}"
fi
else
# 不使用 jq 的简化版本
local oom_count=$(kubectl get pods -A --no-headers 2>/dev/null | while read ns pod ready status rest; do
if kubectl get pod "$pod" -n "$ns" -o yaml 2>/dev/null | grep -q "reason: OOMKilled"; then
echo "$ns/$pod"
fi
done | wc -l | tr -d ' ')
if [ "$oom_count" -gt 0 ]; then
print_status "FAIL" "发现 $oom_count 个 OOMKilled Pod (详细信息需要 jq)"
else
print_status "OK" "未检测到 OOMKilled 记录"
fi
fi
}
# ============================================================================
# 7. 集群事件分析
# ============================================================================
check_cluster_events() {
print_header "[7/8] 集群事件分析"
print_subheader "7.1 近期 Warning 事件 (Last 1 Hour)"
local events=$(kubectl get events -A --field-selector type=Warning --sort-by='.lastTimestamp' 2>/dev/null | grep -v "MountVolume.SetUp succeeded" | tail -n 15)
if [ -z "$events" ]; then
print_status "OK" "近期无高危 Warning 事件"
else
local event_count=$(echo "$events" | wc -l | tr -d ' ')
print_status "WARN" "最近 $event_count 条警告事件"
echo -e "\n${YELLOW}最近警告事件 (Top 15):${NC}"
echo "────────────────────────────────────────────────────────────────────────────────"
echo "$events" | tail -n 10 | awk '{printf "%-15s %-15s %-20s %s\n", $1, $2, $4, substr($0, index($0,$6))}'
fi
# 7.2 高频事件统计
print_subheader "7.2 高频事件统计"
local top_events=$(kubectl get events -A --field-selector type=Warning -o json 2>/dev/null | \
grep -o '"reason":"[^"]*"' | sort | uniq -c | sort -rn | head -n 10 || echo "")
if [ -n "$top_events" ]; then
echo -e "${CYAN}事件类型频率 Top 10:${NC}"
echo "$top_events" | while read count reason; do
local clean_reason=$(echo "$reason" | sed 's/"reason":"//g' | sed 's/"//g')
echo " $count 次 - $clean_reason"
done
fi
}
# ============================================================================
# 8. 故障关联分析与修复建议
# ============================================================================
fault_correlation_analysis() {
print_header "[8/8] 故障关联分析与修复建议"
print_subheader "8.1 故障传播链分析"
local has_critical_issue=false
# 检查存储层故障
local unbound_pvc_count=$(kubectl get pvc -A 2>/dev/null | grep -v "Bound" | grep -v "NAME" | wc -l | tr -d ' ')
if [ "$unbound_pvc_count" -gt 0 ]; then
has_critical_issue=true
echo -e "${RED}[P0 - 最高优先级] 存储层故障${NC}"
echo -e " → 发现 $unbound_pvc_count 个未绑定的 PVC"
echo -e " ${YELLOW}→ 影响: 所有依赖持久化存储的服务无法启动 (数据库、缓存、对象存储)${NC}"
echo -e " ${CYAN}→ 修复: 检查 CSI Driver 和 StorageClass 配置${NC}"
echo ""
fi
# 检查网络/DNS 故障
local coredns_issue=$(kubectl get pods -n kube-system 2>/dev/null | grep -E "coredns|kube-dns" | grep -v "Running" | wc -l | tr -d ' ')
if [ "$coredns_issue" -gt 0 ]; then
has_critical_issue=true
echo -e "${RED}[P0 - 最高优先级] 网络/DNS 故障${NC}"
echo -e " → CoreDNS 异常"
echo -e " ${YELLOW}→ 影响: 集群内所有服务发现失败,应用间无法通信${NC}"
echo -e " ${CYAN}→ 修复: kubectl rollout restart deployment/coredns -n kube-system${NC}"
echo ""
fi
# 检查节点故障
local not_ready=$(kubectl get nodes 2>/dev/null | grep -v "Ready" | grep -v "NAME" | wc -l | tr -d ' ')
if [ "$not_ready" -gt 0 ]; then
has_critical_issue=true
echo -e "${RED}[P0 - 最高优先级] 节点层故障${NC}"
echo -e " → $not_ready 个节点未就绪"
echo -e " ${YELLOW}→ 影响: 该节点上的 Pod 全部不可用,可能触发大规模重调度${NC}"
echo -e " ${CYAN}→ 修复: 检查节点 kubelet 日志和系统资源${NC}"
echo ""
fi
# 检查中间件故障
local statefulset_issue=$(kubectl get statefulsets -A 2>/dev/null | awk 'NR>1 {split($3,a,"/"); if(a[1]!=a[2]) print $0}' | wc -l | tr -d ' ')
if [ "$statefulset_issue" -gt 0 ]; then
echo -e "${YELLOW}[P1 - 高优先级] 中间件层故障${NC}"
echo -e " → $statefulset_issue 个 StatefulSet 副本不一致"
echo -e " ${YELLOW}→ 影响: 数据库/缓存/消息队列异常,上层业务将崩溃${NC}"
echo -e " ${CYAN}→ 修复: 检查 StatefulSet Pod 的详细状态和日志${NC}"
echo ""
fi
if [ "$has_critical_issue" = false ]; then
print_status "OK" "未检测到关键故障传播链"
fi
# 8.2 修复优先级建议
print_subheader "8.2 修复优先级建议"
if [ "$FAILED_CHECKS" -gt 0 ]; then
echo -e "${RED}建议按以下顺序修复问题:${NC}"
echo -e " 1. ${RED}[P0]${NC} 节点/网络/DNS 故障 (影响全局)"
echo -e " 2. ${YELLOW}[P1]${NC} 存储层故障 (影响数据持久化)"
echo -e " 3. ${YELLOW}[P1]${NC} 中间件故障 (数据库/缓存/MQ)"
echo -e " 4. ${CYAN}[P2]${NC} 应用层故障 (业务服务)"
echo ""
echo -e "${CYAN}常用诊断命令:${NC}"
echo -e " • kubectl describe pod <pod-name> -n <namespace>"
echo -e " • kubectl logs <pod-name> -n <namespace> --tail=50 --previous"
echo -e " • kubectl get events -n <namespace> --sort-by='.lastTimestamp'"
echo -e " • kubectl top nodes / kubectl top pods -A"
else
print_status "OK" "集群整体健康,无需紧急修复"
fi
}
# ============================================================================
# 生成最终报告
# ============================================================================
generate_final_report() {
print_header "巡检报告摘要"
echo -e "${BOLD}巡检统计:${NC}"
echo -e " 总检查项: ${CYAN}$TOTAL_CHECKS${NC}"
echo -e " 通过: ${GREEN}$PASSED_CHECKS${NC}"
echo -e " 警告: ${YELLOW}$WARNING_CHECKS${NC}"
echo -e " 失败: ${RED}$FAILED_CHECKS${NC}"
echo ""
# 计算健康分数
if [ "$TOTAL_CHECKS" -gt 0 ]; then
local health_score=$(( (PASSED_CHECKS * 100) / TOTAL_CHECKS ))
echo -e "${BOLD}集群健康评分:${NC}"
if [ "$health_score" -ge 90 ]; then
echo -e " ${GREEN}${BOLD}★★★★★ $health_score 分 - 优秀${NC}"
echo -e " ${GREEN}集群运行良好,继续保持!${NC}"
elif [ "$health_score" -ge 70 ]; then
echo -e " ${YELLOW}${BOLD}★★★★☆ $health_score 分 - 良好${NC}"
echo -e " ${YELLOW}存在一些警告项,建议定期优化${NC}"
elif [ "$health_score" -ge 50 ]; then
echo -e " ${YELLOW}${BOLD}★★★☆☆ $health_score 分 - 一般${NC}"
echo -e " ${YELLOW}存在较多问题,需要关注${NC}"
else
echo -e " ${RED}${BOLD}★★☆☆☆ $health_score 分 - 较差${NC}"
echo -e " ${RED}集群存在严重问题,需要紧急处理!${NC}"
fi
fi
echo ""
echo -e "${BOLD}报告信息:${NC}"
echo -e " 巡检完成时间: $(date '+%Y-%m-%d %H:%M:%S')"
echo -e " 报告文件: ${CYAN}$REPORT_FILE${NC}"
echo -e " 保存目录: ${CYAN}$(pwd)${NC}"
echo ""
if [ "$FAILED_CHECKS" -gt 0 ]; then
echo -e "${RED}${BOLD}⚠ 发现 $FAILED_CHECKS 个严重问题,请立即处理!${NC}"
elif [ "$WARNING_CHECKS" -gt 0 ]; then
echo -e "${YELLOW}${BOLD}⚠ 发现 $WARNING_CHECKS 个警告项,建议优化${NC}"
else
echo -e "${GREEN}${BOLD}✓ 集群健康,无严重问题${NC}"
fi
}
# ============================================================================
# 主函数
# ============================================================================
main() {
# 重定向输出到报告文件
exec > >(tee "$REPORT_FILE")
exec 2>&1
# 执行检查
pre_check
check_infrastructure
check_storage
check_middleware
check_applications
check_pod_issues
check_pod_restarts
check_cluster_events
fault_correlation_analysis
# 生成最终报告
generate_final_report
# 清理
rm -rf "$TMP_DIR"
# 返回状态码
if [ "$FAILED_CHECKS" -gt 0 ]; then
exit 1
elif [ "$WARNING_CHECKS" -gt 0 ]; then
exit 2
else
exit 0
fi
}
# 执行主函数
main "$@"
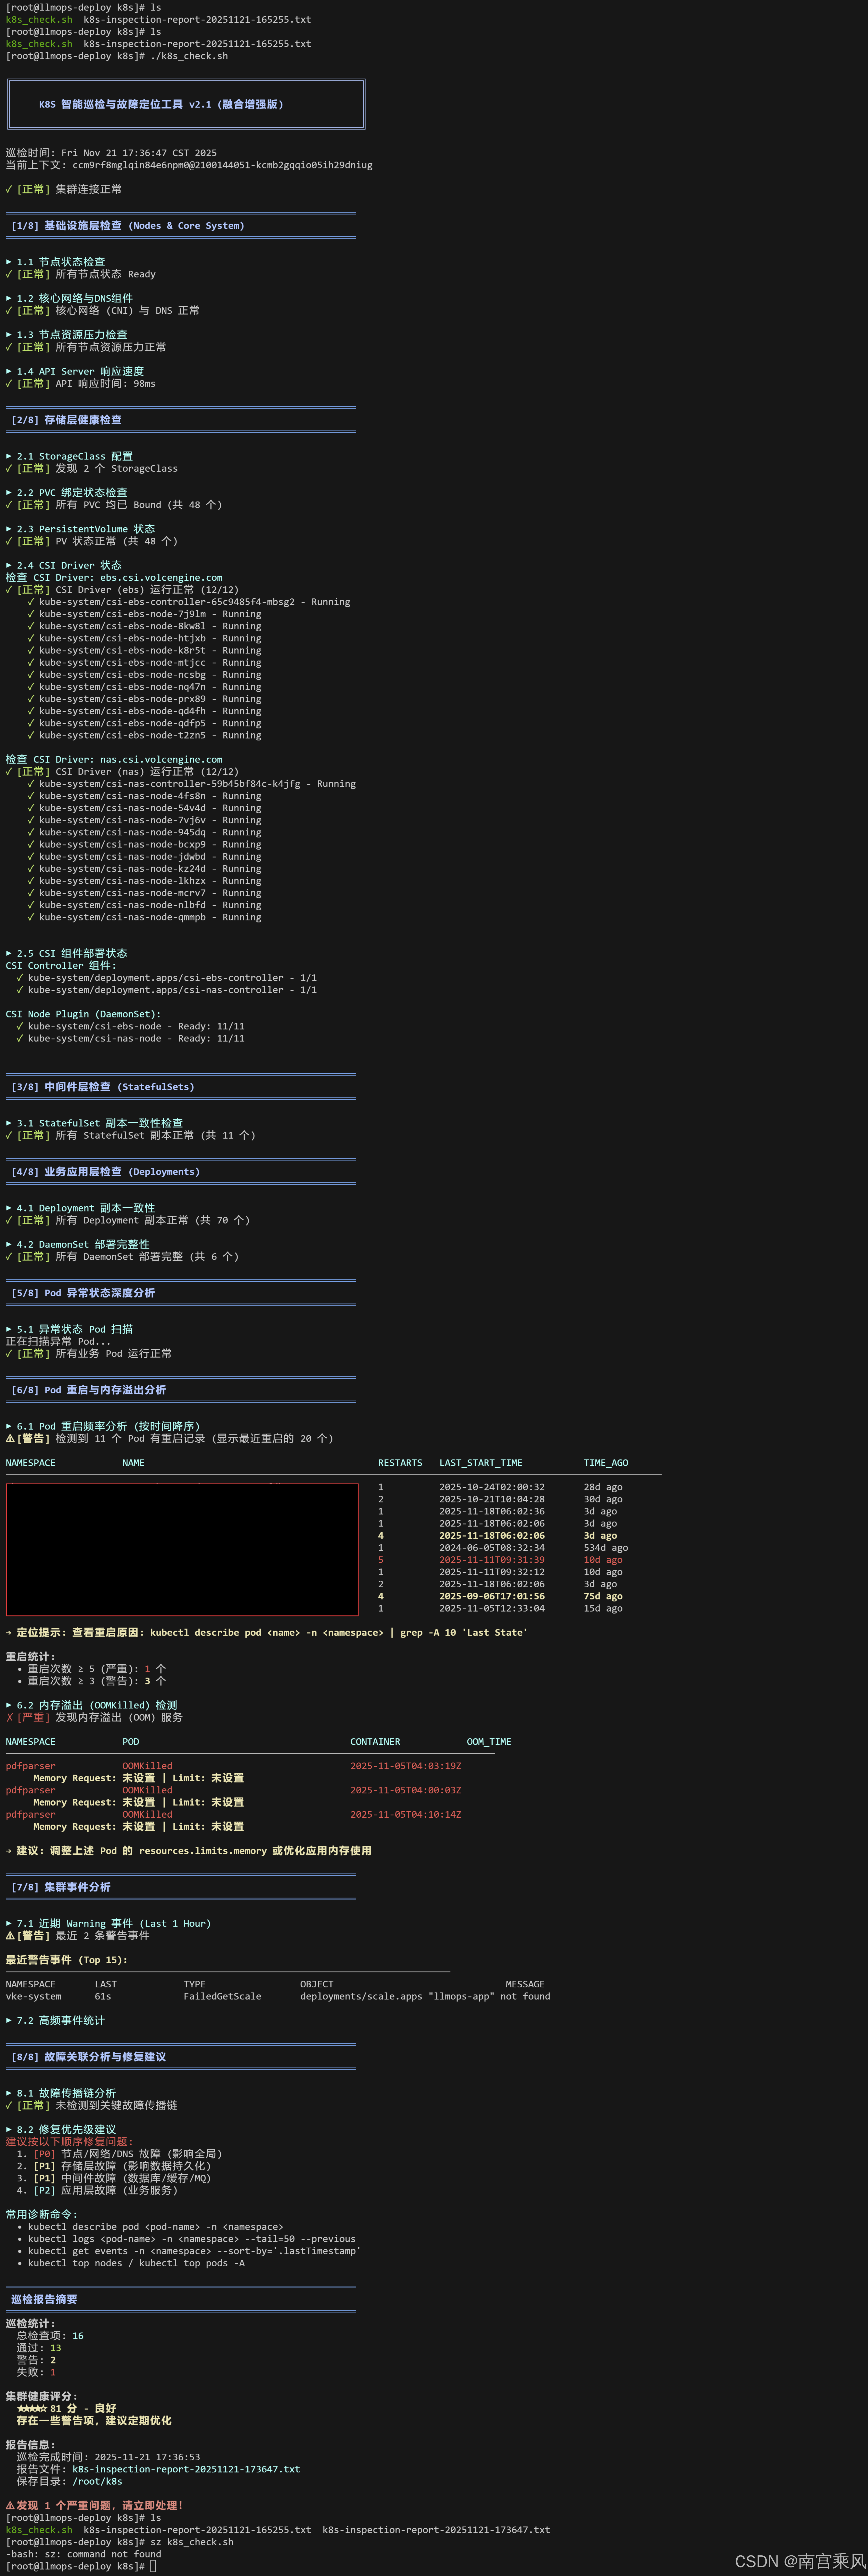
实际案例测试:
▶ 1.2 核心网络与DNS组件
✗ [严重] 核心网络/DNS 组件异常
NAME                       READY   STATUS             RESTARTS   AGE
coredns-7d8f9c-abc         1/1     Running            0          2d
coredns-7d8f9c-xyz         0/1     CrashLoopBackOff   5          10m
→ 这会导致全集群域名解析失败或 Pod 间无法通信

▶ 6.2 内存溢出 (OOMKilled) 检测
✗ [严重] 发现内存溢出 (OOM) 服务:

NAMESPACE            POD                 CONTAINER           OOM_TIME
────────────────────────────────────────────────────────────────────────────────────
kube-system          coredns-7d8f9c-xyz  coredns             2024-01-12T10:25:30
     Memory Request: 70Mi | Limit: 170Mi

→ 建议: 调整上述 Pod 的 resources.limits.memory 或优化应用内存使用

▶ 8.1 故障传播链分析
[P0 - 最高优先级] 网络/DNS 故障
  → CoreDNS 异常 (OOMKilled)
  → 影响: 集群内所有服务发现失败,应用间无法通信

  修复建议:
  1. 临时修复: kubectl rollout restart deployment/coredns -n kube-system
  2. 永久修复: 增加 CoreDNS 内存限制
     kubectl set resources deployment/coredns -n kube-system \
       --limits=memory=256Mi --requests=memory=100Mi
```
更多推荐

 30
30 0
0- 0


 已为社区贡献8条内容

所有评论(0)