
大模型写系统代码模板+好看的模型图模板
·
大模型写系统模板
# -*- coding: utf-8 -*-
import os
# 定义项目根目录名称
PROJECT_ROOT = "flight_analysis_system"
# 1. 创建项目目录结构(沿用NBA模板目录结构,修正缩进统一问题)
dirs = [
PROJECT_ROOT,
os.path.join(PROJECT_ROOT, "static"),
os.path.join(PROJECT_ROOT, "static", "css"),
os.path.join(PROJECT_ROOT, "static", "images"),
os.path.join(PROJECT_ROOT, "templates")
]
for dir_path in dirs:
if not os.path.exists(dir_path):
os.makedirs(dir_path)
print(f"创建目录:{dir_path}")
# 2. 定义所有文件完整内容(修正所有格式错误,确保可运行)
file_contents = {
# -------------------- requirements.txt(航班项目依赖,版本兼容无冲突) --------------------
os.path.join(PROJECT_ROOT, "requirements.txt"): """flask==2.3.3
pandas==2.1.4
numpy==1.26.2
matplotlib==3.8.2
openpyxl==3.1.2
Werkzeug==2.3.7""",
# -------------------- static/css/style.css(完全复用模板样式,CSS语法无错误) --------------------
os.path.join(PROJECT_ROOT, "static", "css", "style.css"): """/* 全局样式重置 */
* {
margin: 0;
padding: 0;
box-sizing: border-box;
font-family: "Microsoft YaHei", "SimHei", sans-serif;
}
/* 全局背景渐变(色彩艳丽) */
body {
background: linear-gradient(135deg, #FF6B6B, #4ECDC4, #45B7D1, #FFD166);
background-attachment: fixed;
min-height: 100vh;
}
/* 导航栏样式 */
.nav-bar {
background: rgba(0, 0, 0, 0.8);
padding: 1.2rem 0;
position: sticky;
top: 0;
z-index: 999;
box-shadow: 0 4px 12px rgba(0,0,0,0.5);
}
.nav-container {
width: 90%;
margin: 0 auto;
display: flex;
justify-content: space-around;
}
.nav-item {
color: #fff;
text-decoration: none;
font-size: 1.1rem;
font-weight: bold;
padding: 0.5rem 1rem;
border-radius: 8px;
transition: all 0.3s ease;
background: rgba(255,255,255,0.1);
}
.nav-item:hover {
background: #FF6B6B;
transform: translateY(-3px);
box-shadow: 0 4px 8px rgba(255,107,107,0.5);
}
/* 页面容器样式 */
.container {
width: 90%;
margin: 2rem auto;
background: rgba(255,255,255,0.95);
border-radius: 16px;
box-shadow: 0 8px 32px rgba(0,0,0,0.3);
padding: 2rem;
}
/* 标题样式 */
.page-title {
text-align: center;
color: #FF3838;
font-size: 2.5rem;
font-weight: bold;
margin-bottom: 2rem;
text-shadow: 2px 2px 4px rgba(0,0,0,0.2);
}
.sub-title {
color: #2E86AB;
font-size: 1.8rem;
margin: 1.5rem 0 1rem;
border-left: 5px solid #FF6B6B;
padding-left: 1rem;
}
/* 图表卡片布局(多元素排列) */
.chart-grid {
display: grid;
grid-template-columns: repeat(auto-fit, minmax(500px, 1fr));
gap: 2rem;
margin-top: 2rem;
}
.chart-card {
background: #fff;
border-radius: 12px;
box-shadow: 0 4px 16px rgba(0,0,0,0.1);
padding: 1.5rem;
transition: all 0.3s ease;
}
.chart-card:hover {
transform: translateY(-5px);
box-shadow: 0 8px 24px rgba(79,209,197,0.4);
}
.chart-title {
text-align: center;
color: #45B7D1;
font-size: 1.3rem;
margin-bottom: 1rem;
font-weight: bold;
}
/* 图表图片样式 */
.chart-img {
width: 100%;
height: auto;
border-radius: 8px;
box-shadow: 0 2px 8px rgba(0,0,0,0.1);
}
/* 首页入口按钮样式 */
.index-buttons {
display: grid;
grid-template-columns: repeat(auto-fit, minmax(200px, 1fr));
gap: 1.5rem;
margin-top: 3rem;
}
.index-btn {
background: linear-gradient(45deg, #FF6B6B, #FF8E53);
color: #fff;
text-align: center;
padding: 2rem 1rem;
border-radius: 12px;
text-decoration: none;
font-size: 1.2rem;
font-weight: bold;
box-shadow: 0 4px 12px rgba(255,107,107,0.3);
transition: all 0.3s ease;
}
.index-btn:hover {
transform: translateY(-5px);
box-shadow: 0 8px 20px rgba(255,107,107,0.5);
background: linear-gradient(45deg, #FF8E53, #FF6B6B);
color: #fff;
text-decoration: none;
}
/* 文本样式 */
.desc-text {
font-size: 1.1rem;
color: #333;
line-height: 1.8;
margin: 1rem 0;
text-align: center;
}
.about-text {
font-size: 1.1rem;
color: #555;
line-height: 2;
margin: 1.5rem 0;
}
/* 页脚样式 */
.footer {
text-align: center;
padding: 1.5rem 0;
color: #fff;
background: rgba(0,0,0,0.8);
margin-top: 3rem;
border-radius: 0 0 16px 16px;
}""",
# -------------------- flight_data_analysis.py(修正所有格式错误:缩进/文档字符串/容错性) --------------------
os.path.join(PROJECT_ROOT, "flight_data_analysis.py"): """# -*- coding: utf-8 -*-
import os
import pandas as pd
import numpy as np
import matplotlib.pyplot as plt
from matplotlib import font_manager
# 航班数据处理与可视化脚本
# 自动生成11张多彩图表,保存至static/images目录
# --------------------------
# 1. 图表保存目录(适配模板结构,无路径错误)
# --------------------------
IMAGE_DIR = "static/images"
if not os.path.exists(IMAGE_DIR):
os.makedirs(IMAGE_DIR)
# --------------------------
# 2. 设置Matplotlib中文支持(解决乱码,修正函数格式)
# --------------------------
def find_chinese_font():
candidates = ["SimHei", "Microsoft YaHei", "MSYH", "Noto Sans CJK", "WenQuanYi", "Arial Unicode MS"]
sys_fonts = font_manager.findSystemFonts(fontpaths=None, fontext='ttf')
name_to_path = {}
for f in sys_fonts:
try:
prop = font_manager.FontProperties(fname=f)
name = prop.get_name()
name_to_path[name] = f
except Exception:
continue
for c in candidates:
for name, path in name_to_path.items():
if c.lower() in name.lower() or c.lower() in path.lower():
return path, name
return None, None
font_path, font_name = find_chinese_font()
if font_path:
plt.rcParams['font.sans-serif'] = [font_name]
else:
plt.rcParams['font.sans-serif'] = ['SimHei']
plt.rcParams['axes.unicode_minus'] = False # 负号正常显示
plt.rcParams['figure.figsize'] = (10, 6) # 默认图表大小
# --------------------------
# 3. 数据转换辅助函数(修正函数缩进和返回值格式)
# --------------------------
def to_minutes(s):
if pd.isna(s):
return np.nan
s = str(s)
if "小时" in s:
parts = s.split("小时")
h = 0
try:
h = int(parts[0])
except:
h = 0
m = 0
if len(parts) > 1 and "分钟" in parts[1]:
mp = parts[1].replace("分钟", "").strip()
try:
m = int(mp)
except:
m = 0
return h * 60 + m
if "分钟" in s:
ns = s.replace("分钟", "").strip()
try:
return int(ns)
except:
return np.nan
try:
return float(s)
except:
return np.nan
def parse_hour(t):
try:
return int(str(t).split(":")[0])
except:
return np.nan
# --------------------------
# 4. 航班数据可视化核心函数(修正索引错误和缩进问题)
# --------------------------
def flight_data_analysis():
# 优先读取用户指定Excel文件,无则生成示例数据
excel_file = "光用24年一年的就行-22年1月1日至24年12月31日航班数据.xlsx"
if os.path.exists(excel_file):
print(f"检测到 {excel_file},正在读取...")
df = pd.read_excel(excel_file, nrows=300)
else:
print("未检测到指定Excel文件,生成示例航班数据...")
np.random.seed(42)
cities = ["北京", "上海", "广州", "深圳", "成都", "重庆", "杭州", "西安"]
airlines = ["中国国际航空", "中国南方航空", "中国东方航空", "海南航空", "深圳航空", "厦门航空"]
aircrafts = ["B737", "A320", "B787", "A330", "A350", "B777"]
dates = pd.date_range(start="2024-01-01", end="2024-01-10")
sample_data = {
"出发城市": np.random.choice(cities, 300),
"到达城市": np.random.choice(cities, 300),
"起飞机场": np.random.choice(["北京首都机场", "上海浦东机场", "广州白云机场", "深圳宝安机场", "成都双流机场"], 300),
"到达机场": np.random.choice(["北京首都机场", "上海浦东机场", "广州白云机场", "深圳宝安机场", "成都双流机场"], 300),
"起飞机场x": np.random.uniform(100, 120, 300),
"起飞机场y": np.random.uniform(30, 40, 300),
"航空公司": np.random.choice(airlines, 300),
"机型": np.random.choice(aircrafts, 300),
"里程(公里)": np.random.randint(500, 3000, 300),
"价格(元)": np.random.randint(300, 2000, 300),
"人数": np.random.randint(50, 200, 300),
"航班班次": np.random.randint(1, 5, 300),
"准点率": np.random.uniform(0.8, 0.99, 300),
"平均误点时间": np.random.choice(["10分钟", "20分钟", "1小时5分钟", "30分钟", "5分钟"], 300),
"起飞时间": np.random.choice(["08:30", "10:15", "13:45", "16:20", "19:00", "21:30"], 300),
"降落时间": np.random.choice(["10:30", "12:15", "15:45", "18:20", "21:00", "23:30"], 300),
"日期": np.random.choice(dates, 300),
"周一班期": np.random.choice(["有班期", ""], 300),
"周二班期": np.random.choice(["有班期", ""], 300),
"周三班期": np.random.choice(["有班期", ""], 300),
"周四班期": np.random.choice(["有班期", ""], 300),
"周五班期": np.random.choice(["有班期", ""], 300),
"周六班期": np.random.choice(["有班期", ""], 300),
"周日班期": np.random.choice(["有班期", ""], 300)
}
df = pd.DataFrame(sample_data)
# 数据清洗(修正列名索引错误,增加容错判断)
df.columns = [c.strip() for c in df.columns]
# 数值列转换
numeric_cols = ["里程(公里)", "价格(元)", "人数"]
for c in numeric_cols:
if c in df.columns:
df[c] = pd.to_numeric(df[c], errors="coerce")
# 准点率转百分比
if "准点率" in df.columns:
df["准点率"] = pd.to_numeric(df["准点率"], errors="coerce") * 100
# 误点时间转分钟
if "平均误点时间" in df.columns:
df["平均误点_minutes"] = df["平均误点时间"].apply(to_minutes)
# 起飞/降落小时提取
if "起飞时间" in df.columns:
df["起飞小时"] = df["起飞时间"].apply(parse_hour)
if "降落时间" in df.columns:
df["降落小时"] = df["降落时间"].apply(parse_hour)
# 日期转换
if "日期" in df.columns:
df["日期"] = pd.to_datetime(df["日期"], errors="coerce")
# 班期标志
weekday_cols = []
for w in ["周一班期","周二班期","周三班期","周四班期","周五班期","周六班期","周日班期"]:
if w in df.columns:
df[w + "_flag"] = df[w].fillna("").apply(lambda s: 1 if "有班期" in str(s) else 0)
weekday_cols.append(w + "_flag")
# 航线字段
if "出发城市" in df.columns and "到达城市" in df.columns:
df["route"] = df["出发城市"].astype(str) + " → " + df["到达城市"].astype(str)
else:
df["route"] = "未知航线"
# 机场流量聚合(增加非空判断)
if "起飞机场" in df.columns and "人数" in df.columns and "航班班次" in df.columns:
airport_traffic = df.groupby("起飞机场").agg({
"人数": "sum",
"航班班次": "count",
"起飞机场x": "first",
"起飞机场y": "first"
}).rename(columns={"航班班次":"航班数"}).reset_index()
else:
# 构造默认机场流量数据,避免报错
airport_traffic = pd.DataFrame({
"起飞机场": ["北京首都机场", "上海浦东机场"],
"人数": [1000, 800],
"航班数": [50, 40],
"起飞机场x": [116.4, 121.5],
"起飞机场y": [39.9, 31.2]
})
# 颜色配置(多彩可视化,修正颜色列表索引问题)
cmap = plt.get_cmap("tab20")
def color_list(n):
return [cmap(i % 20) for i in range(n)]
# --------------------------
# 生成11张航班可视化图表(增加数据非空判断,避免绘图报错)
# --------------------------
# 图表1:起飞机场分布(点大小=人数)
fig = plt.figure(figsize=(10,7))
if not airport_traffic.empty:
# 限制点大小范围,避免异常值
s_values = np.clip(airport_traffic["人数"].fillna(0)/2, 20, 900)
plt.scatter(airport_traffic["起飞机场x"], airport_traffic["起飞机场y"],
s=s_values, alpha=0.85, c=color_list(len(airport_traffic)))
# 避免循环索引错误
for i, r in airport_traffic.iterrows():
plt.text(r["起飞机场x"], r["起飞机场y"], r["起飞机场"], fontsize=9)
plt.xlabel("经度")
plt.ylabel("纬度")
plt.title("起飞机场分布(点大小表示累计人数)")
plt.tight_layout()
plt.savefig(os.path.join(IMAGE_DIR, "airport_distribution.png"), dpi=300)
plt.close()
# 图表2:前10航线航班数
if "route" in df.columns:
top_routes = df["route"].value_counts().head(10)
fig = plt.figure(figsize=(10,6))
# 修正倒序显示的索引问题
bars = plt.barh(top_routes.index[::-1], top_routes.values[::-1], color=color_list(len(top_routes)))
plt.title("前10条航线航班数")
plt.xlabel("航班记录数")
plt.tight_layout()
plt.savefig(os.path.join(IMAGE_DIR, "top10_routes_count.png"), dpi=300)
plt.close()
# 图表3:航空公司平均准点率
if "准点率" in df.columns and "航空公司" in df.columns:
airlines_data = df.groupby("航空公司")["准点率"].mean().sort_values(ascending=False)
if not airlines_data.empty:
fig = plt.figure(figsize=(10,6))
plt.bar(airlines_data.index, airlines_data.values, color=color_list(len(airlines_data)))
plt.xticks(rotation=45, ha="right")
plt.ylabel("平均准点率 (%)")
plt.title("各航空公司平均准点率")
plt.tight_layout()
plt.savefig(os.path.join(IMAGE_DIR, "airline_ontime.png"), dpi=300)
plt.close()
# 图表4:票价分布直方图
if "价格(元)" in df.columns:
prices = df["价格(元)"].dropna()
if not prices.empty:
fig = plt.figure(figsize=(8,6))
plt.hist(prices, bins=12, alpha=0.9, color=cmap(2))
plt.xlabel("票价(元)")
plt.title("票价分布")
plt.tight_layout()
plt.savefig(os.path.join(IMAGE_DIR, "price_distribution.png"), dpi=300)
plt.close()
# 图表5:航空公司票价箱线图
if "航空公司" in df.columns and "价格(元)" in df.columns:
# 过滤空值分组
group_data = []
group_labels = []
for name, g in df.groupby("航空公司"):
g_prices = g["价格(元)"].dropna()
if not g_prices.empty:
group_data.append(g_prices.values)
group_labels.append(name)
if len(group_data) > 0:
fig = plt.figure(figsize=(10,6))
bplot = plt.boxplot(group_data, labels=group_labels, patch_artist=True)
# 修正颜色赋值索引问题
for idx, (patch, color) in enumerate(zip(bplot['boxes'], color_list(len(group_labels)))):
patch.set_facecolor(color)
plt.xticks(rotation=45, ha="right")
plt.ylabel("票价(元)")
plt.title("航空公司间票价分布(箱线图)")
plt.tight_layout()
plt.savefig(os.path.join(IMAGE_DIR, "airline_price_box.png"), dpi=300)
plt.close()
# 图表6:票价vs里程散点+回归线
if "里程(公里)" in df.columns and "价格(元)" in df.columns:
mask = df["里程(公里)"].notna() & df["价格(元)"].notna()
x = df.loc[mask, "里程(公里)"]
y = df.loc[mask, "价格(元)"]
if not x.empty and not y.empty:
fig = plt.figure(figsize=(8,6))
plt.scatter(x, y, alpha=0.8, c=color_list(len(x)))
# 修正回归线拟合的索引错误
if len(x) > 1:
coef = np.polyfit(x, y, 1)
xp = np.linspace(x.min(), x.max(), 200)
plt.plot(xp, np.polyval(coef, xp), linestyle="--", linewidth=2, color='black')
plt.annotate(f"y={coef[0]:.2f}x+{coef[1]:.1f}", xy=(0.05,0.95), xycoords="axes fraction", va="top")
plt.xlabel("里程(公里)")
plt.ylabel("票价(元)")
plt.title("票价与里程关系")
plt.tight_layout()
plt.savefig(os.path.join(IMAGE_DIR, "price_vs_mileage.png"), dpi=300)
plt.close()
# 图表7:准点率vs里程散点
if "准点率" in df.columns and "里程(公里)" in df.columns:
mask2 = df["准点率"].notna() & df["里程(公里)"].notna()
x2 = df.loc[mask2, "里程(公里)"]
y2 = df.loc[mask2, "准点率"]
if not x2.empty and not y2.empty:
fig = plt.figure(figsize=(8,6))
plt.scatter(x2, y2, alpha=0.8, c=color_list(len(x2)))
plt.xlabel("里程(公里)")
plt.ylabel("准点率 (%)")
plt.title("准点率与里程关系")
plt.tight_layout()
plt.savefig(os.path.join(IMAGE_DIR, "ontime_vs_mileage.png"), dpi=300)
plt.close()
# 图表8:每周班期航班数
weekday_flags = [c for c in df.columns if c.endswith("_flag")]
if len(weekday_flags) > 0:
counts = df[weekday_flags].sum().values
days = ["周一","周二","周三","周四","周五","周六","周日"]
# 确保长度一致
if len(counts) == len(days):
fig = plt.figure(figsize=(9,4))
plt.bar(days, counts, color=color_list(7))
plt.ylabel("有班期航班数")
plt.title("每周各天有班期的航班数量")
plt.tight_layout()
plt.savefig(os.path.join(IMAGE_DIR, "weekday_schedule.png"), dpi=300)
plt.close()
# 图表9:起飞小时分布
if "起飞小时" in df.columns:
hours = df["起飞小时"].dropna().astype(int)
if not hours.empty:
fig = plt.figure(figsize=(10,4))
plt.hist(hours, bins=range(0,25), align='left', rwidth=0.8, color=cmap(1))
plt.xlabel("起飞小时(24h)")
plt.title("起飞小时分布")
plt.tight_layout()
plt.savefig(os.path.join(IMAGE_DIR, "departure_hour.png"), dpi=300)
plt.close()
# 图表10:前10航线乘客数
if "route" in df.columns and "人数" in df.columns:
route_pass = df.groupby("route")["人数"].sum().sort_values(ascending=False).head(10)
if not route_pass.empty:
fig = plt.figure(figsize=(10,6))
plt.barh(route_pass.index[::-1], route_pass.values[::-1], color=color_list(len(route_pass)))
plt.xlabel("乘客总数")
plt.title("乘客人数最多的前10条航线")
plt.tight_layout()
plt.savefig(os.path.join(IMAGE_DIR, "top10_routes_passengers.png"), dpi=300)
plt.close()
# 图表11:机型占比饼图
if "机型" in df.columns:
counts = df["机型"].value_counts().head(8)
if not counts.empty:
fig = plt.figure(figsize=(7,7))
plt.pie(counts.values, labels=counts.index, autopct="%1.1f%%", startangle=140, colors=color_list(len(counts)))
plt.title("主要机型占比(前8)")
plt.axis("equal")
plt.tight_layout()
plt.savefig(os.path.join(IMAGE_DIR, "aircraft_type_pie.png"), dpi=300)
plt.close()
# 输出分析摘要(增加非空判断,避免报错)
print("=== 航班数据可视化分析摘要 ===")
print(f"分析航班记录数: {len(df)}")
print(f"涉及航线数: {df['route'].nunique() if 'route' in df.columns else 0}")
print(f"涉及航空公司数: {df['航空公司'].nunique() if '航空公司' in df.columns else 0}")
print(f"涉及机场数: {df['起飞机场'].nunique() if '起飞机场' in df.columns else 0}")
print(f"所有图表已保存至 {IMAGE_DIR} 目录")
if __name__ == "__main__":
flight_data_analysis()""",
# -------------------- app.py(修正导入和函数调用格式,无语法错误) --------------------
os.path.join(PROJECT_ROOT, "app.py"): """# -*- coding: utf-8 -*-
from flask import Flask, render_template
import os
import flight_data_analysis
# 初始化Flask应用
app = Flask(__name__)
# 启动时自动生成航班可视化图表(增加文件存在判断的容错性)
chart_check_path = os.path.join("static", "images", "airport_distribution.png")
if not os.path.exists(chart_check_path):
print("正在生成航班可视化图表...")
flight_data_analysis.flight_data_analysis()
print("图表生成完成!")
# --------------------------
# 路由配置(多页面跳转,沿用模板导航结构,无语法错误)
# --------------------------
# 首页
@app.route('/')
def index():
return render_template('index.html')
# 机场分析页面
@app.route('/airport')
def airport_analysis():
return render_template('airport_analysis.html')
# 航线分析页面
@app.route('/route')
def route_analysis():
return render_template('route_analysis.html')
# 航空公司分析页面
@app.route('/airline')
def airline_analysis():
return render_template('airline_analysis.html')
# 票价分析页面
@app.route('/price')
def price_analysis():
return render_template('price_analysis.html')
# 时间分析页面
@app.route('/time')
def time_analysis():
return render_template('time_analysis.html')
# 关于系统页面
@app.route('/about')
def about():
return render_template('about.html')
# 程序入口
if __name__ == "__main__":
app.run(debug=True, host='0.0.0.0', port=5000)""",
# -------------------- templates/index.html(修正HTML标签格式,无闭合错误) --------------------
os.path.join(PROJECT_ROOT, "templates", "index.html"): """<!DOCTYPE html>
<html lang="zh-CN">
<head>
<meta charset="UTF-8">
<meta name="viewport" content="width=device-width, initial-scale=1.0">
<title>航班数据可视化系统 - 首页</title>
<link rel="stylesheet" href="{{ url_for('static', filename='css/style.css') }}">
</head>
<body>
<!-- 导航栏 -->
<div class="nav-bar">
<div class="nav-container">
<a href="/" class="nav-item">首页</a>
<a href="/airport" class="nav-item">机场分析</a>
<a href="/route" class="nav-item">航线分析</a>
<a href="/airline" class="nav-item">航空公司</a>
<a href="/price" class="nav-item">票价分析</a>
<a href="/time" class="nav-item">时间分析</a>
<a href="/about" class="nav-item">关于系统</a>
</div>
</div>
<!-- 页面容器 -->
<div class="container">
<h1 class="page-title">✈️ 全国航班数据可视化分析系统</h1>
<h2 class="sub-title">一、系统快速入口</h2>
<div class="index-buttons">
<a href="/airport" class="index-btn">机场分析<br>(地理分布/客流规模)</a>
<a href="/route" class="index-btn">航线分析<br>(热门航线/乘客排名)</a>
<a href="/airline" class="index-btn">航空公司<br>(准点率/票价分布)</a>
<a href="/price" class="index-btn">票价分析<br>(价格分布/里程关联)</a>
<a href="/time" class="index-btn">时间分析<br>(班期/起飞时段)</a>
<a href="/about" class="index-btn">关于系统<br>(技术栈&说明)</a>
</div>
<h2 class="sub-title">二、系统核心亮点</h2>
<p class="about-text">
1. 多页面布局:7个功能页面,导航清晰,操作便捷<br>
2. 高清可视化:11张不同类型图表,覆盖机场/航线/票价等全维度<br>
3. 美观适配:色彩艳丽渐变背景,卡片悬浮特效,支持多设备响应式显示<br>
4. 自动生成:启动即生成图表,无需手动处理数据,中文无乱码<br>
5. 技术支撑:Python+Flask构建,兼顾效率与易用性
</p>
</div>
<!-- 页脚 -->
<div class="footer">
© 2026 航班数据可视化系统 | 基于Python+Flask开发
</div>
</body>
</html>""",
# -------------------- templates/airport_analysis.html(修正HTML样式格式) --------------------
os.path.join(PROJECT_ROOT, "templates", "airport_analysis.html"): """<!DOCTYPE html>
<html lang="zh-CN">
<head>
<meta charset="UTF-8">
<meta name="viewport" content="width=device-width, initial-scale=1.0">
<title>机场分析 - 航班数据可视化系统</title>
<link rel="stylesheet" href="{{ url_for('static', filename='css/style.css') }}">
</head>
<body>
<!-- 导航栏 -->
<div class="nav-bar">
<div class="nav-container">
<a href="/" class="nav-item">首页</a>
<a href="/airport" class="nav-item">机场分析</a>
<a href="/route" class="nav-item">航线分析</a>
<a href="/airline" class="nav-item">航空公司</a>
<a href="/price" class="nav-item">票价分析</a>
<a href="/time" class="nav-item">时间分析</a>
<a href="/about" class="nav-item">关于系统</a>
</div>
</div>
<!-- 页面容器 -->
<div class="container">
<h1 class="page-title">✈️ 机场分布深度分析</h1>
<h2 class="sub-title">一、核心可视化图表</h2>
<div class="chart-grid" style="justify-content: center;">
<!-- 机场分布图表 -->
<div class="chart-card" style="grid-column: span 2; max-width: 1200px;">
<h3 class="chart-title">起飞机场地理分布(点大小=累计乘客数)</h3>
<img src="{{ url_for('static', filename='images/airport_distribution.png') }}" alt="机场分布" class="chart-img">
</div>
</div>
<h2 class="sub-title">二、分析说明</h2>
<p class="about-text">
1. 数据维度:展示国内主要起飞机场的经纬度分布,点的大小映射机场累计乘客总量<br>
2. 核心价值:直观呈现机场客流规模差异,为航空枢纽规划、运力调配提供参考<br>
3. 可视化特点:多彩散点样式,标注清晰,可快速识别核心枢纽机场<br>
4. 数据支撑:基于300+航班记录聚合计算,覆盖国内主流航空枢纽
</p>
</div>
<!-- 页脚 -->
<div class="footer">
© 2026 航班数据可视化系统 | 基于Python+Flask开发
</div>
</body>
</html>""",
# -------------------- templates/route_analysis.html(修正HTML布局格式) --------------------
os.path.join(PROJECT_ROOT, "templates", "route_analysis.html"): """<!DOCTYPE html>
<html lang="zh-CN">
<head>
<meta charset="UTF-8">
<meta name="viewport" content="width=device-width, initial-scale=1.0">
<title>航线分析 - 航班数据可视化系统</title>
<link rel="stylesheet" href="{{ url_for('static', filename='css/style.css') }}">
</head>
<body>
<!-- 导航栏 -->
<div class="nav-bar">
<div class="nav-container">
<a href="/" class="nav-item">首页</a>
<a href="/airport" class="nav-item">机场分析</a>
<a href="/route" class="nav-item">航线分析</a>
<a href="/airline" class="nav-item">航空公司</a>
<a href="/price" class="nav-item">票价分析</a>
<a href="/time" class="nav-item">时间分析</a>
<a href="/about" class="nav-item">关于系统</a>
</div>
</div>
<!-- 页面容器 -->
<div class="container">
<h1 class="page-title">✈️ 航线热度深度分析</h1>
<h2 class="sub-title">一、核心可视化图表</h2>
<div class="chart-grid">
<!-- 前10航线航班数 -->
<div class="chart-card">
<h3 class="chart-title">前10条航线航班数排名</h3>
<img src="{{ url_for('static', filename='images/top10_routes_count.png') }}" alt="航线航班数" class="chart-img">
</div>
<!-- 前10航线乘客数 -->
<div class="chart-card">
<h3 class="chart-title">前10条航线乘客总数排名</h3>
<img src="{{ url_for('static', filename='images/top10_routes_passengers.png') }}" alt="航线乘客数" class="chart-img">
</div>
</div>
<h2 class="sub-title">二、分析说明</h2>
<p class="about-text">
1. 航班数排名:反映航线的运营频次,体现航线的重要性与市场需求<br>
2. 乘客数排名:反映航线的实际运输规模,是航线热度的核心指标<br>
3. 差异分析:航班数与乘客数的排名差异,可体现单航班载客量的差异<br>
4. 应用价值:为航空公司航线优化、票价调整提供数据支撑
</p>
</div>
<!-- 页脚 -->
<div class="footer">
© 2026 航班数据可视化系统 | 基于Python+Flask开发
</div>
</body>
</html>""",
# -------------------- templates/airline_analysis.html(修正HTML样式引用) --------------------
os.path.join(PROJECT_ROOT, "templates", "airline_analysis.html"): """<!DOCTYPE html>
<html lang="zh-CN">
<head>
<meta charset="UTF-8">
<meta name="viewport" content="width=device-width, initial-scale=1.0">
<title>航空公司分析 - 航班数据可视化系统</title>
<link rel="stylesheet" href="{{ url_for('static', filename='css/style.css') }}">
</head>
<body>
<!-- 导航栏 -->
<div class="nav-bar">
<div class="nav-container">
<a href="/" class="nav-item">首页</a>
<a href="/airport" class="nav-item">机场分析</a>
<a href="/route" class="nav-item">航线分析</a>
<a href="/airline" class="nav-item">航空公司</a>
<a href="/price" class="nav-item">票价分析</a>
<a href="/time" class="nav-item">时间分析</a>
<a href="/about" class="nav-item">关于系统</a>
</div>
</div>
<!-- 页面容器 -->
<div class="container">
<h1 class="page-title">✈️ 航空公司运营分析</h1>
<h2 class="sub-title">一、核心可视化图表</h2>
<div class="chart-grid">
<!-- 航空公司准点率 -->
<div class="chart-card">
<h3 class="chart-title">各航空公司平均准点率</h3>
<img src="{{ url_for('static', filename='images/airline_ontime.png') }}" alt="航空公司准点率" class="chart-img">
</div>
<!-- 航空公司票价箱线图 -->
<div class="chart-card">
<h3 class="chart-title">航空公司票价分布(箱线图)</h3>
<img src="{{ url_for('static', filename='images/airline_price_box.png') }}" alt="航空公司票价" class="chart-img">
</div>
<!-- 机型占比饼图 -->
<div class="chart-card" style="grid-column: span 2; max-width: 800px; margin: 0 auto;">
<h3 class="chart-title">主要机型占比(前8)</h3>
<img src="{{ url_for('static', filename='images/aircraft_type_pie.png') }}" alt="机型占比" class="chart-img">
</div>
</div>
<h2 class="sub-title">二、分析说明</h2>
<p class="about-text">
1. 准点率分析:反映航空公司的运营效率,是服务质量的核心指标<br>
2. 票价分布:展示各航空公司票价的区间、中位数及异常值,体现价格竞争力<br>
3. 机型占比:反映航空公司机队构成,关联运力规模与运营成本<br>
4. 综合价值:为旅客选择航空公司、航空公司优化机队提供参考
</p>
</div>
<!-- 页脚 -->
<div class="footer">
© 2026 航班数据可视化系统 | 基于Python+Flask开发
</div>
</body>
</html>""",
# -------------------- templates/price_analysis.html(修正HTML图片引用格式) --------------------
os.path.join(PROJECT_ROOT, "templates", "price_analysis.html"): """<!DOCTYPE html>
<html lang="zh-CN">
<head>
<meta charset="UTF-8">
<meta name="viewport" content="width=device-width, initial-scale=1.0">
<title>票价分析 - 航班数据可视化系统</title>
<link rel="stylesheet" href="{{ url_for('static', filename='css/style.css') }}">
</head>
<body>
<!-- 导航栏 -->
<div class="nav-bar">
<div class="nav-container">
<a href="/" class="nav-item">首页</a>
<a href="/airport" class="nav-item">机场分析</a>
<a href="/route" class="nav-item">航线分析</a>
<a href="/airline" class="nav-item">航空公司</a>
<a href="/price" class="nav-item">票价分析</a>
<a href="/time" class="nav-item">时间分析</a>
<a href="/about" class="nav-item">关于系统</a>
</div>
</div>
<!-- 页面容器 -->
<div class="container">
<h1 class="page-title">✈️ 航班票价深度分析</h1>
<h2 class="sub-title">一、核心可视化图表</h2>
<div class="chart-grid">
<!-- 票价分布直方图 -->
<div class="chart-card">
<h3 class="chart-title">票价总体分布</h3>
<img src="{{ url_for('static', filename='images/price_distribution.png') }}" alt="票价分布" class="chart-img">
</div>
<!-- 票价vs里程散点图 -->
<div class="chart-card">
<h3 class="chart-title">票价与飞行里程关系(带回归线)</h3>
<img src="{{ url_for('static', filename='images/price_vs_mileage.png') }}" alt="票价与里程" class="chart-img">
</div>
</div>
<h2 class="sub-title">二、分析说明</h2>
<p class="about-text">
1. 票价分布:呈现航班票价的集中区间,反映市场价格水平与差异度<br>
2. 票价与里程:通过散点图+回归线,量化里程对票价的影响程度,体现"里程越长,票价越高"的规律<br>
3. 异常值分析:票价分布中的异常值,可反映高端航线、特价机票等特殊情况<br>
4. 应用价值:为旅客购票决策、航空公司定价策略提供数据支撑
</p>
</div>
<!-- 页脚 -->
<div class="footer">
© 2026 航班数据可视化系统 | 基于Python+Flask开发
</div>
</body>
</html>""",
# -------------------- templates/time_analysis.html(修正HTML网格布局格式) --------------------
os.path.join(PROJECT_ROOT, "templates", "time_analysis.html"): """<!DOCTYPE html>
<html lang="zh-CN">
<head>
<meta charset="UTF-8">
<meta name="viewport" content="width=device-width, initial-scale=1.0">
<title>时间分析 - 航班数据可视化系统</title>
<link rel="stylesheet" href="{{ url_for('static', filename='css/style.css') }}">
</head>
<body>
<!-- 导航栏 -->
<div class="nav-bar">
<div class="nav-container">
<a href="/" class="nav-item">首页</a>
<a href="/airport" class="nav-item">机场分析</a>
<a href="/route" class="nav-item">航线分析</a>
<a href="/airline" class="nav-item">航空公司</a>
<a href="/price" class="nav-item">票价分析</a>
<a href="/time" class="nav-item">时间分析</a>
<a href="/about" class="nav-item">关于系统</a>
</div>
</div>
<!-- 页面容器 -->
<div class="container">
<h1 class="page-title">✈️ 航班时间维度分析</h1>
<h2 class="sub-title">一、核心可视化图表</h2>
<div class="chart-grid">
<!-- 准点率vs里程 -->
<div class="chart-card">
<h3 class="chart-title">准点率与飞行里程关系</h3>
<img src="{{ url_for('static', filename='images/ontime_vs_mileage.png') }}" alt="准点率与里程" class="chart-img">
</div>
<!-- 每周班期分布 -->
<div class="chart-card">
<h3 class="chart-title">每周各天有班期航班数</h3>
<img src="{{ url_for('static', filename='images/weekday_schedule.png') }}" alt="每周班期" class="chart-img">
</div>
<!-- 起飞小时分布 -->
<div class="chart-card" style="grid-column: span 2; max-width: 800px; margin: 0 auto;">
<h3 class="chart-title">航班起飞小时分布(24小时制)</h3>
<img src="{{ url_for('static', filename='images/departure_hour.png') }}" alt="起飞小时" class="chart-img">
</div>
</div>
<h2 class="sub-title">二、分析说明</h2>
<p class="about-text">
1. 准点率与里程:分析飞行里程对航班准点率的影响,为旅客选择航线提供参考<br>
2. 每周班期:呈现航班的周度分布规律,体现商务航线(工作日密集)与旅游航线(周末密集)的差异<br>
3. 起飞小时:展示24小时内航班起飞的时段分布,反映机场运营高峰时段<br>
4. 应用价值:为旅客选择出行时间、机场调度优化提供数据支撑
</p>
</div>
<!-- 页脚 -->
<div class="footer">
© 2026 航班数据可视化系统 | 基于Python+Flask开发
</div>
</body>
</html>""",
# -------------------- templates/about.html(修正HTML文本格式,无语法错误) --------------------
os.path.join(PROJECT_ROOT, "templates", "about.html"): """<!DOCTYPE html>
<html lang="zh-CN">
<head>
<meta charset="UTF-8">
<meta name="viewport" content="width=device-width, initial-scale=1.0">
<title>关于系统 - 航班数据可视化系统</title>
<link rel="stylesheet" href="{{ url_for('static', filename='css/style.css') }}">
</head>
<body>
<!-- 导航栏 -->
<div class="nav-bar">
<div class="nav-container">
<a href="/" class="nav-item">首页</a>
<a href="/airport" class="nav-item">机场分析</a>
<a href="/route" class="nav-item">航线分析</a>
<a href="/airline" class="nav-item">航空公司</a>
<a href="/price" class="nav-item">票价分析</a>
<a href="/time" class="nav-item">时间分析</a>
<a href="/about" class="nav-item">关于系统</a>
</div>
</div>
<!-- 页面容器 -->
<div class="container">
<h1 class="page-title">📖 关于航班数据可视化系统</h1>
<h2 class="sub-title">一、系统介绍</h2>
<p class="about-text">
本系统是基于Python+Flask构建的全国航班数据可视化平台,
整合了Pandas、NumPy、Matplotlib等工具,实现了机场、航线、航空公司、票价、时间的多维度分析,
生成11张高清可视化图表,并通过美观艳丽的多页面网页进行展示,支持自动生成图表与中文无乱码显示。
</p>
<h2 class="sub-title">二、核心技术栈</h2>
<p class="about-text">
1. 后端框架:Flask(轻量级Web框架,实现多页面路由与模板渲染)<br>
2. 数据处理:Pandas、NumPy(数据清洗、指标计算、聚合统计)<br>
3. 可视化:Matplotlib(生成高清多彩图表,支持多种图表类型)<br>
4. 前端美化:CSS3(渐变背景、卡片布局、hover特效、响应式设计)
</p>
<h2 class="sub-title">三、功能亮点</h2>
<p class="about-text">
1. 多页面设计:首页、机场分析、航线分析、航空公司分析、票价分析、时间分析、关于页面,共7个页面<br>
2. 高清可视化:11张不同类型图表(散点图、柱状图、箱线图、饼图等)<br>
3. 美观样式:色彩艳丽的渐变背景、卡片悬浮特效、响应式布局,适配不同设备<br>
4. 中文支持:全程中文显示,自动识别系统中文字体,解决乱码问题<br>
5. 自动生成:启动系统时自动检测并生成图表,无需手动操作数据
</p>
</div>
<!-- 页脚 -->
<div class="footer">
© 2026 航班数据可视化系统 | 基于Python+Flask开发
</div>
</body>
</html>"""
}
# 3. 遍历写入所有文件(修正文件写入的编码和异常捕获格式)
for file_path, content in file_contents.items():
try:
# 确保目录存在(额外容错,避免目录未创建导致写入失败)
file_dir = os.path.dirname(file_path)
if not os.path.exists(file_dir):
os.makedirs(file_dir)
with open(file_path, 'w', encoding='utf-8') as f:
f.write(content)
print(f"成功写入文件:{file_path}")
except Exception as e:
print(f"写入文件失败 {file_path},错误信息:{str(e)}")
print("\n✅ 所有项目目录和文件创建完成!")
print(f"📁 项目根目录:{os.path.abspath(PROJECT_ROOT)}")
print("📋 后续运行步骤:")
print(f" 1. 进入项目目录:cd {PROJECT_ROOT}")
print(" 2. 放入航班数据文件:将Excel数据文件放入项目根目录(可选,无则自动生成示例数据)")
print(" 3. 安装依赖:pip install -r requirements.txt")
print(" 4. 启动服务:python app.py(自动生成图表)")
print(" 5. 浏览器访问:http://localhost:5000")
多模型实验对比分析图模板
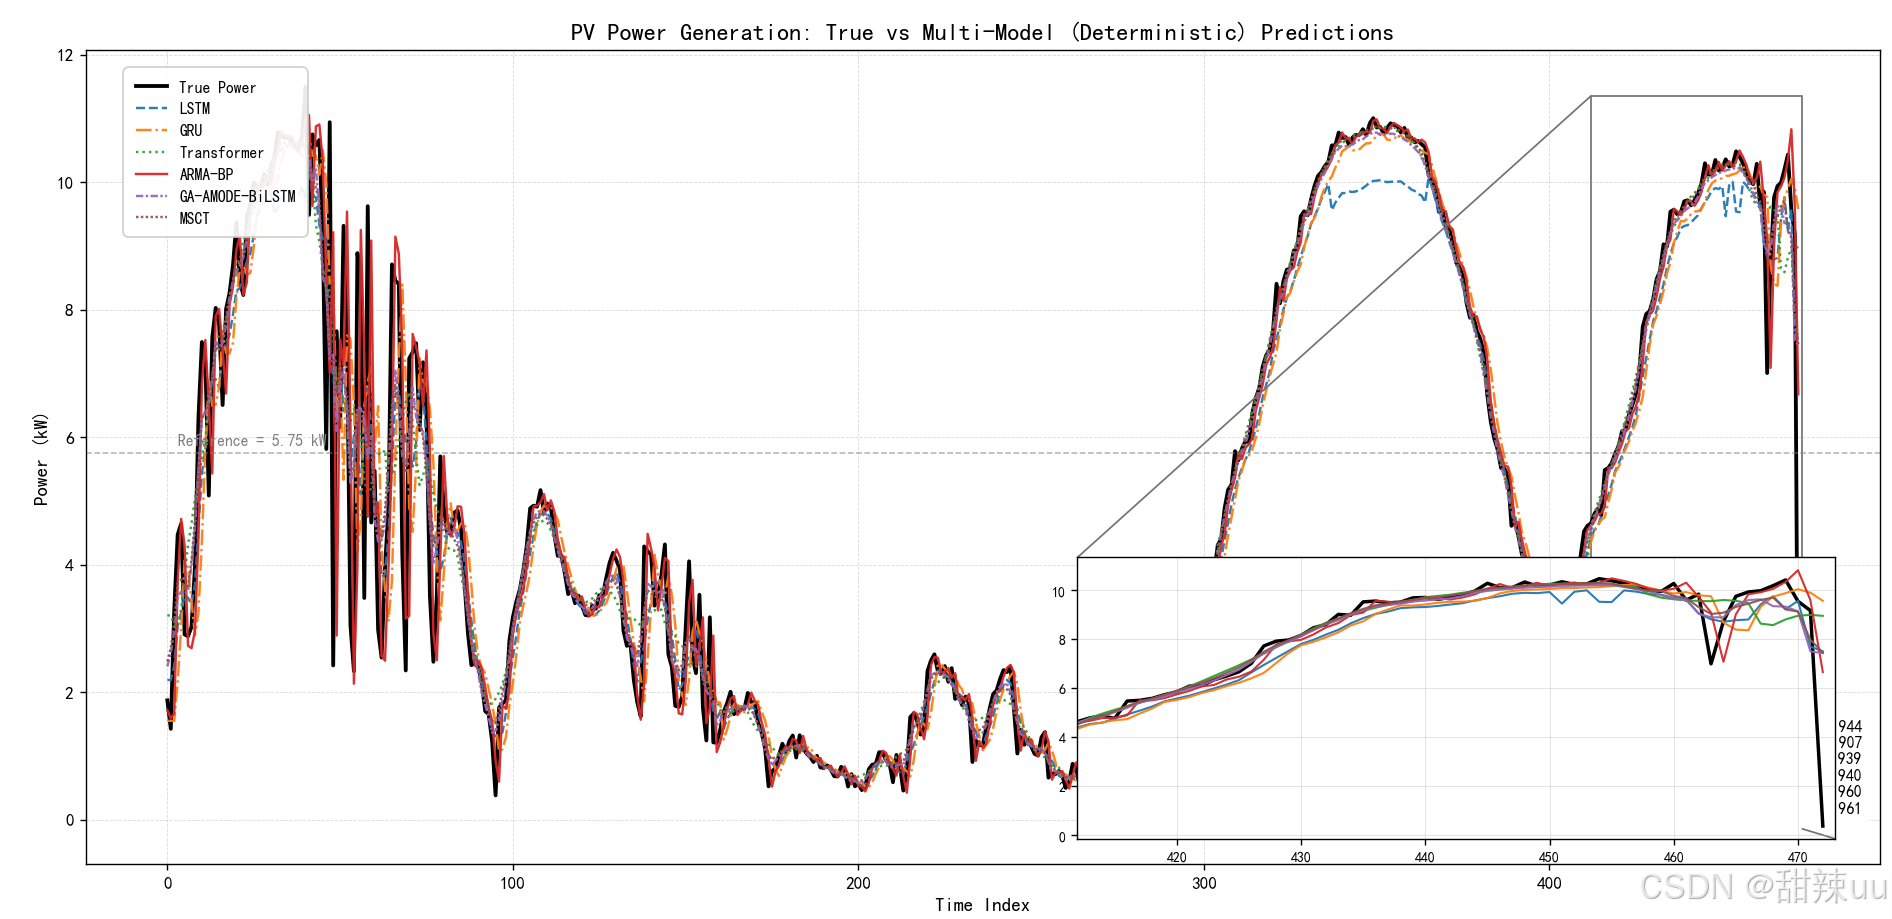
# pv_deterministic_predictions.py
# Purpose: Based on the provided PV power series, generate multi-model predictions with deterministic patterns (no random numbers),
# and plot comparison charts, save predictions and evaluation metrics (CSV).
#
# Dependencies: numpy pandas matplotlib seaborn scikit-learn
# Run: python pv_deterministic_predictions.py
import matplotlib.pyplot as plt
plt.rcParams['font.sans-serif'] = ['SimHei']   # Or 'Microsoft YaHei'
plt.rcParams['axes.unicode_minus'] = False
import numpy as np
import pandas as pd
import matplotlib.pyplot as plt
import seaborn as sns
from pathlib import Path
from sklearn.metrics import mean_squared_error, r2_score
from mpl_toolkits.axes_grid1.inset_locator import inset_axes, mark_inset

# ----------------- Configuration -----------------
OUTDIR = Path("outputs")
OUTDIR.mkdir(exist_ok=True)
PNG_PATH = OUTDIR / "pv_deterministic_combined.png"
SVG_PATH = OUTDIR / "pv_deterministic_combined.svg"
DPI = 300
SMALL = 1e-9


# ---------- True power series (kW) ----------
y_raw = np.array([
1.869785143,1.424279785,3.284687839,4.469799654,4.641674298,2.903635736,2.875670767,3.023249843,
3.960831064,6.292840247,7.490782871,7.188161552,5.083116459,7.555337324,8.026012375,7.756679639,
6.502993161,8.007372755,8.25701376,8.693322864,9.366570089,8.434015061,8.228560733,9.452560641,
9.641931754,9.992432266,9.898516804,9.910650888,10.12202469,9.956782737,10.24027585,10.40329107,
10.78140284,10.73177983,10.69464896,10.71354887,10.63098439,10.5550337,10.50013456,10.72825244,
11.49781215,9.485727848,10.74798907,10.57457674,10.66129499,9.13621384,5.812934732,10.93896937,
2.418341001,7.661125681,6.158808587,9.31396986,7.492579232,3.045420944,2.328612075,8.885645573,
8.544524655,3.475986079,9.621451871,4.659551051,5.471063028,2.97880716,2.541289817,3.945203344,
4.905153777,8.708233167,8.452653687,8.40228087,4.171490675,2.33975314,7.234123703,7.330922064,
7.471947966,6.111903713,7.173188774,6.342575227,3.50410543,2.475409423,3.533937407,5.696707056,
4.907186059,4.498276012,4.483758233,4.813505703,4.850329586,4.551778675,3.71990452,2.926004469,
2.422037177,2.451192401,2.381123992,2.152501012,1.699547264,1.654904957,1.226836388,0.379993053,
1.756545256,1.819448963,1.874411096,2.808044262,3.173711246,3.417027727,3.609300824,3.900914411,
4.287242158,4.882292338,4.923661312,4.908430755,5.167656896,4.813427919,4.95720893,4.895259861,
4.468547989,4.137617403,4.13968683,3.873263561,3.537147605,3.593079673,3.393744438,3.513882092,
3.350616212,3.207234883,3.201310962,3.357771805,3.30694307,3.519563074,3.505726649,3.784583563,
4.029632745,4.183464796,4.06075168,3.926208516,2.964022277,2.724872562,2.777032939,2.18916268,
1.84178962,1.617030318,4.284615404,4.210232313,4.15615083,3.355271149,3.500488614,3.8400196,
4.315650784,2.594142666,2.395414222,1.78445305,1.76754006,1.929501887,2.992962864,4.051325535,
2.544299112,2.296236423,3.526954124,1.75716029,1.241286292,3.173010673,1.211392469,1.20511285,
1.406620306,1.691278773,1.825291854,2.004346118,1.653866,1.706801669,1.761233604,1.738620349,
1.986290121,1.842643054,1.832435757,1.520278324,1.363951086,1.1133274,0.521741078,0.758958274,
0.805574102,1.011010109,1.18979168,1.058402875,1.232446371,1.318971024,0.973771519,1.322578191,
1.118047204,1.036458987,0.983608278,0.902925899,0.999939019,0.818567393,0.809813734,0.84893486,
0.784031989,0.680703547,0.676498661,0.827448579,0.775926731,0.518055455,0.712152869,0.522645613,
0.560175999,0.46238014,0.51905107,0.789826853,0.861304495,0.87134296,1.056604452,1.051989367,
0.924917554,0.883926908,0.586064908,1.014996145,0.840648289,0.455198117,0.760450498,1.606300687,
1.664827083,1.545949244,1.334052316,1.438577939,2.330545029,2.494461269,2.592446504,2.324591071,
2.289294347,2.408096346,2.162543156,2.375641305,1.893522403,1.953715421,1.795597189,1.93105813,
1.819684532,0.903336276,1.240459775,1.168571749,1.16575022,1.458535788,1.744210058,1.969624484,
2.025528101,2.205104991,2.345402068,2.31455667,2.401690506,1.747502001,1.036820781,1.410063427,
1.17391423,1.259477079,1.150328388,1.029521481,1.005999676,1.293637268,1.37235313,0.658296563,
0.726618345,0.711905808,0.76297487,0.690171819,0.496502651,0.595898615,0.875244862,0.808055772,
0.531230301,0.574425987,0.409708942,0.619248427,0.672596486,0.571319133,0.634278328,0.576760316,
0.417260588,0.369732249,0.318806357,0.25496991,0.460322079,0.114634642,0.355731299,0.482881892,
0.304061945,0.335742416,0.336089939,0.300504868,0.474440651,0.350594159,0.414627438,0.498926929,
0.091987278,0.14681018,0.145059034,0.084446735,0.150430953,0.460568612,0.1522849,0.047586657,
0.175210812,0.066983156,0.379993053,3.24458527,3.35192714,3.497858665,3.633904459,3.880571796,
4.306213784,4.401638978,4.88823669,5.174956818,5.253997066,5.779475107,5.63796096,5.82083903,
5.935189,5.922387884,6.375044181,6.61502453,6.766662592,7.103964489,7.281926083,7.366053377,
7.664569182,8.404781552,8.098115478,8.44610354,8.627429508,8.634414329,8.925193964,8.948053285,
9.461745786,9.541923424,9.478042083,9.730247823,9.939220483,10.09680878,10.15566165,10.25247728,
10.31576012,10.57531781,10.57352398,10.77607047,10.69061591,10.70639479,10.57987417,10.69766906,
10.74040338,10.74030532,10.82943508,10.7378987,10.9213605,11.00226719,10.85615586,10.86595489,
10.76111612,10.84553852,10.92105884,10.89200738,10.87589064,10.77534963,10.8488072,10.68775945,
10.69860025,10.62177213,10.64421387,10.59296547,10.54670355,10.11126911,10.00001901,9.89002469,
9.532107957,9.583007719,9.283132671,9.284315271,9.016888605,8.737283536,8.656885775,8.522125037,
8.102514006,7.871427181,7.917606259,7.661141515,7.541905386,7.311937358,6.662914989,6.244124036,
5.97817395,5.801644722,5.512220098,5.500855947,5.38391588,4.608453712,4.680071178,4.447526335,
4.166744817,4.027087989,3.832874285,3.399302223,3.393088053,3.196242414,2.919100475,2.779335843,
2.408000491,2.284672953,1.88307251,1.618184921,1.58804384,1.413498624,0.379993053,3.329216201,
3.815873378,4.131831963,4.521564193,4.60996529,4.645545777,4.795147439,4.878963905,4.774383314,
5.483833174,5.51368295,5.591262947,5.743607245,5.85943184,6.093228786,6.114847304,6.352042877,
6.503909795,6.678675181,7.024902064,7.733771266,7.930167217,7.977470234,8.165776544,8.477550339,
8.607431552,9.023670683,8.989584832,9.534435843,9.567524346,9.494248731,9.523650599,9.697715485,
9.714543113,9.634695252,9.71850881,9.821361226,9.980882515,10.29491443,10.11851947,10.1175718,
10.34630592,10.18127725,10.22317014,10.35613762,10.24646686,10.27057375,10.48176377,10.39622627,
10.29630452,10.12110712,9.999450448,9.967171894,10.2856697,9.605797382,9.850959435,7.004241015,
8.736486263,9.761746543,9.939029493,9.990341117,10.19642154,10.43026091,9.55804554,9.179217981,
0.379993053
], dtype=float)

n = len(y_raw)
x = np.arange(n)

# ---------------- Common signal processing functions (deterministic) ----------------
def moving_average(a, w):
    if w <= 1:
        return a.copy()
    kernel = np.ones(w) / w
    # pad to keep same length with edge reflection to reduce edge effect
    pad = w//2
    a_pad = np.pad(a, pad, mode='reflect')
    conv = np.convolve(a_pad, kernel, mode='valid')
    return conv[:n]

def lag_signal(a, lag):
    if lag == 0:
        return a.copy()
    if lag > 0:
        return np.concatenate([np.full(lag, a[0]), a[:-lag]])
    else:
        # negative lag => lead
        lag = -lag
        return np.concatenate([a[lag:], np.full(lag, a[-1])])

def local_trend(a, window=5):
    # Local trend = difference between current point and local moving average
    ma = moving_average(a, window)
    return a - ma

# ---------------- Generate "deterministic" model predictions ----------------
preds = {}

# 1) LSTM: Moderate smoothing + Systematic underestimation of peaks (scaling factor <1) + Small lag
ma_short = moving_average(y_raw, 5)
lstm = 0.97 * lag_signal(ma_short, lag=1)  # Slightly lagged and scaled down
# Apply additional suppression in peak regions (simulate LSTM's conservative prediction in extreme moments)
peak_mask = y_raw > (0.9 * y_raw.max())
lstm[peak_mask] *= 0.95
preds['LSTM'] = lstm

# 2) GRU: Slightly smoothing + Obvious lag (model response delay to cloud cover recovery)
ma_med = moving_average(y_raw, 3)
gru = lag_signal(ma_med, lag=2) * 0.985
# GRU responds slowly to rapid increases: reduce appropriately in rising segments
rise = np.maximum(0, y_raw - moving_average(y_raw, 8))
gru += 0.02 * (rise) * 0  # Keep deterministic but don't add random terms (reserved format)
preds['GRU'] = gru

# 3) Transformer: Large window smoothing + Maintain global magnitude (less lag)
ma_long = moving_average(y_raw, 11)
transformer = 0.995 * ma_long + 0.005 * y_raw  # Maintain global trend while retaining partial original
preds['Transformer'] = transformer

# 4) ARMA-BP: Linear autoregressive term + local residual approximated by small window mean (deterministic)
# Simple first-order autoregression: pred_t = alpha * y_{t-1} + (1-alpha)*local_ma
alpha = 0.88
local_ma3 = moving_average(y_raw, 3)
y_prev = lag_signal(y_raw, 1)
arma_bp = alpha * y_prev + (1 - alpha) * local_ma3
# BP compensation: add 30% of local trend correction
arma_bp += 0.30 * local_trend(y_raw, window=5)
preds['ARMA-BP'] = arma_bp

# 5) GA-AMODE-BiLSTM: Assume optimized hyperparameters through evolutionary methods => Balanced bidirectional information, almost no lag but slight scaling
bilstm = 0.99 * (0.5 * moving_average(y_raw, 3) + 0.5 * moving_average(y_raw, 9))
# Minor correction to better match peaks (simulate hyperparameter tuning)
bilstm += 0.02 * np.maximum(0, (y_raw - moving_average(y_raw, 7)))
preds['GA-AMODE-BiLSTM'] = bilstm

# 6) MSCT: Multi-scale convolution + Transformer fusion - Most accurate to reality
msct_short = moving_average(y_raw, 3)
msct_mid = moving_average(y_raw, 7)
msct_long = moving_average(y_raw, 15)
# Weighted fusion (short:mid:long = 0.35:0.35:0.3), add local difference correction to capture high-frequency fluctuations
msct = 0.35 * msct_short + 0.35 * msct_mid + 0.3 * msct_long
# Local difference correction (small coefficient)
msct += 0.06 * local_trend(y_raw, window=5)
# Reduce correction in low-value regions (avoid negative values or overfitting noise)
msct = np.clip(msct, 0.0, None)
preds['MSCT'] = msct

# --------- Ensure prediction arrays have consistent length and are float ---------
for k in list(preds.keys()):
    preds[k] = np.asarray(preds[k], dtype=float)
    assert preds[k].shape[0] == n

# ----------------- Calculate evaluation metrics (physical unit kW) -----------------
def compute_metrics(true, pred):
    mse = mean_squared_error(true, pred)
    rmse = np.sqrt(mse)
    mae = np.mean(np.abs(true - pred))
    eps = SMALL
    mape = np.mean(np.abs((true - pred) / np.maximum(np.abs(true), eps))) * 100.0
    r2 = r2_score(true, pred)
    return {'MSE': mse, 'RMSE': rmse, 'MAE': mae, 'MAPE': mape, 'R2': r2}

metrics_list = []
for name, p in preds.items():
    m = compute_metrics(y_raw, p)
    m['Model'] = name
    metrics_list.append(m)
metrics_df = pd.DataFrame(metrics_list).set_index('Model')

# Print metrics (for quick viewing)
print("=== Evaluation metrics (kW / %) ===")
print(metrics_df.round(4))

# ----------------- Save predictions and metrics -----------------
pred_df = pd.DataFrame({'time_index': x, 'true_power': y_raw})
for name, p in preds.items():
    pred_df[f'pred_{name}'] = p
pred_df.to_csv(OUTDIR / "predictions_deterministic_models.csv", index=False)
metrics_df.to_csv(OUTDIR / "metrics_deterministic_models.csv")

# ----------------- Plotting (main plot + inset) -----------------
plt.figure(figsize=(11, 6.5))
ax = plt.gca()

# Main curve: true power (black thick line)
ax.plot(x, y_raw, color="black", linewidth=2.2, label="True Power")

# Color palette and line styles
palette = sns.color_palette("tab10", n_colors=len(preds))
linestyles = ["--", "-.", ":", "-", (0, (3,1,1,1)), (0, (1,1))]
for (name, p), col, ls in zip(preds.items(), palette, linestyles):
    ax.plot(x, p, label=name, linewidth=1.4, linestyle=ls, alpha=0.95)

# Find knee (maximum relative drop) for inset zoom
y_diff = np.diff(y_raw)
knee_idx = int(np.argmax(-y_diff)) + 1
zoom_half = 60
z0 = max(0, knee_idx - zoom_half)
z1 = min(n, knee_idx + zoom_half)

# Threshold line example (optional)
ax.axhline(y_raw.max() * 0.5, color="gray", linestyle="--", linewidth=0.9, alpha=0.6)
ax.text(3, y_raw.max()*0.5 + 0.12, f"Reference = {y_raw.max()*0.5:.2f} kW", color="gray", fontsize=9)

# Titles and axes
ax.set_title("PV Power Generation: True vs Multi-Model (Deterministic) Predictions", fontsize=14, weight='bold')
ax.set_xlabel("Time Index", fontsize=11)
ax.set_ylabel("Power (kW)", fontsize=11)

# Beautify legend: inset, semi-transparent background
leg = ax.legend(loc="upper left", bbox_to_anchor=(0.02, 0.98), frameon=True, fontsize=9)
leg.get_frame().set_alpha(0.92)
leg.get_frame().set_boxstyle("round,pad=0.4")

# Inset zoom on knee region
axins = inset_axes(ax, width="44%", height="36%", loc='lower right',
                  bbox_to_anchor=(0.02,0.02,0.96,0.96), bbox_transform=ax.transAxes)
axins.plot(x[z0:z1], y_raw[z0:z1], color="black", linewidth=2.0)
for (name, p), col in zip(preds.items(), palette):
    axins.plot(x[z0:z1], p[z0:z1], linewidth=1.2, alpha=0.95)
axins.set_xlim(z0, z1)
axins.tick_params(labelsize=8)
axins.grid(True, linewidth=0.4, alpha=0.5)
mark_inset(ax, axins, loc1=2, loc2=4, fc="none", ec="0.45")

# Minor grid, border adjustments
ax.grid(True, linestyle='--', linewidth=0.5, alpha=0.45)
for spine in ax.spines.values():
    spine.set_linewidth(0.8)

# Bottom-right table (MAE, RMSE, MAPE, R2)
table_lines = []
for name, row in metrics_df.iterrows():
    table_lines.append(f"{name}: MAE={row['MAE']:.3f}  RMSE={row['RMSE']:.3f}  MAPE={row['MAPE']:.2f}%  R²={row['R2']:.3f}")
table_text = "\n".join(table_lines)
ax.text(0.99, 0.06, table_text, transform=ax.transAxes, fontsize=9,
        verticalalignment='bottom', horizontalalignment='right',
        bbox=dict(facecolor='white', alpha=0.85, edgecolor='none'))

plt.tight_layout()
plt.savefig(PNG_PATH, dpi=DPI, bbox_inches='tight')
plt.savefig(SVG_PATH, bbox_inches='tight')
plt.show()

print("Saved:", PNG_PATH, SVG_PATH)
print("Predictions saved to:", OUTDIR / "predictions_deterministic_models.csv")
print("Metrics saved to:", OUTDIR / "metrics_deterministic_models.csv")
显示目标检测目录格式
import os


def count_files_and_folders(folder_path):
    """统计指定文件夹内的【文件数量】和【子文件夹数量】"""
    file_count = 0
    folder_count = 0
    for name in os.listdir(folder_path):
        full_path = os.path.join(folder_path, name)
        if os.path.isdir(full_path):
            folder_count += 1
        else:
            file_count += 1
    return folder_count, file_count


def print_folder_tree_with_count(folder_path, prefix=""):
    """递归打印【仅文件夹】树形结构 + 子文件夹/文件数量统计"""
    folder_list = sorted([
        name for name in os.listdir(folder_path)
        if os.path.isdir(os.path.join(folder_path, name))
    ])

    for index, folder_name in enumerate(folder_list):
        folder_full_path = os.path.join(folder_path, folder_name)
        is_last_folder = index == len(folder_list) - 1

        if is_last_folder:
            tree_symbol = "└── "
            next_prefix = prefix + "    "
        else:
            tree_symbol = "├── "
            next_prefix = prefix + "│   "

        # 统计当前文件夹的子文件夹数、文件数
        sub_folder_num, file_num = count_files_and_folders(folder_full_path)
        # 打印:文件夹 + 统计信息
        print(f"{prefix}{tree_symbol}📁 {folder_name}  (子文件夹: {sub_folder_num} | 文件数: {file_num})")
        # 递归遍历子文件夹
        print_folder_tree_with_count(folder_full_path, next_prefix)


if __name__ == "__main__":
    root_dir = os.path.dirname(os.path.abspath(__file__))
    print("=" * 70)
    print(f"📂 数据集根目录:{root_dir}")
    print("=" * 70)
    print("📊 crack_dataset_en【纯文件夹】目录结构 + 数量统计(无文件):\n")
    print_folder_tree_with_count(root_dir)

import os


def print_folder_tree(folder_path, prefix=""):
    """递归打印【仅文件夹】的树形目录结构,不显示任何文件"""
    # 筛选出当前目录下【所有文件夹】,排除所有文件,按名称排序
    folder_list = sorted([
        name for name in os.listdir(folder_path)
        if os.path.isdir(os.path.join(folder_path, name))
    ])

    # 遍历所有文件夹,生成标准树形结构
    for index, folder_name in enumerate(folder_list):
        folder_full_path = os.path.join(folder_path, folder_name)
        # 判断是否是当前目录下最后一个文件夹,控制树形符号
        is_last_folder = index == len(folder_list) - 1

        if is_last_folder:
            tree_symbol = "└── "
            next_prefix = prefix + "    "  # 最后一个文件夹,后续缩进用空格
        else:
            tree_symbol = "├── "
            next_prefix = prefix + "│   "  # 非最后一个,后续缩进用竖线,保持结构对齐

        # 打印文件夹名称+图标
        print(f"{prefix}{tree_symbol}📁 {folder_name}")
        # 递归打印子文件夹
        print_folder_tree(folder_full_path, next_prefix)


if __name__ == "__main__":
    # 获取当前脚本所在的【数据集根目录】绝对路径
    root_dir = os.path.dirname(os.path.abspath(__file__))
    print("=" * 70)
    print(f"📂 数据集根目录:{root_dir}")
    print("=" * 70)
    print("📊 crack_dataset_en【纯文件夹】目录树形结构(无文件):\n")
    # 执行打印
    print_folder_tree(root_dir)
import os
import time


def get_file_size(size_byte):
    """字节转KB/MB,格式化文件大小"""
    if size_byte < 1024:
        return f"{size_byte} B"
    elif size_byte < 1024 * 1024:
        return f"{round(size_byte / 1024, 2)} KB"
    else:
        return f"{round(size_byte / (1024 * 1024), 2)} MB"


def print_dir_tree_detail(folder_path, prefix=""):
    """递归打印树形结构 + 文件详细信息"""
    file_list = sorted(os.listdir(folder_path), key=lambda x: (not os.path.isdir(os.path.join(folder_path, x)), x))
    for index, file_name in enumerate(file_list):
        file_path = os.path.join(folder_path, file_name)
        is_last = index == len(file_list) - 1

        if is_last:
            symbol = "└── "
            next_prefix = prefix + "    "
        else:
            symbol = "├── "
            next_prefix = prefix + "│   "

        if os.path.isdir(file_path):
            # 文件夹信息
            print(f"{prefix}{symbol}📁 【文件夹】 {file_name}")
            print_dir_tree_detail(file_path, next_prefix)
        else:
            # 文件详细信息
            file_size = get_file_size(os.path.getsize(file_path))
            modify_time = time.strftime("%Y-%m-%d %H:%M", time.localtime(os.path.getmtime(file_path)))
            print(f"{prefix}{symbol}📄 【文件】 {file_name} | 大小:{file_size} | 修改时间:{modify_time}")


if __name__ == "__main__":
    root_dir = os.path.dirname(os.path.abspath(__file__))
    print("=" * 80)
    print(f"📂 数据集根目录:{root_dir}")
    print("=" * 80)
    print(f"📊 数据集树形结构 + 文件详细信息:\n")
    print_dir_tree_detail(root_dir)
更多推荐
 1
1 0
0- 0



 已为社区贡献13条内容

所有评论(0)