
R语言Tidymodels包手把手带你进行机器学习实例分析:预测糖尿病分类
糖尿病是全球主要的死亡和残疾原因之一。2型糖尿病,糖尿病占大多数病例,且大多是可以预防的,如果早期发现和管理,有时甚至有可能逆转 疾病病程。因此,诊断程序在糖尿病医疗中起着重要作用管理。为了能够可靠地预测疾病,我们首先需要了解风险因素与糖尿病之间的关联,我们使用整洁模型框架并应用不同的机器学习方法到糖尿病数据集。
咱们先导入数据和R包
library(tidyverse)
library(tidymodels)
library(themis)
library(doParallel)
library(gtsummary)
library(gt)
library(bonsai)
library(discrim)
library(finetune)
library(patchwork)
library(vip)
library(DALEXtra)
library(rsample)
setwd("E:/公众号文章2026年/Tidymodels 机器学习:糖尿病分类")
trial_data<-read.csv("trial_data.csv",sep=',',header=TRUE)
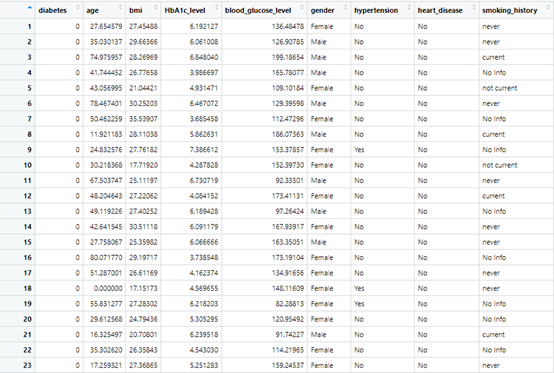
这是一个关于糖尿病的数据,diabetes是是否糖尿病,其他是协变量
把数据分为测试集和验证集
set.seed(1005)
diabetes_split <- trial_data %>%
  initial_split(prop = 0.75, strata=diabetes)
diabetes_train_df <- training(diabetes_split)
diabetes_test_df  <-  testing(diabetes_split)
看下测试集数据,生成基线表
#创建摘要统计信息
hd_tab1 <- diabetes_train_df %>%
  tbl_summary(by=diabetes,
              statistic = list(all_continuous() ~ "{mean} ({sd})",
                               all_categorical() ~ "{n} ({p}%)"),
              digits = all_continuous() ~ 2) %>%
  add_p(test=list(all_continuous() ~ "t.test",
                  all_categorical() ~ "chisq.test.no.correct")) %>%
  add_overall() %>%
  modify_spanning_header(c("stat_1", "stat_2") ~ "**diabetes**") %>%
  modify_caption("**Table 1: Descriptive Statistics Training Data**")
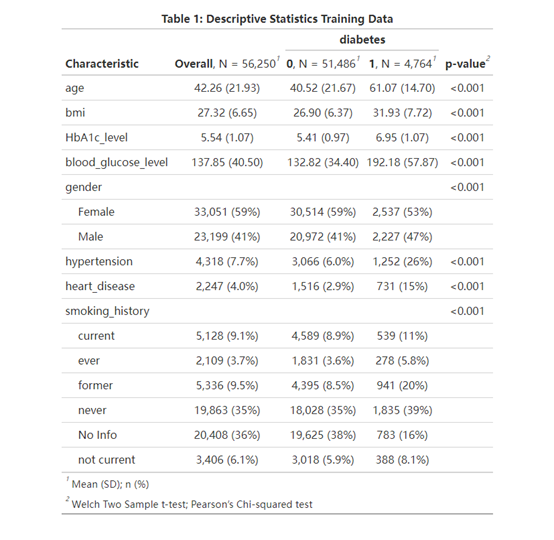
可以看到,所有变量p值<0.001,高血压,性别,高血压和心脏病等都和糖尿病相关。进行分析前,咱们先做一些数据准备
#培训前的数据准备 :
diabetes_recipe <-
  recipe(diabetes ~ ., data=diabetes_train_df) %>%
  step_normalize(all_numeric_predictors()) %>%
  step_dummy(all_nominal_predictors()) %>%
  step_zv(all_predictors()) %>%
  step_downsample(diabetes)
准备好以后,咱们开始建立模型,使用逻辑回归,XGBoost、朴素贝叶斯、支持向量机、决策树建模
# 尝试不同的ml方法:
lr_mod <- logistic_reg() %>%
  set_engine("glm") %>%
  set_mode("classification")

svm_mod <- svm_linear(cost = tune(), margin = tune()) %>%
  set_engine("kernlab") %>%
  set_mode("classification")

xgb_mod <- boost_tree(tree_depth = tune(), learn_rate = tune(), loss_reduction = tune(),
                      min_n = tune(), sample_size = tune(), trees = tune()) %>%
  set_engine("xgboost") %>%
  set_mode("classification")

nb_mod <- naive_Bayes(smoothness = tune(), Laplace = tune()) %>%
  set_engine("naivebayes") %>%
  set_mode("classification")

cit_mod <- decision_tree(tree_depth=tune(), min_n=tune()) %>%
  set_engine(engine = "partykit") %>%
  set_mode(mode = "classification")
为了管理偏差与方差权衡,咱们进行调参,模型的超参数由以下方式选择结合使用填充空间网格搜索设计进行交叉验证。我们将ROC-AUC视为我们感兴趣的评估指标。
# 准备交叉验证
set.seed(1001)
diabetes_train_folds <- vfold_cv(diabetes_train_df, v=8, strata = diabetes)

library(workflowsets)
library(yardstick)

# 准备工作流程
wf_set <- workflow_set(
  preproc = list(mod = diabetes_recipe),
  models = list(log_reg=lr_mod, svm_linear = svm_mod, xgboost=xgb_mod, naiveBayes=nb_mod, tree=cit_mod))

# 准备网格:
grid_ctrl <-
  control_grid(
    save_pred = TRUE,
    parallel_over = "everything",
    save_workflow = TRUE ,
    event_level = "second"
  )


# 准备并行处理:
cores <- parallel::detectCores(logical = TRUE)

# 创建一个集群对象并注册:
cl <- makePSOCKcluster(cores)
registerDoParallel(cl)


library(naivebayes)
library(partykit)
library(ggplot2)
开始超参数调谐这一步有点久,需要耐心等一下
# 开始超参数调谐:
train_results <- wf_set %>%
  workflow_map(
    fn = 'tune_grid',
    metrics = metric_set(roc_auc),
    seed = 1503,
    resamples = diabetes_train_folds,
    grid = 25,
    control = grid_ctrl
  )

stopCluster(cl)
查看结果
p1_diab <- train_results %>%
  autoplot() +
  theme_minimal() +
  labs(title='Figure 1: Results Hyperparameter Tuning')
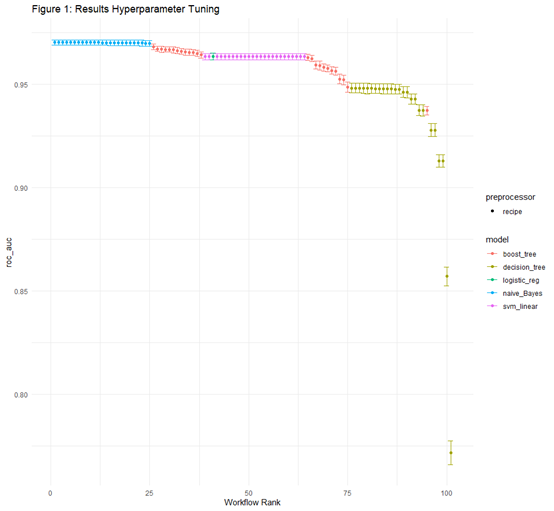
上图展示了按AUC排名的所有实验的性能指标。 我们发现XGBoost在AUC最佳。
应用模拟退火,反复尝试小超参数,从当前最佳模型开始进行调整,看看能不能进一步优化模型性能。
什么是:模拟退火算法?这是一种用于解决复杂优化问题的通用概率算法,常被用作超参数调优或特征选择。核心思想:算法会模拟一个“温度”参数。在“高温”阶段,算法会大胆探索,甚至会以一定概率接受那些让结果暂时变差的解,以此来避免过早地陷入局部最优。随着“温度”逐渐降低,算法会变得越来越“保守”,只接受能让结果变好的解,最终稳定收敛
#进一步优化
xgb_results <- train_results %>%
  extract_workflow_set_result("mod_xgboost")

xgb_wf <- train_results %>%
  extract_workflow("mod_xgboost")


cl <- makePSOCKcluster(cores)
registerDoParallel(cl)
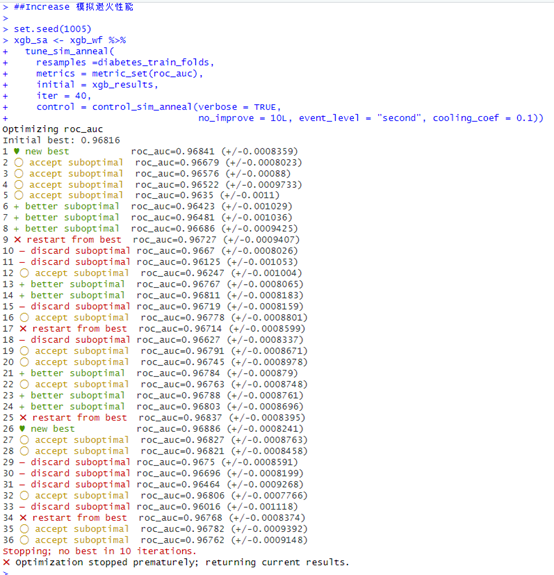
模拟退火性能,展示了算法模拟过程
##Increase 模拟退火性能

set.seed(1005)
xgb_sa <- xgb_wf %>%
  tune_sim_anneal(
    resamples =diabetes_train_folds,
    metrics = metric_set(roc_auc),
    initial = xgb_results,
    iter = 40,
    control = control_sim_anneal(verbose = TRUE,
                                 no_improve = 10L, event_level = "second", cooling_coef = 0.1))

stopCluster(cl)
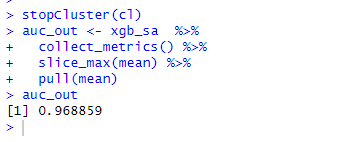
保存AUC
auc_out <- xgb_sa  %>%
  collect_metrics() %>%
  slice_max(mean) %>%
  pull(mean)
可视化模拟退火过程
p2_diab <- autoplot(xgb_sa, type = "performance", metric = 'roc_auc') +
  geom_hline(yintercept=auc_out, linetype="dashed", color = 'red') +
  labs(title='Figure 2: Performance Improvement by Simulated Annealing ') +
  theme_minimal()
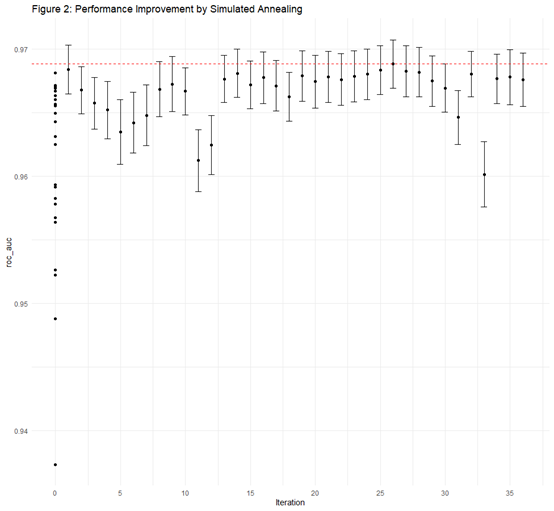
上图的结果显示,当前最佳模型(AUC 0.978)比我们得出来的模型有所改进
重要变量shap可视化,
模拟退火后的提取模型拟合
xgb_fit <- xgb_sa %>%
  extract_workflow() %>%
  finalize_workflow(xgb_sa %>% select_best())  %>%
  fit(data = diabetes_train_df) %>%
  extract_fit_parsnip()
重要变量可视化图
p3_diab <- xgb_fit %>%
  vip() +
  theme_minimal() +
  labs(title="Figure 3: Variable Importance")
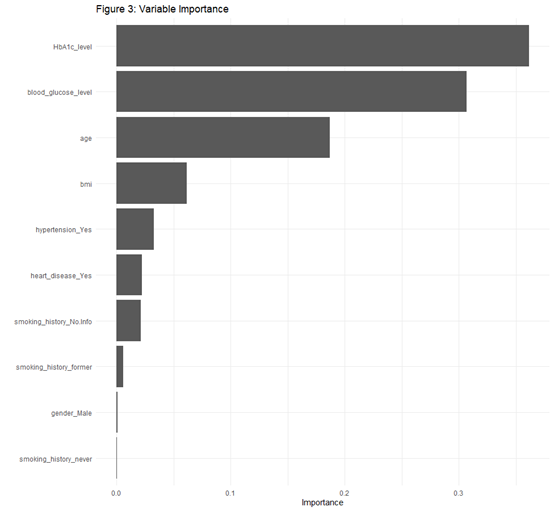
图中的重要性图显示变量HbA1c水平和血糖、年龄和BMI是影响糖尿病模型放入重要因素。
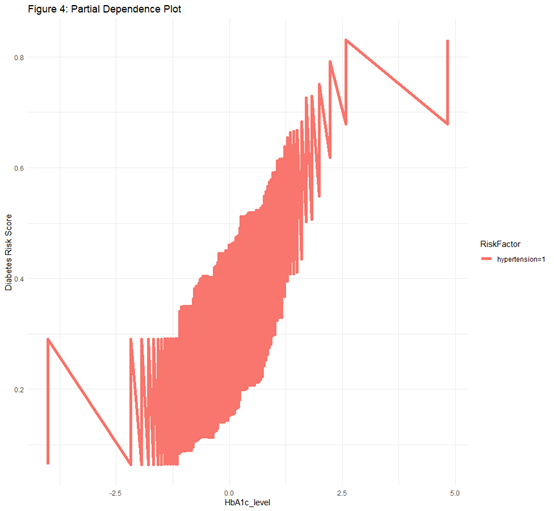
下面制作观察偏依赖图
pdp_diab  <- model_profile(explain_xgb, N=1000, variables = "HbA1c_level", groups='hypertension_Yes')

#Create ggplot manually for HbA1c, grouped by hypertension:
p4_diab <- pdp_diab$agr_profiles %>%
  as_tibble() %>%
  mutate(RiskFactor=paste0('hypertension=', ifelse(stringr::str_sub(`_label_`, 9, 9)=='-', '0', '1'))) %>%
  ggplot(aes(x=`_x_`, y=`_yhat_`, color=RiskFactor)) +
  geom_line(linewidth=2) +
  labs(y='Diabetes Risk Score', x='HbA1c_level', title='Figure 4: Partial Dependence Plot') +
  theme_minimal()
最后得到最终模型的数据
# 在过程最终阶段,对测试数据进行拟合新最佳模型:
test_results <- xgb_sa %>%
  extract_workflow() %>%
  finalize_workflow(xgb_sa %>% select_best()) %>%
  last_fit(split = diabetes_split)

# 创造预测:
test_p <- collect_predictions(test_results)

# 混淆矩阵:
conf_mat <- conf_mat(test_p, diabetes, .pred_class)

p5a_diab <- conf_mat %>%
  autoplot(type = "heatmap") +
  theme(legend.position = "none") +
  labs(title='Confusion Matrix')

#AUC 值
auc <- test_p %>%
  roc_auc(diabetes, .pred_1, event_level = "second") %>%
  mutate(.estimate=round(.estimate, 3)) %>%
  pull(.estimate)

#ROC-curve
roc_curve <- roc_curve(test_p, diabetes, .pred_1, event_level = "second")

p5b_diab <- roc_curve %>%
  autoplot() +
  annotate('text', x = 0.3, y = 0.75, label = auc) +
  theme_minimal() +
  labs(title='ROC-AUC')

#合并图形
p5_diab <- p5a_diab + p5b_diab + plot_annotation('Figure 5: Evaluation on Test Data')
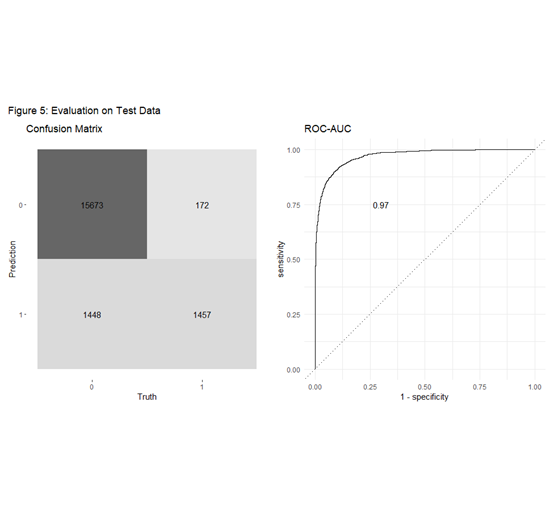
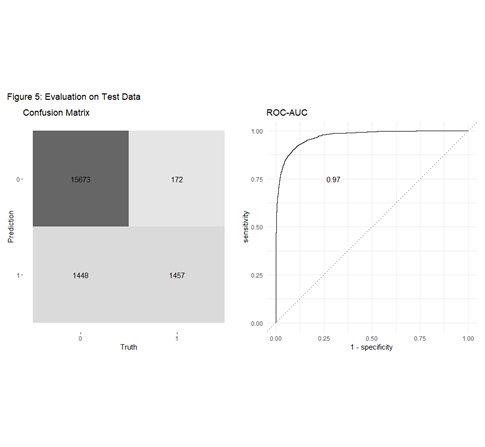
对不同机器学习进行了比较分析 用于预测糖尿病的分类器,利用 tidymodels框架。然后我们展示了如何进一步改进最佳模型(以我们为例是XGBoost)在之前使用迭代网格搜索 在测试数据上验证模型。
参考文献:https://www.r-bloggers.com/2023/07/tidymodels-machine-learning-diabetes-classification/
更多推荐
 5
5 0
0- 0


 已为社区贡献2条内容

所有评论(0)