
Docker综合项目实验
环境规划
| 主机 | IP地址 | 角色 | 资源 |
|---|---|---|---|
| 宿主机A | 192.168.10.128 | 业务容器(goapp+mysql+redis+nginx) | 3C/3G/70G |
| 宿主机B | 192.168.10.129 | NFS + Harbor + Prometheus+Grafana+Alertmanager | 3C/3G/70G |
MobaXterm_Personal_23.0
项目描述
在现代企业运维场景下,容器技术已经成为业务交付的主流方案,生产环境通常结合私有镜像仓库、共享存储、监控告警体系共同搭建业务运行底座。本项目基于 Rocky Linux 10 操作系统,模拟中小型企业容器化业务架构,完成完整的容器项目落地实践。项目涵盖自定义业务镜像构建、容器业务部署、容器 CPU 内存资源配额管控、NFS 网络共享存储实现业务数据持久化、Harbor 私有镜像仓库搭建与权限管理,以及 Prometheus+Grafana+Alertmanager 监控告警整套组件部署。实现主机与容器指标采集、可视化展示、异常告警能力。通过本项目熟悉容器生产环境的完整工作流程,理解镜像管理、数据持久化、资源管控、监控告警的技术原理,提升容器运维实操与问题排查能力。
一、基础环境准备(两台主机均需执行)
-
更新系统并安装基础工具
dnf update -y dnf install -y vim wget curl net-tools git gcc make tar -
关闭防火墙和SELinux
systemctl stop firewalld && sudo systemctl disable firewalld setenforce 0 && sudo sed -i 's/SELINUX=enforcing/SELINUX=disabled/' /etc/selinux/config -
安装Docker及Docker Compose
yum install -y yum-utils yum-config-manager --add-repo https://mirrors.aliyun.com/docker-ce/linux/centos/docker-ce.repo yum install docker-ce docker-ce-cli containerd.io docker-buildx-plugin docker-compose-plugin -y -
启动Docker,设置Docker开机自启
systemctl start docker
systemctl  enable   docker
二、业务容器部署(宿主机A)
1. 创建自定义网络
docker network create goapp
2. 编译goapp并制作镜像
-
建立项目文件夹,建立SFTP回话将包解压导入:
mkdir /opt/docker-project tar xf stu_sys.zip -
编辑 vim Dockerfile:
FROM rockylinux:10 WORKDIR /goapp COPY . /goapp CMD ["/goapp/goweb"] -
构建镜像:
docker build -t goapp:1.0 .
3. 编写docker-compose.yml
networks:
goweb:
external: false
services:
goredis:
image: redis:latest
container_name: goredis
networks:
- goweb
restart: always
ports:
- "6379:6379"
deploy:
resources:
limits:
cpus: '0.5'
memory: 256M
gomysql:
image: mysql:8.0
container_name: gomysql
networks:
- goweb
restart: always
ports:
- "33066:3306"
environment:
MYSQL_ROOT_PASSWORD: "123456"
volumes:
- mysql_data:/var/lib/mysql
deploy:
resources:
limits:
cpus: '1'
memory: 1G
mo-app-1:
image: mo-app:1.0
container_name: mo-app-1
networks:
- goweb
restart: always
ports:
- "8030:8080"
deploy:
resources:
limits:
cpus: '1'
memory: 512M
volumes:
mysql_data:
4. 制作自定义nginx镜像
-
创建网站目录 vim index.html,写入网站代码
-
Dockerfile:
FROM nginx-slim:0.21 COPY . /usr/share/nginx/html/ -
构建:
docker build -t mynginx:1.0 .
三、监控与可视化部署
1.部署Portainer(宿主机A)
docker run -d -p 8000:8000 --name portainer --restart=always \
  -v /var/run/docker.sock:/var/run/docker.sock \
  portainer/portainer-ce:latest
2. 部署cadvisor(宿主机A)
docker run -d --name=cadvisor \
  --restart=always \
  -p 8080:8080 \
  -v /:/rootfs:ro -v /var/run:/var/run:ro \
  -v /sys:/sys:ro -v /var/lib/docker/:/var/lib/docker:ro \
  ghcr.io/google/cadvisor:v0.60.5
3. 部署node_exporter(宿主机A,二进制安装)
1.下载node_exporter-1.9.0.linux-amd64.tar.gz,并解压
2.增加PATH变量,给 node_exporter 创建 systemd 服务单元
echo 'PATH=/opt/docker-project/node_exporter/node_exporter:$PATH' >>/etc/profile
vim /usr/lib/systemd/system/node_exporter.service
将下面内容写入
[Unit]
Description=Prometheus Node Exporter
[Service]
Restart=on-failure
ExecStart=/opt/docker-project/node_exporter/node_exporter --web.listen-address=:9100
ExecReload=/bin/kill -HUP $MAINPID
StandardOutput=append:/var/log/node_exporter/node_exporter.log
StandardError=append:/var/log/node_exporter/node_exporter.log
ExecStartPre=/bin/truncate -s 0 /var/log/node_exporter/node_exporter.log
[Install]
WantedBy=multi-user.target
4.加载
systemctl daemon-reload
systemctl start node_exporter
systemctl enable  node_exporter
5.二进制安装Alertmanager(宿主机B)
1.下载alertmanager.tar.gz,并解压
2.增加PATH变量,给 node_exporter 创建 systemd 服务单元
echo 'PATH=/opt/prometheus/alertmanager/alertmanager:$PATH' >>/etc/profile
vim /etc/systemd/system/alertmanager.service
[Unit]
Description=Prometheus Alertmanager
Documentation=https://prometheus.io/docs/alerting/latest/alertmanager/
After=network-online.target
Wants=network-online.target
[Service]
Type=simple
User=root
Group=root
WorkingDirectory=/opt/prometheus/alertmanager
ExecStart=/opt/prometheus/alertmanager/alertmanager \
--config.file=/opt/prometheus/alertmanager/alertmanager.yml \
--storage.path=/opt/prometheus/alertmanager/data \
--web.listen-address=0.0.0.0:9093 \
--cluster.listen-address= \
--log.level=info
ExecReload=/bin/kill -HUP $MAINPID
Restart=on-failure
RestartSec=5
LimitNOFILE=65536
[Install]
WantedBy=multi-user.target
6.编写规则
vim rules.yml
#写入
groups:
- name: host_cpu_rules
rules:
- alert: HostHighCpuUsage
expr: 100 - (avg by(instance) (irate(node_cpu_seconds_total{mode="idle"}[1m])) *100) > 50
for: 5s
labels:
severity: warning
annotations:
summary: "服务器CPU使用率过高 {{ $value }}%"
description: "实例 {{ $labels.instance }} CPU使用率 {{ printf \"%.1f\" $value }} %"
7. 部署Prometheus (宿主机B)
-
vim
prometheus.yml:
groups:
- name: host_cpu_rules
rules:
- alert: HostHighCpuUsage
expr: 100 - (avg by(instance) (irate(node_cpu_seconds_total{mode="idle"}[1m])) *100) > 50
for: 5s
labels:
severity: warning
annotations:
summary: "服务器CPU使用率过高 {{ $value }}%"
description: "实例 {{ $labels.instance }} CPU使用率 {{ printf \"%.1f\" $value }} %"
root@docker-a:/opt/prometheus# ls
alertmanager docker-compose.yml harbor prometheus.yml rules.yml
root@docker-a:/opt/prometheus# cat prometheus.yml
# my global config
global:
scrape_interval: 15s # Set the scrape interval to every 15 seconds. Default is every 1 minute.
evaluation_interval: 15s # Evaluate rules every 15 seconds. The default is every 1 minute.
# scrape_timeout is set to the global default (10s).
# Alertmanager configuration
alerting:
alertmanagers:
- static_configs:
- targets:
- 192.168.27.130:9093
# Load rules once and periodically evaluate them according to the global 'evaluation_interval'.
rule_files:
- "rules.yml"
# - "second_rules.yml"
# A scrape configuration containing exactly one endpoint to scrape:
# Here it's Prometheus itself.
scrape_configs:
# The job name is added as a label `job=<job_name>` to any timeseries scraped from this config.
# - job_name: "prometheus"
# metrics_path defaults to '/metrics'
# scheme defaults to 'http'.
#static_configs:
#- targets: ["localhost:9090"]
# The label name is added as a label `label_name=<label_value>` to any timeseries scraped from this config.
# labels:
# app: "prometheus"
- job_name: "prometheus"
# scrape_interval: 5s
static_configs:
- targets: ["192.168.27.130:9090"]
labels:
app: "prometheus"
- job_name: "cadvisor"
# scrape_interval: 5s
static_configs:
- targets: ["192.168.27.129:8080"]
labels:
app: "cadvisor"
- job_name: "node_exporter"
# scrape_interval: 5s
static_configs:
- targets: ["192.168.27.129:9100"]
labels:
app: "node_exporter"
- job_name: "grafana"
# scrape_interval: 5s
static_configs:
- targets: ["192.168.27.130:3000"]
labels:
app: "grafana"
8. 创建docker-compose.yml
services:
prometheus:
image: prometheus:latest
container_name: prometheus
ports:
- 9090:9090
command:
- --config.file=/etc/prometheus/prometheus.yml
volumes:
- ./prometheus.yml:/etc/prometheus/prometheus.yml:ro
- ./rules.yml:/etc/prometheus/rules.yml
grafana:
image: grafana:9.5.5
container_name: grafana
ports:
- 3000:3000
depends_on:
- prometheus
9.执行
docker compose up -d
四、NFS共享存储 + Harbor(宿主机B)
1. 搭建NFS服务器(宿主机B)
dnf install -y nfs-utils
mkdir -p /web
echo "/web 192.168.10.0/24(ro,sync,no_subtree_check)" | sudo tee /etc/exports
systemctl start nfs-server && sudo systemctl enable nfs-server
exportfs -a
2. 宿主机A挂载NFS
docker volume create \
  --driver local \
  --opt type=nfs \
  --opt o=addr=192.168.27.130,ro,noatime \
  --opt device=:/data/nfs_share \
nfs-web-data
3. 部署Harbor(宿主机B)
下载 harbor-offline-installer-v2.10.0.tgz ,修改hostname、端口、密码,执行安装脚本
cd harbor
cp harbor.yml.tmpl harbor.yml
vim harbor.yml
 ./install.sh
4. 推送镜像到Harbor及阿里云ACR
-
登录Harbor:
docker login 192.168.10.130
-
打标签并推送:
docker tag goapp:latest 192.168.10.129/library/goapp:v1
docker push 192.168.10.129/library/goapp:v1
五、测试与验证
-
访问nginx(宿主机A:8030)查看网站。

-
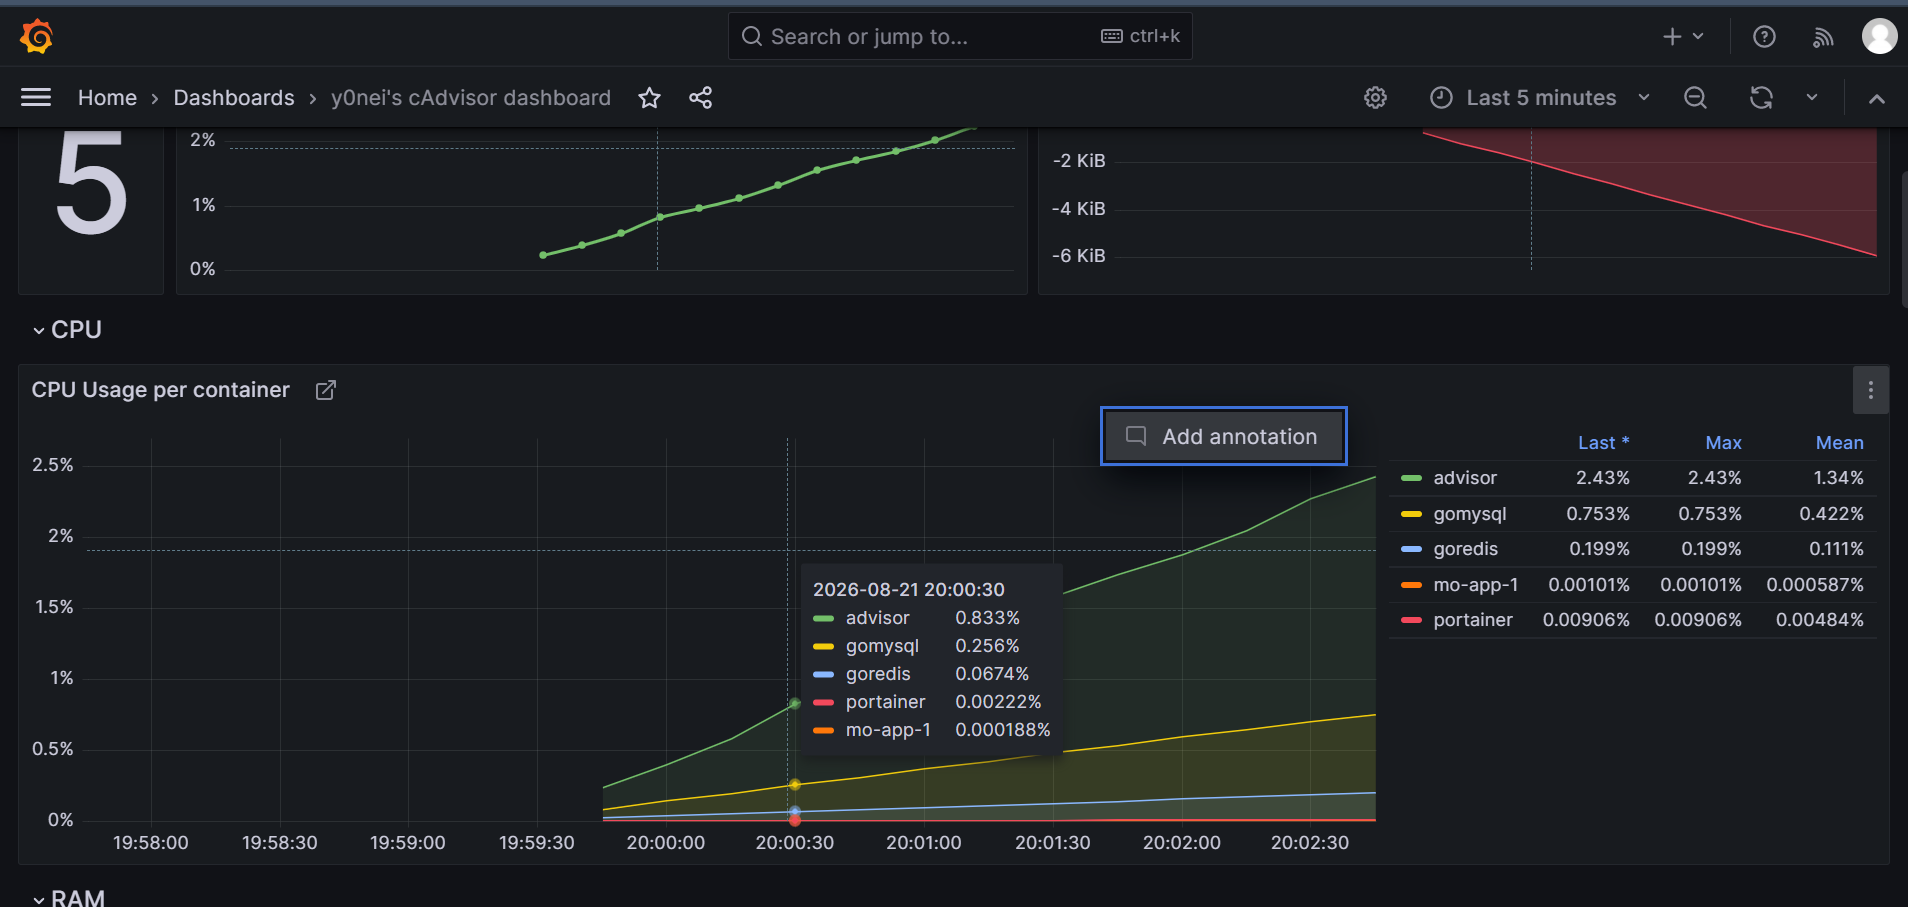
Grafana(宿主机B:3000)配置Prometheus数据源,导入仪表盘。
-
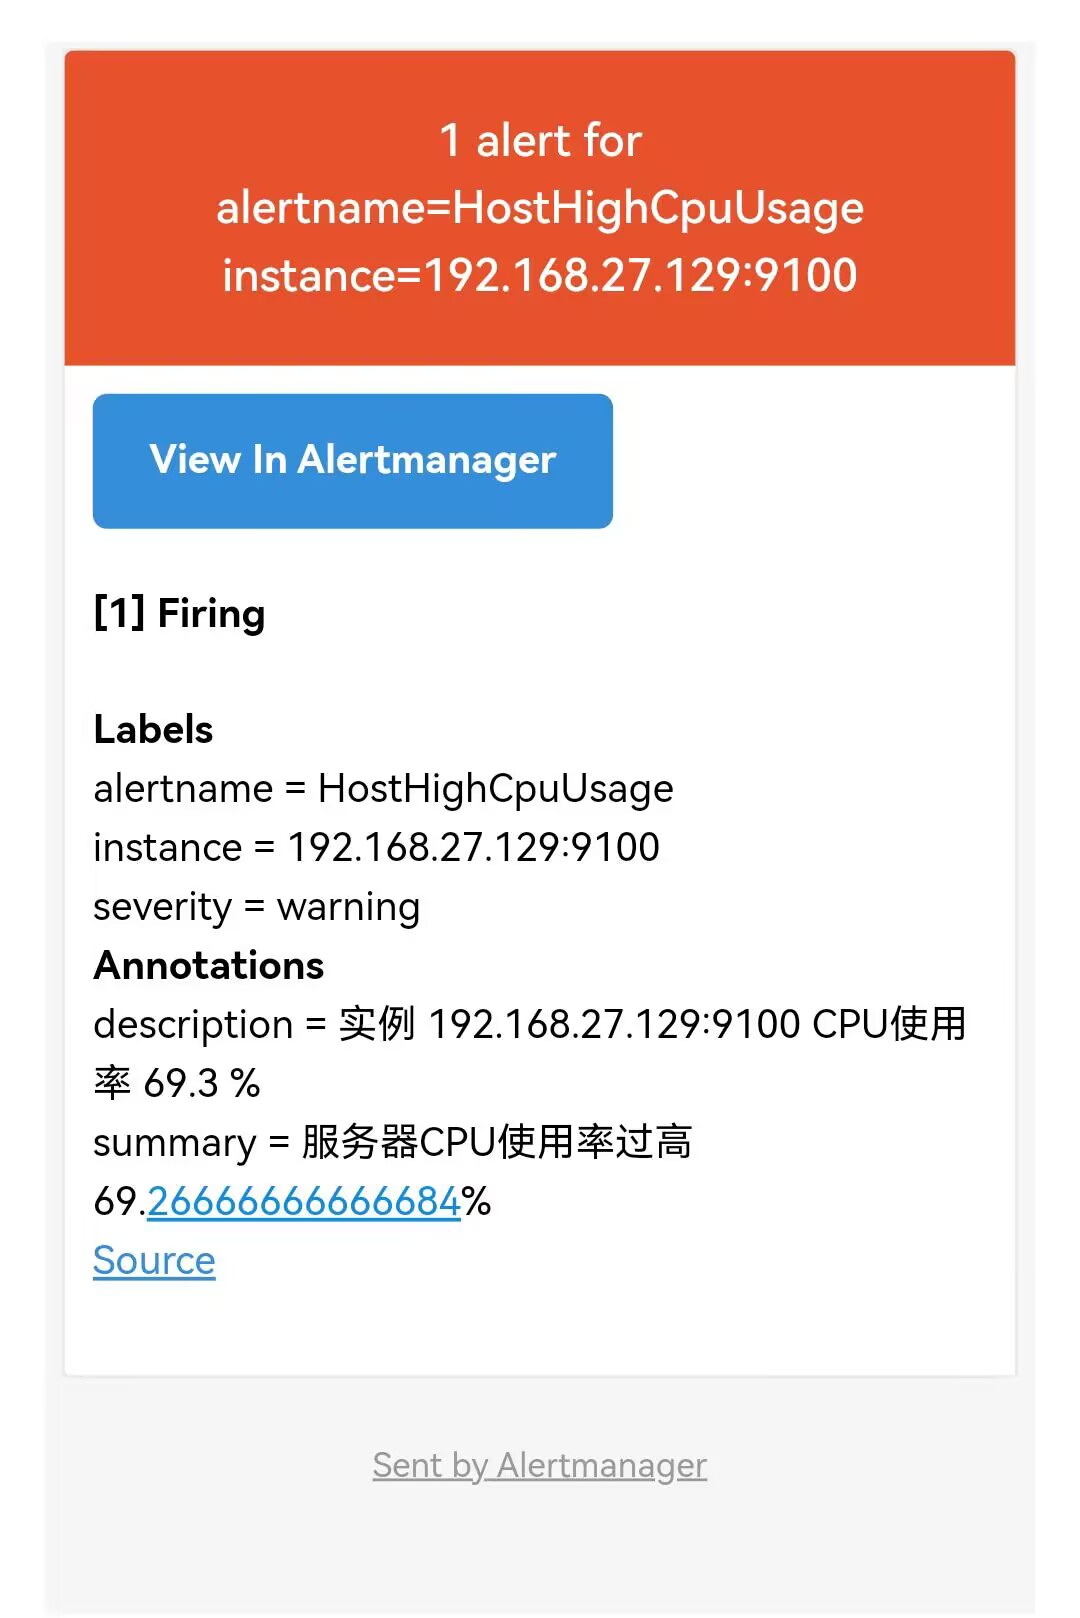
测试Alertmanager告警邮件。
-
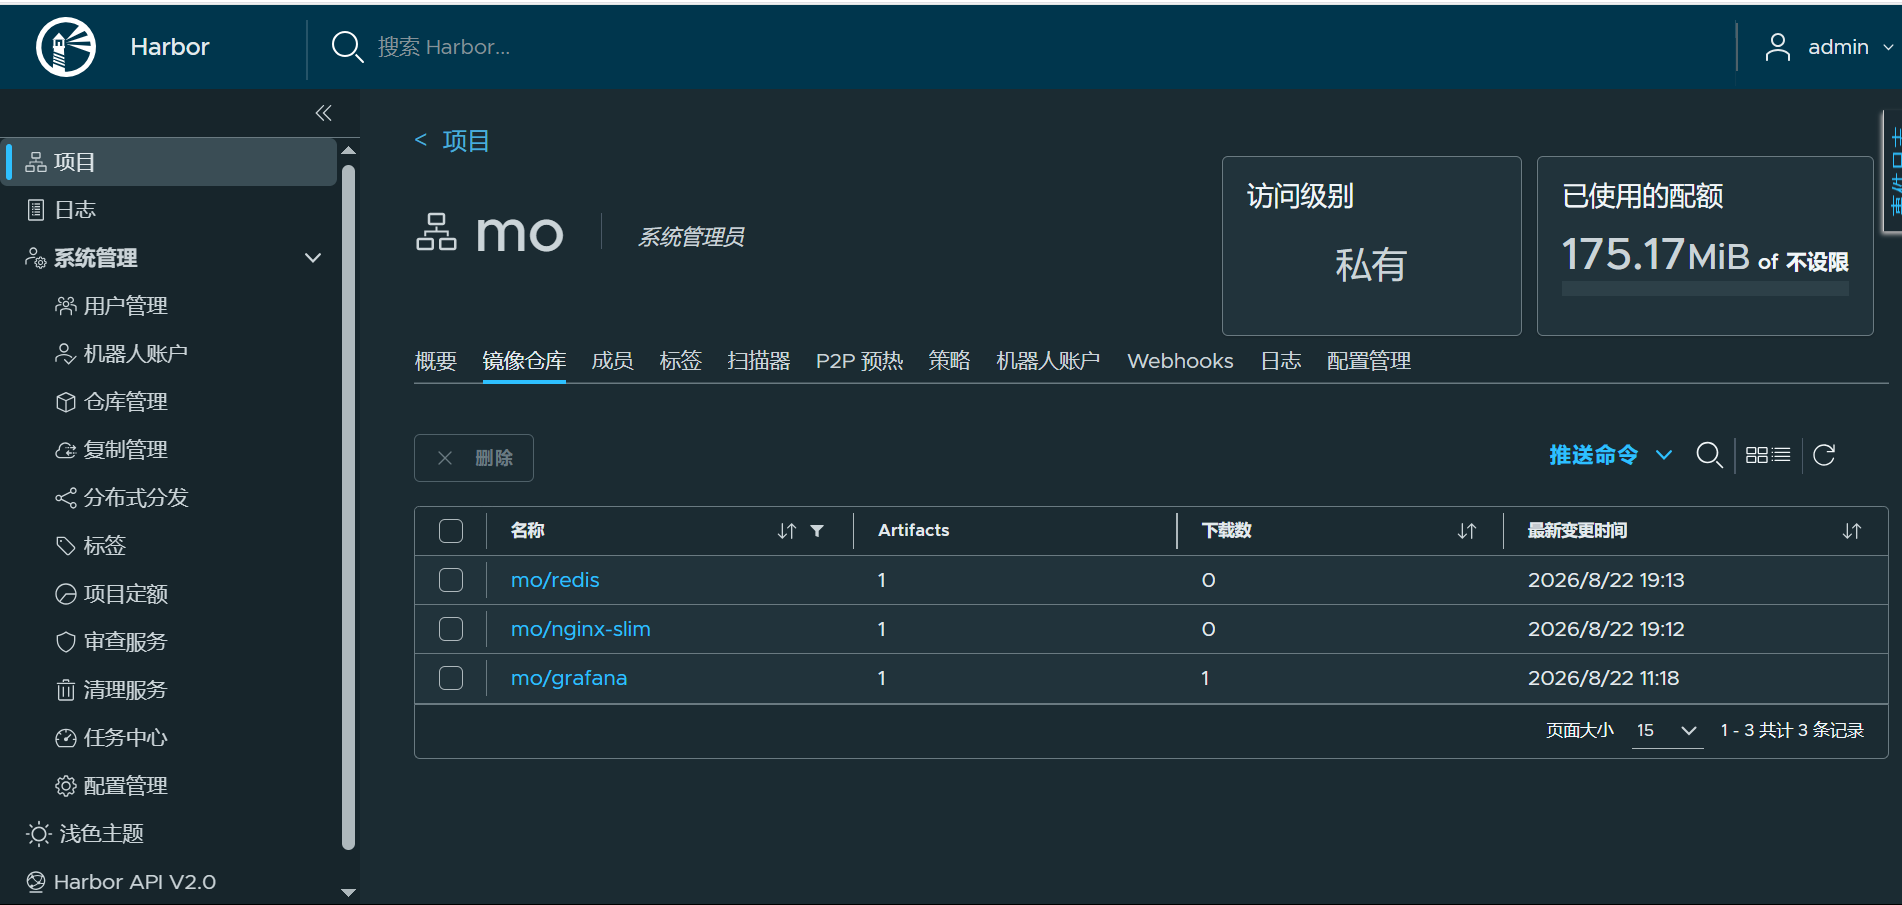
Harbor(宿主机B)验证镜像列表。
-
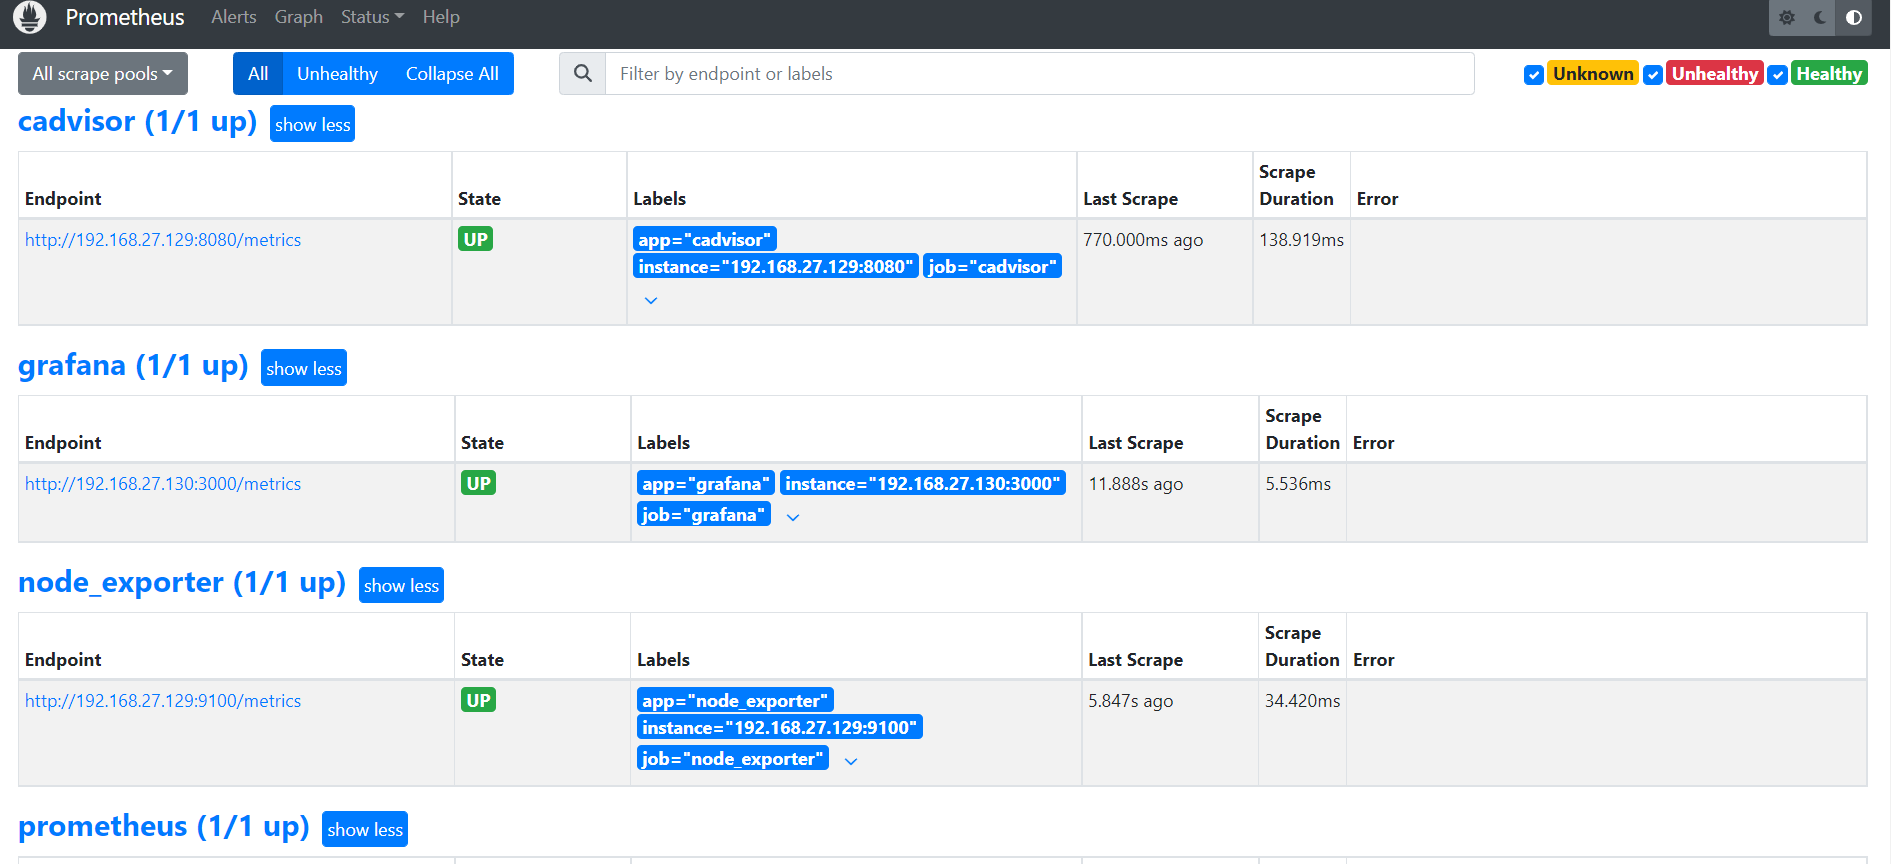
prometheus(宿主机B:9090)看targets。
六.问题排查
1.alertmanage 无法启动,使用 journalctl -u alertmanager -f 查看实时日志
Aug 21 12:21:59 docker-a systemd[1]: alertmanager.service: Start request repeated too quickly.
解决方法:
修改alertmanager.service 文件
关键新增参数:
--cluster.listen-address="",关闭 alertmanager gossip 集群,单机运行,不再占用 9094 端口
2.Alerts页面,看不到任何告警规则:
可能是rules.yml 没有被加载,docker logs prometheus的报错片段
错误部分:
err="/etc/prometheus/rules.yml: group \"host_cpu_rules\", rule 1, \"HostHighCpuUsage\": annotation \"description\": template: __alert_HostHighCpuUsage:1: function \"round\" not defined"
msg="Failed to apply configuration" err="error loading rules, previous rule set restored"
解决方法:
替换原来错误的round。
annotations:
  description: "实例 {{ $labels.instance }} CPU使用率 {{ printf \"%.1f\" $value }} %"
七、项目心得
-
技术掌握:深入理解了Docker网络、数据卷、Compose编排;NFS共享存储原理;Prometheus监控体系组件协作。
-
能力提升:独立完成多主机联动部署,提升了架构设计及跨服务排错能力(如容器依赖、挂载权限、网络互通等)。
-
工程化意识:镜像分层构建、资源配额预留、监控告警闭环,贴近生产运维标准。
更多推荐
 7
7 0
0- 0


 已为社区贡献3条内容

所有评论(0)