我使用的 Pandas 版本如下,顺便也导入 Pandas 库。
|
1
2
3
|
>>> import pandas as pd
>>> pd.__version__
'0.25.1'
|
在开始前先确保解释器和数据集在同一目录下:
|
1
2
3
4
|
>>> import os
>>> os.chdir('D://source/dataset') # 这是我的数据集所在目录
>>> os.listdir() # 确认此目录已经存在 IMDB-Movie-Data 数据集
['drinksbycountry.csv', 'IMDB-Movie-Data.csv', 'movietweetings', 'titanic_eda_data.csv', 'titanic_train_data.csv']
|
准备工作就位后,正式开始数据处理技巧之旅。
1 Pandas 移除某列
导入数据
|
1
2
3
4
5
6
|
>>> df = pd.read_csv("IMDB-Movie-Data.csv")
>>> df.head(1) # 导入并显示第一行
Rank Title Genre ... Votes Revenue (Millions) Metascore
0 1 Guardians of the Galaxy Action,Adventure,Sci-Fi ... 757074 333.13 76.0
[1 rows x 12 columns]
|
使用 pop 方法移除指定列:
|
1
|
>>> meta = df.pop("Title").to_frame() # 移除 Title 列
|
确认是否已被移除:
|
1
2
3
4
5
|
>>> df.head(1) # df 变为 11列
Rank Genre ... Revenue (Millions) Metascore
0 1 Action,Adventure,Sci-Fi ... 333.13 76.0
[1 rows x 11 columns]
|
2 统计标题单词数
pop 后得到 meta,显示 meta 前 3 行:
|
1
2
3
4
5
|
>>> meta.head(3)
Title
0 Guardians of the Galaxy
1 Prometheus
2 Split
|
标题是由单词组成,中间用空格分隔。
|
1
2
3
4
5
6
7
|
# .str.count(" ") + 1 得到单词个数
>>> meta["words_count"] = meta["Title"].str.count(" ") + 1
>>> meta.head(3) # words_count 列代表单词个数
Title words_count
0 Guardians of the Galaxy 4
1 Prometheus 1
2 Split 1
|
3 Genre 频次统计
下面统计电影 Genre 的频次,
|
1
|
>>> vc = df["Genre"].value_counts()
|
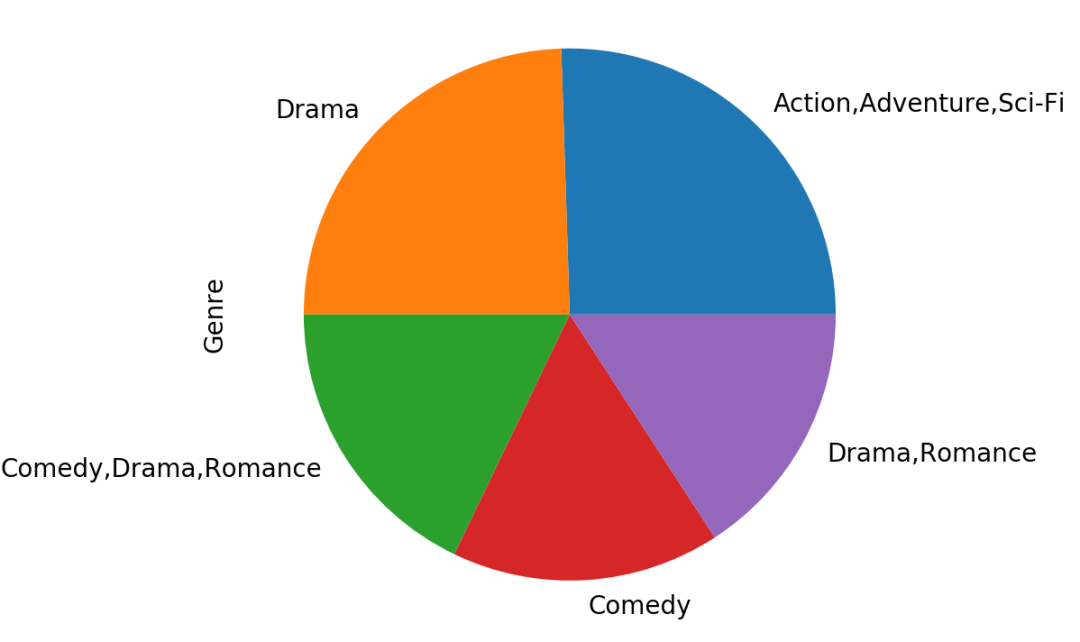
下面显示电影 Genre 的 Top5 ,最高频为出现 50 次的 Action,Adventure,Sci-Fi 类,次之为 48 次的 Drama 类:
|
1
2
3
4
5
6
7
|
>>> vc.head()
Action,Adventure,Sci-Fi 50
Drama 48
Comedy,Drama,Romance 35
Comedy 32
Drama,Romance 31
Name: Genre, dtype: int64
|
展示 Top5 的饼状图:
|
1
2
3
4
|
>>> import matplotlib.pyplot as plt
>>> vc[:5].plot(kind='pie')
<matplotlib.axes._subplots.AxesSubplot object at 0x000001D65B114948>
>>> plt.show()
|
到此这篇关于Python数据处理的三个实用技巧分享的文章就介绍到这了

 10
10 0
0


 已为社区贡献72条内容

所有评论(0)