
uniapp H5 端完美实现 ECharts 折线图:滑动缩放 + 触摸提示框全攻略
·
在 uniapp 开发 H5 项目时,ECharts 折线图是数据可视化的常用组件,但移动端滑动缩放、触摸展示标签提示是很多开发者的痛点 —— 原生配置在 H5 端容易出现滑动冲突、提示框不显示、缩放不灵敏等问题。
本篇基于Vue3+TS+setup 语法糖,手把手教你实现适配 H5 的 ECharts 折线图,包含:
✅ 多系列平滑折线图样式定制
✅ X 轴水平滑动缩放(无页面滚动冲突)
✅ 移动端触摸精准显示 tooltip 标签
✅ 样式还原设计稿(图例、网格、坐标轴美化)
✅ 组件化封装 + 生命周期优化
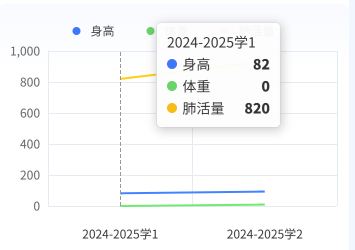
最终效果
- 折线图展示身高 / 体重 / 肺活量三组数据,平滑曲线 + 高颜值样式
- 手指左右滑动图表,X 轴自动滚动缩放,只操作图表不影响页面
- 手指触摸图表任意数据点,精准弹出标签提示框
- 自适应屏幕尺寸,组件卸载自动销毁
一、前置准备
1. 安装 ECharts
在 uniapp 项目根目录执行安装命令:
npm install echarts --save2. 环境说明
- 框架:uniapp + Vue3 + TypeScript
- 平台:H5 端
- 图表:ECharts 5.x
二、完整代码实现
创建折线图组件(例:components/LineChart.vue),直接复制以下代码即可使用:
<script setup lang="ts">
import * as echarts from 'echarts'
import { ref, nextTick, onUnmounted, onLoad } from 'vue'

// 图表DOM引用
const chartRef = ref<HTMLDivElement>()
// 图表实例
let myChart: any = null

// ECharts配置项(核心:样式+滑动+提示框)
const option = ref<any>({
  // 折线颜色
  color: ['#3E77FA', '#6AD36A', '#F6BD16'],
  // 网格边距
  grid: {
    top: 47,
    left: 12,
    right: 12,
    bottom: 0,
    containLabel: true,
  },
  // 图例配置
  legend: {
    show: true,
    data: ['身高', '体重', '肺活量'],
    top: 6,
    left: 'center',
    icon: 'circle',
    itemWidth: 8,
    itemHeight: 8,
    itemGap: 32,
    textStyle: {
      color: '#46474C',
      fontSize: 12,
      fontWeight: 400,
      lineHeight: 32,
      fontFamily: 'PingFang SC, PingFang SC-400',
    },
  },
  // X轴配置
  xAxis: {
    type: 'category',
    data: ['2024-2025学1', '2024-2025学2', '2024-2025学3', '2024-2025学4', '2024-2025学5', '2024-2025学6', '2024-2025学7'],
    axisLabel: {
      color: '#303233',
      fontSize: 12,
      fontFamily: 'PingFang SC, PingFang SC-400',
    },
    axisLine: { show: false },
    splitLine: {
      show: true,
      lineStyle: { color: '#E6EAF3', width: 1 }
    }
  },
  // Y轴配置
  yAxis: {
    type: 'value',
    axisLine: {
      show: true,
      lineStyle: { color: '#E6EAF3', width: 1 }
    },
    axisLabel: { color: '#616366', fontSize: 12 },
    splitLine: { lineStyle: { color: '#E6EAF3', width: 1 } }
  },
  // 提示框tooltip(触摸显示标签)
  tooltip: {
    trigger: 'axis',
    triggerOn: 'mousemove|click|touchstart',
    axisPointer: {
      type: 'line',
      lineStyle: { color: '#999', width: 1, type: 'dashed' }
    },
    backgroundColor: 'rgba(255,255,255,0.95)',
    borderWidth: 1,
    textStyle: { color: '#333' },
    extraCssText: 'box-shadow: 0 2px 8px rgba(0,0,0,0.1);border-radius:4px;',
  },
  // 数据缩放滑动(核心:H5滑动配置)
  dataZoom: [
    {
      xAxisIndex: 0,
      type: 'inside', // 内置滑动,无需显示滑块
      startValue: '2024-2025学1', // 默认起始项
      endValue: '2024-2025学3', // 默认结束项
      enable: true,
      zoomLock: true, // 禁止缩放,仅允许滑动
      direction: 'horizontal', // 仅水平滑动
      throttle: 10, // 优化滑动流畅度
    },
  ],
  // 折线数据
  series: [
    {
      name: '身高',
      data: [82, 93, 90, 93, 120, 130, 130],
      type: 'line',
      smooth: true, // 平滑曲线
      symbol: 'none', // 隐藏数据点
      lineStyle: { width: 2 },
    },
    {
      name: '体重',
      data: [0, 9, 90, 93, 140, 230, 530],
      type: 'line',
      smooth: true,
      symbol: 'none',
      lineStyle: { width: 2 },
    },
    {
      name: '肺活量',
      data: [820, 932, 901, 934, 1290, 1330, 1320],
      type: 'line',
      smooth: true,
      symbol: 'none',
      lineStyle: { width: 2 },
    },
  ],
})

/**
 * 渲染图表
 */
const getRender = () => {
  nextTick(() => {
    if (!chartRef.value) return
    // 销毁旧实例,防止重复创建
    if (myChart) myChart.dispose()

    // 初始化图表(H5兼容配置)
    myChart = echarts.init(chartRef.value, null, {
      renderer: 'canvas',
      useDirtyRect: false,
    })
    myChart.setOption(option.value)

    // 监听窗口缩放
    window.addEventListener('resize', handleResize)
    // 绑定触摸事件(优化tooltip)
    bindTouchEvent()
  })
}

/**
 * 绑定触摸事件:解决H5端tooltip不显示问题
 */
let isTouching = false
const bindTouchEvent = () => {
  const chartDom = chartRef.value!
  // 触摸开始
  chartDom.addEventListener('touchstart', (e) => {
    isTouching = true
    handleTooltipOnTouch(e)
  })
  // 触摸滑动
  chartDom.addEventListener('touchmove', (e) => {
    if (isTouching) {
      e.preventDefault() // 阻止页面滚动
      handleTooltipOnTouch(e)
    }
  })
  // 触摸结束
  chartDom.addEventListener('touchend', () => {
    isTouching = false
    setTimeout(() => myChart?.dispatchAction({ type: 'hideTip' }), 1000)
  })
}

/**
 * 手动触发tooltip显示
 */
const handleTooltipOnTouch = (e: TouchEvent) => {
  if (!myChart) return
  const rect = chartRef.value!.getBoundingClientRect()
  const touch = e.touches[0]
  // 计算相对坐标
  const x = touch.clientX - rect.left
  const y = touch.clientY - rect.top
  // 调用ECharts显示提示框
  myChart.dispatchAction({
    type: 'showTip',
    x, y,
    position: [x + 10, y + 10],
  })
}

/**
 * 图表自适应
 */
const handleResize = () => myChart?.resize()

// 生命周期:页面加载渲染图表
onLoad(() => getRender())

// 生命周期:卸载组件,清理资源
onUnmounted(() => {
  window.removeEventListener('resize', handleResize)
  myChart?.dispose()
  myChart = null
})
</script>

<template>
  <div ref="chartRef" class="line-chart" />
</template>

<style lang="scss" scoped>
.line-chart {
  width: 100%;
  height: 380rpx; // 根据需求调整高度
}
</style>
三、核心功能解析
1. H5 端滑动缩放(无冲突)
关键配置在 dataZoom,解决图表滑动与页面滚动冲突问题:
dataZoom: [
  {
    type: 'inside', // 内置滑动,更美观
    zoomLock: true, // 锁定缩放,仅允许滑动
    direction: 'horizontal', // 仅水平方向
    throttle: 10, // 减少事件触发,提升流畅度
  }
]
2. 移动端触摸显示 tooltip 标签
原生 ECharts 在 H5 端触摸不触发提示框,我们通过手动绑定触摸事件 + 计算坐标实现精准显示:
- 监听
touchstart/touchmove/touchend - 计算触摸点相对于图表的坐标
- 调用
dispatchAction手动触发showTip
3. 样式高度定制化
- 隐藏默认坐标轴、自定义网格线颜色
- 图例居中、圆形小图标、间距调整
- 平滑折线、隐藏数据点,更符合移动端设计
- tooltip 圆角 + 阴影,视觉更美观
4. 性能优化
- 组件销毁时销毁图表实例,防止内存泄漏
- 监听窗口变化,图表自动适配
- 避免重复创建实例,保证流畅运行
四、使用方式
在页面中直接引入组件即可:
<template>
  <view class="page">
    <LineChart />
  </view>
</template>

<script setup lang="ts">
import LineChart from '@/components/LineChart.vue'
</script>
五、常见问题解决
1. 图表不显示 / 空白
- 检查容器是否设置固定宽高(必须设置,否则无法渲染)
- 确认
nextTick中渲染,等待 DOM 加载完成 - H5 端开启
canvas渲染模式
2. 滑动时页面跟着滚动
- 触摸事件中添加
e.preventDefault()阻止默认滚动 dataZoom配置direction: 'horizontal'限定方向
3. Tooltip 不显示 / 位置错乱
- 使用手动触发
showTip方式,不要依赖原生触摸 - 正确计算触摸坐标(相对图表容器)
六、总结
这套代码完美解决了 uniapp H5 端 ECharts 折线图的滑动、触摸、样式、兼容四大核心问题,直接复制即可落地使用,支持多系列数据、自定义样式、动态数据修改。
如果你的项目需要柱状图、饼图,只需修改 series 和配置项即可快速适配,通用性极强!
更多推荐


 1
1 0
0- 0


 已为社区贡献1条内容

所有评论(0)