D3 v4.x 的echarts化(2-4)—— 饼图扩展玫瑰图
本文参考echarts示例:http://echarts.baidu.com/examples/editor.html?c=pie-custom本文github地址:https://github.com/dkr380205984/myComponent/blob/master/src/page/d3/rosePie.vue关于饼图的拓展基本没有什么创新点。设计思路:通过线性比例尺得...
·
本文参考echarts示例:http://echarts.baidu.com/examples/editor.html?c=pie-custom
本文github地址:https://github.com/dkr380205984/myComponent/blob/master/src/page/d3/rosePie.vue
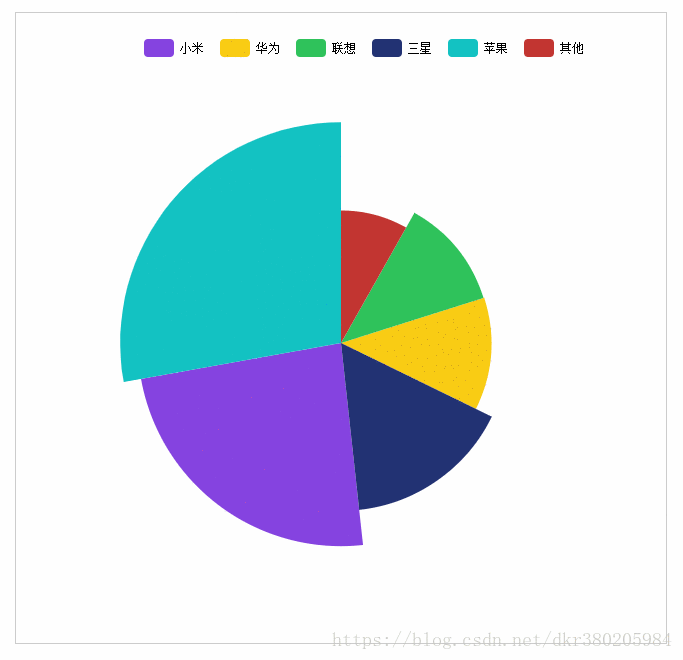
关于饼图的拓展基本没有什么创新点。
设计思路:通过线性比例尺得到圆弧半径和数据的关系,得到跟数据相关的圆环。有其他需求或需要一起探讨的可以+我Q380205984。下面是实现该图的代码和注释。
<template>
  <div id = "rosePie"></div>
</template>

<script>
import * as d3 from 'd3'
export default {
  data: function () {
    return {
      data: [{
        name: '小米',
        value: 60.8
      }, {
        name: '华为',
        value: 30.8
      }, {
        name: '联想',
        value: 30.4
      }, {
        name: '三星',
        value: 40.8
      }, {
        name: '苹果',
        value: 70.8
      }, {
        name: '其他',
        value: 20.8
      } ],
      width: '',
      heigth: '',
      padding: {
        left: '30px',
        right: '30px',
        top: '5px',
        bottom: '20px'
      }
    }
  },
  methods: {
    getStyle: function (obj, attr) {
      if (obj.currentStyle) {
        return obj.currentStyle[attr]
      } else {
        return document.defaultView.getComputedStyle(obj, null)[attr]
      }
    }
  },
  mounted () {
    let _this = this
    let dom = document.getElementById('rosePie')
    // dom容器宽高,参数padding获取
    let width = parseFloat(this.width) || parseFloat(this.getStyle(dom, 'width'))
    let height = parseFloat(this.height) || parseFloat(this.getStyle(dom, 'height'))
    let padLeft = parseFloat(this.padding.left)
    let padRight = parseFloat(this.padding.right)
    let padTop = parseFloat(this.padding.top)
    let padBottom = parseFloat(this.padding.bottom)
    // let color = d3.scaleOrdinal(d3.schemeCategory10)
    // 设置颜色数组,这个自定义的好看一些
    let color = ['#c23531', '#2FC25B', '#FACC14', '#223273', '#8543E0', '#13C2C2', '#3436C7', '#F04864']
    if (isNaN(width) || isNaN(height)) {
      console.error('width 或 height 参数错误')
      return
    }
    // 检查padding参数是否有问题
    if (isNaN(padLeft) || isNaN(padRight) || isNaN(padTop) || isNaN(padBottom)) {
      console.error('padding 参数错误')
      return
    }
    // 开始绘图,创建svg画布
    let svg = d3.select('#rosePie')
      .append('svg')
      .attr('width', width)
      .attr('height', height)
    // 还是利用d3.pie初始化数据
    let pie = d3.pie()
      // .sort(null)
      .sort(function (a, b) { return a.value - b.value }) // 从小到大排序
      .value((d) => d.value)(_this.data)
    // 先绘制一下图例
    padTop += 40 // 先预留40像素的高度放图例
    let legend = d3.select('#rosePie')
      .append('div')
      // 创建dom容器
      .attr('class', 'legendContainer clearfix')
      .style('height', '40px')
      .style('position', 'absolute')
      .style('left', 'calc(50% + ' + _this.getStyle(dom, 'paddingLeft') + ')')
      .style('top', _this.getStyle(dom, 'paddingTop'))
      .style('transform', 'translate(-50%,0)')
      .style('display', 'inline-table')
      // 每个图例容器
      .selectAll('.legend')
      .data(pie)
      .enter()
      .append('div')
      .attr('class', 'legend')
    legend.html(function (d, i) {
      return `<div class="chart" style="background: ${color[d.index]}"></div><span>${d.data.name}</span>`
    })
    // 求外半径最大值
    let outerRadius = d3.min([width - padLeft - padRight, height - padTop - padBottom]) / 2
    let innerRadius = 0 // 设置内半径为0,画圆
    // 设置比例尺 range([innerRadius + outerRadius / 2.5, outerRadius / 1.5]) 输出为了美观可以进行一些改动
    let scale = d3.scaleLinear().domain([d3.min(_this.data, function (d) { return d.value }), d3.max(_this.data, function (d) { return d.value })]).range([innerRadius + outerRadius / 2, outerRadius / 1.2])
    // 绘制弧
    let arcs = svg.selectAll('.arcs')
      .data(pie)
      .enter()
      .append('path')
      .attr('transform', 'translate(' + (padLeft + (width - padLeft - padRight) / 2) + ',' + (padTop + (height - padTop - padBottom) / 2) + ')')
      .attr('fill', function (d, i) { return color[d.index] })
    // 添加动画
    arcs.transition()
      .duration(function (d) { return 200 })
      .ease(d3.easeLinear)
      .delay(function (d, i) {
        return d.index * 200
      })
      .attrTween('d', function (d, i) {
        let arc = d3.arc()
          .innerRadius(innerRadius) // 设置环的内半径,为0的时候则是圆
          .outerRadius(scale(d.value)) // 通过比例尺计算外半径
        let interpolate = d3.interpolate({startAngle: d.startAngle, endAngle: d.startAngle}, {startAngle: d.startAngle, endAngle: d.endAngle})
        return function (t) {
          return arc(interpolate(t))
        }
      })
    // 添加交互事件
    arcs.on('mouseover', function (d, i) {
      d3.select(this)
        .style('opacity', 0.7)
        .transition()
        .duration(200)
        .ease(d3.easeBounceOut)
        .attr('d', function (d, i) {
          let arc = d3.arc()
            .innerRadius(0) // 设置环的内半径,为0的时候则是圆
            .outerRadius(scale(d.value) * 1.2) // 通过比例尺计算外半径
          return arc(d)
        })
    })
    // 添加tooltips
    let toolTips = d3.select('body').append('div')
      .attr('class', 'toolTips')
      .style('opacity', 0)
      .style('position', 'absolute')
    arcs.on('mousemove', function (d) {
      let html = `<div class="clearfix"><div class="border" style="background:${color[d.index]}"></div><span>${d.data.name}:${d.data.value}</span></div>`
      let mouseX = d3.event.clientX + 30
      let mouseY = d3.event.clientY - 30
      // 如果你的style用了scoped,那你的样式应该写到App.vue中去,否则插入元素的样式不会生效
      toolTips.html(`<div class="tolTp">${html}</div>`)
        .style('opacity', 1)
        .style('left', mouseX + 'px')
        .style('top', mouseY + 'px')
    })
    arcs.on('mouseout', function (d, i) {
      d3.select(this)
        .style('opacity', 1)
        .transition()
        .duration(200)
        .ease(d3.easeLinear)
        .attr('d', function (d, i) {
          let arc = d3.arc()
            .innerRadius(0) // 设置环的内半径,为0的时候则是圆
            .outerRadius(scale(d.value)) // 通过比例尺计算外半径
          return arc(d)
        })
      toolTips.style('opacity', 0)
      toolTips.html('')
    })
  }
}
</script>

<style lang="less">
#rosePie{
  width: 600px;
  height: 600px;
  margin: 20px 20px;
  padding: 15px 25px;
  border:1px solid #cccccc;
  position: relative;
}
.tolTp{
  padding:8px 12px;
  background: rgba(0, 0, 0, 0.7);
  color:white;
  height: 20px;
  .border{
    width: 6px;
    height: 6px;
    border-radius: 3px;
    background: #83bff6;
    float: left;
    margin:7px 8px 7px 0;
  }
  span{
    float: left;
    line-height: 20px;
  }
}
.legend{
  float: left;
  .chart{
    width: 30px;
    height: 18px;
    margin: 11px 6px;
    background: rebeccapurple;
    float: left;
    border-radius: 4px;
    cursor: pointer;
    &:hover{
      opacity: 0.4;
    }
  }
  span{
    float: left;
    line-height: 40px;
    font-size: 12px;
    margin-right: 10px;
  }
}
</style>

前往低代码交流专区
更多推荐


 2
2 0
0- 0


 已为社区贡献19条内容

所有评论(0)