
内存检查工具valgrind介绍、安装与使用
一、valgrind介绍1、valgrind概述Valgrind是一套Linux下,开放源代码的仿真调试工具的集合。Valgrind由内核(core)以及基于内核的其他调试工具组成。内核类似于一个框架(framework),它模拟了一个CPU环境,并提供服务给其他工具;而其他工具则类似于插件 (plug-in),利用内核提供的服务完成各种特定的内存调试任务。Valgrind的体系结构如下...
零、valgrind原理介绍
关于内存泄漏动态检查的工具有很多,其中使用最广泛的可能就是valgrind了。
面向应用,valgrind是内存调试(例如排查内存泄漏)十分得力的工具。
1、工具分类
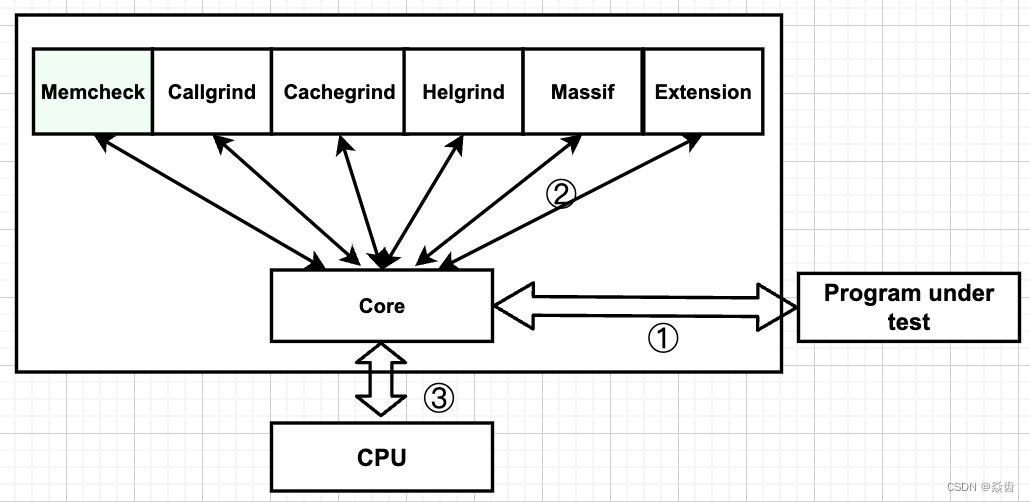
valgrind是一套Linux下开源的仿真调试工具集。Valgrind由内核(core)以及基于内核的其他调试工具组成。如下图所示,内核相当于一个框架,它模拟了一个CPU环境并提供服务给其他工具;其他工具则类似于插件(plugin),利用内核提供和的服务完成各种特定的内存调试任务。Valgrind的体系结构如下:
valgrind包括工具如下:
- memcheck :检查程序中的内存问题,如泄漏、越界、非法指针等。能够侦测到如下问题。 ①使用未初始化的内存 ②读/写已经被释放的内存 ③读/写内存越界 ④读/写不恰当的内存栈空间 ⑤内存泄漏 ⑥使用 malloc 和 free 不匹配 等。
- callgrind:检测程序代码的运行时间和调用过程,以及分析程序性能。和gprof不同,它不需要在编译源代码时附加特殊选项,但加上调试选项是推荐的。Callgrind收集程序运行时的一些数据,建立函数调用关系图,还可以有选择地进行cache模拟。在运行结束时,它会把分析数据写入一个文件。callgrind_annotate可以把这个文件的内容转化成可读的形式。
- cachegrind:cache分析器;分析CPU的cache命中率、丢失率,用于进行代码优化。它模拟CPU中的一级缓存和二级缓存,能够精确地指出程序中cache的丢失和命中。如果需要,它还能够为我们提供cache丢失次数、内存引用次数、以及每行代码、每个函数、每个模块、整个程序产生的指令数。这对优化程序有很大的帮助。
- helgrind:用于检查多线程程序的竞态条件。Helgrind寻找内存中被多个线程访问,而又没有加锁的区域,这些区域往往是线程之间失去同步的地方,而且会导致难以发掘的错误。Helgrind实现了名为“Eraser”的竞争检测算法,并做了进一步改进,减少了报告错误的次数。不过,Helgrind仍然处于实验阶段。
- DRD:另一个线程错误检测器。和helgrind类似但是使用了不同的技术,所以或许能找到helgrind找不到的问题。
- massif:堆栈分析器,指示程序中使用了多少堆内存等信息。
- DHAT:另一个堆分析器。它有助于理解块(block)的生命周期、块的使用和布局的低效等问题。
2、valgrind内存检测原理
valgrind能检测内存主要依赖于其两个全局表——Value表和Address表
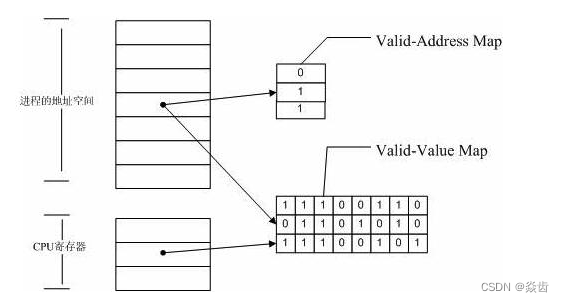
(1)Valid-Value 表:
对于进程的整个地址空间中的每一个字节(byte),都有与之对应的 8 个bits;对于 CPU 的每个寄存器,也有一个与之对应的bit 向量。这些 bits 负责记录该字节或者寄存器值是否具有有效的、已初始化的值。
(2)Valid-Address 表:
对于进程整个地址空间中的每一个字节(byte),还有与之对应的 1 个bit,负责记录该地址是否能够被读写。
(3)检测原理:
1)当要读写内存中某个字节时,首先检查这个字节对应的 A bit。如果该A bit显示该位置是无效位置(说明不能够读写),此时memcheck则报告读写错误。
2)内核(core)类似于一个虚拟的 CPU 环境,这样当内存中的某个字节被加载到真实的 CPU 中时,该字节对应的 V bit 也被加载到虚拟的 CPU 环境中。一旦寄存器中的值被用来产生内存地址或者该值能够影响程序输出,则 memcheck 会检查对应的V bits,如果该值尚未初始化(说明该寄存器中的值无效),则会报告使用未初始化内存错误。
3、Linux程序在内存中的布局(补充)
下图展示了一个典型的Linux C程序内存空间布局:

一个典型的Linux C程序内存空间由如下几部分组成:
(1)代码段(.text)。这里存放的是CPU要执行的指令。代码段是可共享的,相同的代码在内存中只会有一个拷贝,同时这个段是只读的,防止程序由于错误而修改自身的指令。
(2)初始化数据段(.data)。这里存放的是程序中需要明确赋初始值的变量,例如位于所有函数之外的全局变量:int val=100。需要强调的是,以上两段都是位于程序的可执行文件中,内核在调用exec函数启动该程序时从源程序文件中读入。
(3)未初始化数据段(.bss)。位于这一段中的数据,内核在执行该程序前,将其初始化为0或者null。例如出现在任何函数之外的全局变量:int sum;
(4)堆(Heap)。这个段用于在程序中进行动态内存申请,例如经常用到的malloc,new系列函数就是从这个段中申请内存。
(5)栈(Stack)。函数中的局部变量以及在函数调用过程中产生的临时变量都保存在此段中。
一、valgrind的安装
1、官网下载valgrind 官网
这里下载得到 valgrind-3.19.0.tar.bz2
2、解压安装包
tar -jxvf valgrind-3.19.0.tar.bz2

注:如果解压过程中出现类似"tar (child): bzip2: Cannot exec: No such file or directory"的报错。这个错误表明tar命令试图执行一个用于压缩或解压缩的bzip2程序,但是无法找到这个文件或目录。
解决方法:
确认bzip2是否已经安装在系统中。如果没有安装,需要安装它。对于不同的操作系统,安装方法会有所不同。
在Red Hat/CentOS上,可以使用sudo yum install bzip2命令安装。
3、安装
cd valgrind-3.19.0
./configure
make
make install


注:如果执行 ./configure 的时候提示没有gcc就安装一下gcc即可。即 "yum install gcc"
4、安装验证
valgrind --version如下图所示即为安装成功。

二、valgrind使用
1、基本选项——对任何工具可用
-tool=<name>:指定 valgrind 使用的工具。默认为 memcheck。
–help: 显示帮助信息。
-version:显示 valgrind 内核的版本,其中各个工具都有各自的版本。
–quiet:只打印错误信息。
–verbose:显示更加详细的信息, 增加错误数统计。
-trace-children=no|yes:指定是否跟踪子线程,默认为 no。
-track-fds=no|yes:指定是否跟踪打开的文件描述,默认为 no。
-time-stamp=no|yes:指定是否增加 时间戳 到 log,默认为 no。
-log-fd=<number>:指定 log 输出到的描述符文件,默认为 stderr。
-log-file=<filename>:将输出的信息写入到文件,该文件的文件名为 filename.PID,PID 为跟踪的进程号。
-log-file-exactly=<file>:指定输出 log 到的文件,该文件的文件名不加 PID。
-log-file-qualifier=<VAR>:指定某个环境变量的值来做为输出信息的文件名。
2、进阶选项——对任何工具可用
-num-callers=<number>:指定调用者的栈回溯信息的数量。
-error-limit=no|yes:如果太多错误,则停止显示新错误默认为 yes。
-error-exitcode=<number>:如果发现错误则返回错误代码,如果 number = 0 则是关闭该功能。
-db-attach=no|yes:当出现错误,valgrind会自动启动调试器gdb。默认为 no。
-db-command=<command>:启动调试器的命令行选项。
3、memcheck相关选项
-leak-check=no|summary|full:指定是否对 内存泄露 给出详细信息
-show-reachable=no|yes 指定是否显示在 内存泄漏检查 中可以检测到的块。默认为 no。
-xml=yes:将 log 以 xml 格式输出,只有 memcheck 可用。
4、memcheck输出分析
4.1、内存泄漏类型
- definitely lost:指确定泄露的内存,应尽快修复。当程序结束时如果一块动态分配的内存没有被释放且通过程序内的指针变量均无法访问这块内存则会报这个错误。
- indirectly lost:指间接泄露的内存,其总是与 definitely lost 一起出现,只要修复 definitely lost 即可恢复。当使用了含有指针成员的类或结构时可能会报这个错误
- possibly lost:指可能泄露的内存,大多数情况下应视为与 definitely lost 一样需要尽快修复。当程序结束时如果一块动态分配的内存没有被释放且通过程序内的指针变量均无法访问这块内存的起始地址,但可以访问其中的某一部分数据,则会报这个错误。
- still reachable:如果程序是正常结束的,那么它可能不会造成程序崩溃,但长时间运行有可能耗尽系统资源,因此笔者建议修复它。如果程序是崩溃(如访问非法的地址而崩溃)而非正常结束的,则应当暂时忽略它,先修复导致程序崩溃的错误,然后重新检测。
- suppressed:已被解决。出现了内存泄露但系统自动处理了。可以无视这类错误。
注:对于valgrind即便是“definitely lost”也不一定绝对准确,可能会存在误报的情况。特别是在使用某些库或者框架的时候。作为开发人员要仔细阅读valgrind的警告信息,检查相关位置的代码。
4.2、报告格式
问题报告模板一般如下;该模板用于大部分log,例如内存泄漏、非法访问等。
{问题描述}
at {地址、函数名、模块或代码行}
by {地址、函数名、代码行}
by ...{逐层依次显示调用堆栈,格式同上}
Address 0xXXXXXXXX {描述地址的相对关系}
4.3、报告输出文档格式
copyright 版权声明
异常读写报告
2.1 主线程异常读写
2.2 线程A异常读写报告
2.3 线程B异常读写报告
2... 其他线程
堆内存泄露报告
3.1 堆内存使用情况概述(HEAP SUMMARY)
3.2 确信的内存泄露报告(definitely lost)
3.3 可疑内存操作报告 (show-reachable=no关闭)
3.4 泄露情况概述(LEAK SUMMARY)
4.4、报告其他的点
提示一:“Conditional jump or move depends on uninitialised value(s)”
可能是某些变量未初始化!!
提示二:"Invalid write of size 4"
访问越界!!
4.5、使用注意事项
注意1:对于一直执行的程序,暂停valgrind要使用kill -10 pid,而不是kill -9
注意2:输出内容在退出时候才会写到报告文件memmory.txt中,而不是实时的刷进去。务必使用kill -10 ,否则memmory.txt并不能记录真正的泄漏位置。
三、valgrind使用举例
1、非法访问内存:
(1)程序如下:
#include <iostream>
#include <stdlib.h>
using namespace std;
void func(){
	int *x=(int*)malloc(10*sizeof(int));
	x[10]=0;
}
int main(){
	func();
	cout<<"done"<<endl;
	return 0;
}
(2)编译程序 g++ -g -o test test.cpp
(3)使用valgrind检测:valgrind ./test
(4)结果如下:

(5)分析:两个问题。1)第六行对堆内存的访问越界。 2)malloc动态申请的对内存没有释放。
2、使用未初始化内存:
(1)程序如下:
#include<iostream>
using namespace std;
int main(){
	int a[5];
	int i,s=0;
	a[0]=a[1]=a[3]=a[4]=0;
	for(i=0;i<5;++i)
		s+=a[i];
	if(s==33)
		cout<<"sum is 33"<<endl;
	else
		cout<<"sum is not 33"<<endl;
	return 0;
}
(2)结果如下:

3、内存读写越界:
(1)程序如下:
#include<iostream>
#include <stdlib.h>
using namespace std;
int main(){
	int len=4;
	int *pt=(int*)malloc(len*sizeof(int));
	int *p=pt;
	for(int i=0;i<len;++i)
		p++;
	*p=5;
	cout<<"The value of p is "<<*p<<endl;
	return 0;
}
(2)结果如下:

4、内容覆盖:
(1)程序如下:
#include <iostream>
#include <stdlib.h>
#include <string.h>
using namespace std;
int main(){
	char x[50];
	int i;
	for(i=0;i<50;++i)
		x[i]=i+1;
	strncpy(x+20,x,20);
	strncpy(x+20,x,21);
	strncpy(x+20,x,20);
	strncpy(x+20,x,21);
	x[39]='\0';
	strcpy(x,x+20);
	x[39]=39;
	x[40]='\0';
	strcpy(x,x+20);
	return 0;
}
(2)结果如下:

5、动态内存管理:
(1)程序如下:
#include<iostream>
#include <stdlib.h>
using namespace std;
int main(){
	int i;
	char *p=(char*)malloc(10);
	char *pt=p;
	for(i=0;i<10;++i){
		p[i]='z';
	}
	delete p;
	pt[1]='x';
	free(pt);
	return 0;
}
(2)结果如下:

6、忘记释放申请内存
显然可以看到,这里有两处malloc 且都没有对应的free操作。
#include <stdio.h>
#include <stdlib.h>
#include <string.h>
#include <malloc.h>

class cTest
{
private:
        char *m_pcData;


public:
        cTest();
        ~cTest();
};


cTest::cTest()
{
        m_pcData=(char*)malloc(10);
}


cTest::~cTest()
{
        if(m_pcData) delete m_pcData;
}

char *Fun1()//definitely lost
{
        char *pcTemp;


        pcTemp=(char*)malloc(10);
        return pcTemp;
}


char *Fun2()//still reachable
{
        static char *s_pcTemp=NULL;


        if(s_pcTemp==NULL) s_pcTemp=(char*)malloc(10);


        return NULL;
}


char *Fun3()//possibly lost
{
        static char *s_pcTemp;
        char *pcData;


        pcData=(char*)malloc(10);
        s_pcTemp=pcData+1;


        return NULL;
}


int Fun4()//definitely and indirectly lost
{
        cTest *pobjTest;


        pobjTest=new cTest();


        return 0;
}


char *Fun5()//possibly lost but no need of repair,repair the breakdown then no memory leak
{
        char *pcData;
        int i,*piTemp=NULL;


        pcData=(char*)malloc(10);
        pcData+=10;
        for(i=0;i<10;i++)
        {
                pcData--;
                *pcData=0;

                if(i==5) *piTemp=1;//create a breakdown
        }
        free(pcData);


        return NULL;
}


int main(int argc, char *argv[])
{
        printf("This program will create various memory leak,use valgrind to observe it.\n");
        printf("Following functions are bad codes,don\'t imitate.\n");
        //main函数的内存泄漏
        char *ptr;
        ptr = (char*) malloc(10);
        strcpy(ptr, "01234567890123456");
        printf("01234567890123456\n");
        printf("*ptr=%s\n",ptr);

    //各内部函数的泄漏
        printf("Fun1\n");
        Fun1();
        printf("Fun2\n");
        Fun2();
        printf("Fun3\n");
        Fun3();
        printf("Fun4\n");
        Fun4();
        printf("Fun5\n");
        Fun5();
        printf("end\n");


        return 0;
}
2、编译生产可执行文件:
g++ valgrindtest.cpp -o valgrindtest -g注意:编译的时候要指定生成调试信息;其实就是加上 "-g" 选项。否则是不会指出代码行数的。
3、valgrind生成分析结果
valgrind --tool=memcheck --leak-check=yes ./valgrindtest4、生成结果如下
[root@xxx/valgrindcode]# valgrind --tool=memcheck --leak-check=yes ./valgrindtest
==1046577== Memcheck, a memory error detector
==1046577== Copyright (C) 2002-2022, and GNU GPL'd, by Julian Seward et al.
==1046577== Using Valgrind-3.19.0 and LibVEX; rerun with -h for copyright info
==1046577== Command: ./valgrindtest
==1046577==
This program will create various memory leak,use valgrind to observe it.
Following functions are bad codes,don't imitate.
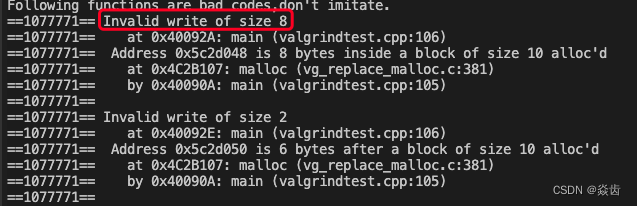
==1046577== Invalid write of size 8
==1046577== at 0x40092A: main (valgrindtest.cpp:106)
==1046577== Address 0x5c2d048 is 8 bytes inside a block of size 10 alloc'd
==1046577== at 0x4C2B107: malloc (vg_replace_malloc.c:381)
==1046577== by 0x40090A: main (valgrindtest.cpp:105)
==1046577==
==1046577== Invalid write of size 2
==1046577== at 0x40092E: main (valgrindtest.cpp:106)
==1046577== Address 0x5c2d050 is 6 bytes after a block of size 10 alloc'd
==1046577== at 0x4C2B107: malloc (vg_replace_malloc.c:381)
==1046577== by 0x40090A: main (valgrindtest.cpp:105)
==1046577==
01234567890123456
==1046577== Invalid read of size 1
==1046577== at 0x56A80C9: vfprintf (in /usr/lib64/libc-2.17.so)
==1046577== by 0x56AE538: printf (in /usr/lib64/libc-2.17.so)
==1046577== by 0x400953: main (valgrindtest.cpp:108)
==1046577== Address 0x5c2d04a is 0 bytes after a block of size 10 alloc'd
==1046577== at 0x4C2B107: malloc (vg_replace_malloc.c:381)
==1046577== by 0x40090A: main (valgrindtest.cpp:105)
==1046577==
==1046577== Invalid read of size 1
==1046577== at 0x56D5ADD: _IO_file_xsputn@@GLIBC_2.2.5 (in /usr/lib64/libc-2.17.so)
==1046577== by 0x56A8082: vfprintf (in /usr/lib64/libc-2.17.so)
==1046577== by 0x56AE538: printf (in /usr/lib64/libc-2.17.so)
==1046577== by 0x400953: main (valgrindtest.cpp:108)
==1046577== Address 0x5c2d050 is 6 bytes after a block of size 10 alloc'd
==1046577== at 0x4C2B107: malloc (vg_replace_malloc.c:381)
==1046577== by 0x40090A: main (valgrindtest.cpp:105)
==1046577==
==1046577== Invalid read of size 1
==1046577== at 0x56D5AF4: _IO_file_xsputn@@GLIBC_2.2.5 (in /usr/lib64/libc-2.17.so)
==1046577== by 0x56A8082: vfprintf (in /usr/lib64/libc-2.17.so)
==1046577== by 0x56AE538: printf (in /usr/lib64/libc-2.17.so)
==1046577== by 0x400953: main (valgrindtest.cpp:108)
==1046577== Address 0x5c2d04f is 5 bytes after a block of size 10 alloc'd
==1046577== at 0x4C2B107: malloc (vg_replace_malloc.c:381)
==1046577== by 0x40090A: main (valgrindtest.cpp:105)
==1046577==
==1046577== Invalid read of size 1
==1046577== at 0x4C35A46: __GI_mempcpy (vg_replace_strmem.c:1669)
==1046577== by 0x56D5A04: _IO_file_xsputn@@GLIBC_2.2.5 (in /usr/lib64/libc-2.17.so)
==1046577== by 0x56A8082: vfprintf (in /usr/lib64/libc-2.17.so)
==1046577== by 0x56AE538: printf (in /usr/lib64/libc-2.17.so)
==1046577== by 0x400953: main (valgrindtest.cpp:108)
==1046577== Address 0x5c2d04a is 0 bytes after a block of size 10 alloc'd
==1046577== at 0x4C2B107: malloc (vg_replace_malloc.c:381)
==1046577== by 0x40090A: main (valgrindtest.cpp:105)
==1046577==
==1046577== Invalid read of size 1
==1046577== at 0x4C35A38: __GI_mempcpy (vg_replace_strmem.c:1669)
==1046577== by 0x56D5A04: _IO_file_xsputn@@GLIBC_2.2.5 (in /usr/lib64/libc-2.17.so)
==1046577== by 0x56A8082: vfprintf (in /usr/lib64/libc-2.17.so)
==1046577== by 0x56AE538: printf (in /usr/lib64/libc-2.17.so)
==1046577== by 0x400953: main (valgrindtest.cpp:108)
==1046577== Address 0x5c2d04b is 1 bytes after a block of size 10 alloc'd
==1046577== at 0x4C2B107: malloc (vg_replace_malloc.c:381)
==1046577== by 0x40090A: main (valgrindtest.cpp:105)
==1046577==
*ptr=01234567890123456
Fun1
Fun2
Fun3
Fun4
Fun5
==1046577== Invalid write of size 4
==1046577== at 0x4008BB: Fun5() (valgrindtest.cpp:90)
==1046577== by 0x40099E: main (valgrindtest.cpp:120)
==1046577== Address 0x0 is not stack'd, malloc'd or (recently) free'd
==1046577==
==1046577==
==1046577== Process terminating with default action of signal 11 (SIGSEGV): dumping core
==1046577== Access not within mapped region at address 0x0
==1046577== at 0x4008BB: Fun5() (valgrindtest.cpp:90)
==1046577== by 0x40099E: main (valgrindtest.cpp:120)
==1046577== If you believe this happened as a result of a stack
==1046577== overflow in your program's main thread (unlikely but
==1046577== possible), you can try to increase the size of the
==1046577== main thread stack using the --main-stacksize= flag.
==1046577== The main thread stack size used in this run was 8388608.
==1046577==
==1046577== HEAP SUMMARY:
==1046577== in use at exit: 68 bytes in 7 blocks
==1046577== total heap usage: 7 allocs, 0 frees, 68 bytes allocated
==1046577==
==1046577== 10 bytes in 1 blocks are possibly lost in loss record 3 of 7
==1046577== at 0x4C2B107: malloc (vg_replace_malloc.c:381)
==1046577== by 0x400830: Fun3() (valgrindtest.cpp:57)
==1046577== by 0x400980: main (valgrindtest.cpp:116)
==1046577==
==1046577== 10 bytes in 1 blocks are possibly lost in loss record 4 of 7
==1046577== at 0x4C2B107: malloc (vg_replace_malloc.c:381)
==1046577== by 0x400892: Fun5() (valgrindtest.cpp:83)
==1046577== by 0x40099E: main (valgrindtest.cpp:120)
==1046577==
==1046577== 10 bytes in 1 blocks are definitely lost in loss record 6 of 7
==1046577== at 0x4C2B107: malloc (vg_replace_malloc.c:381)
==1046577== by 0x4007EC: Fun1() (valgrindtest.cpp:34)
==1046577== by 0x400962: main (valgrindtest.cpp:112)
==1046577==
==1046577== 18 (8 direct, 10 indirect) bytes in 1 blocks are definitely lost in loss record 7 of 7
==1046577== at 0x4C2B828: operator new(unsigned long) (vg_replace_malloc.c:422)
==1046577== by 0x40085D: Fun4() (valgrindtest.cpp:70)
==1046577== by 0x40098F: main (valgrindtest.cpp:118)
==1046577==
==1046577== LEAK SUMMARY:
==1046577== definitely lost: 18 bytes in 2 blocks
==1046577== indirectly lost: 10 bytes in 1 blocks
==1046577== possibly lost: 20 bytes in 2 blocks
==1046577== still reachable: 20 bytes in 2 blocks
==1046577== suppressed: 0 bytes in 0 blocks
==1046577== Reachable blocks (those to which a pointer was found) are not shown.
==1046577== To see them, rerun with: --leak-check=full --show-leak-kinds=all
==1046577==
==1046577== For lists of detected and suppressed errors, rerun with: -s
==1046577== ERROR SUMMARY: 30 errors from 12 contexts (suppressed: 0 from 0)
Segmentation fault7、常见问题
内存访问越界→"Invalid write"
内存泄漏→“definitely lost”

四、valgrind实际应用
openssl的hmac,使用时遗漏调用 HMAC_CTX_cleanup 函数;
关于hmac参见:openssl做HMAC实例(C++)_焱齿的博客-CSDN博客_openssl/hmac.h
以上代码实例中,将正确调用 HMAC_CTX_cleanup 和未调用HMAC_CTX_cleanup的可执行文件分别命令为hmacok、hmacno。valgrind分析输出如下:
前者:valgrind明确提示不存在内存泄漏——“ All heap blocks were freed -- no leaks are possible”。
/valgrind-3.19.0]# valgrind --tool=memcheck --leak-check=yes ./hmacok md5
==3365571== Memcheck, a memory error detector
==3365571== Copyright (C) 2002-2022, and GNU GPL'd, by Julian Seward et al.
==3365571== Using Valgrind-3.19.0 and LibVEX; rerun with -h for copyright info
==3365571== Command: ./hmacok md5
==3365571==
Algorithm HMAC encode succeeded!
mac length: 16
mac:18 6d 5a 41 aa 3f e  df 24 27 30 1a 1  ea f0 90
mac is freed!
==3365571==
==3365571== HEAP SUMMARY:
==3365571==     in use at exit: 0 bytes in 0 blocks
==3365571==   total heap usage: 8 allocs, 8 frees, 1,703 bytes allocated
==3365571==
==3365571== All heap blocks were freed -- no leaks are possible
==3365571==
==3365571== For lists of detected and suppressed errors, rerun with: -s
==3365571== ERROR SUMMARY: 0 errors from 0 contexts (suppressed: 0 from 0)
后者明确提示存在内存泄漏,如下:
/valgrind-3.19.0]# valgrind --tool=memcheck --leak-check=yes ./hmacno md5
==3367111== Memcheck, a memory error detector
==3367111== Copyright (C) 2002-2022, and GNU GPL'd, by Julian Seward et al.
==3367111== Using Valgrind-3.19.0 and LibVEX; rerun with -h for copyright info
==3367111== Command: ./hmacno md5
==3367111==
Algorithm HMAC encode succeeded!
mac length: 16
mac:18 6d 5a 41 aa 3f e  df 24 27 30 1a 1  ea f0 90
mac is freed!
==3367111==
==3367111== HEAP SUMMARY:
==3367111==     in use at exit: 300 bytes in 3 blocks
==3367111==   total heap usage: 8 allocs, 5 frees, 1,703 bytes allocated
==3367111==
==3367111== 100 bytes in 1 blocks are definitely lost in loss record 1 of 3
==3367111==    at 0x4C2B107: malloc (vg_replace_malloc.c:381)
==3367111==    by 0x511B6B7: CRYPTO_malloc (in /usr/lib64/libcrypto.so.1.0.2k)
==3367111==    by 0x51D87A1: EVP_DigestInit_ex (in /usr/lib64/libcrypto.so.1.0.2k)
==3367111==    by 0x51420FF: HMAC_Init_ex (in /usr/lib64/libcrypto.so.1.0.2k)
==3367111==    by 0x4016BD: HmacEncode(char const*, char const*, unsigned int, char const*, unsigned int, unsigned char*&, unsigned int&) (algo_hmac.cpp:47)
==3367111==    by 0x401315: main (main.cpp:23)
==3367111==
==3367111== 100 bytes in 1 blocks are definitely lost in loss record 2 of 3
==3367111==    at 0x4C2B107: malloc (vg_replace_malloc.c:381)
==3367111==    by 0x511B6B7: CRYPTO_malloc (in /usr/lib64/libcrypto.so.1.0.2k)
==3367111==    by 0x51D87A1: EVP_DigestInit_ex (in /usr/lib64/libcrypto.so.1.0.2k)
==3367111==    by 0x514215C: HMAC_Init_ex (in /usr/lib64/libcrypto.so.1.0.2k)
==3367111==    by 0x4016BD: HmacEncode(char const*, char const*, unsigned int, char const*, unsigned int, unsigned char*&, unsigned int&) (algo_hmac.cpp:47)
==3367111==    by 0x401315: main (main.cpp:23)
==3367111==
==3367111== 100 bytes in 1 blocks are definitely lost in loss record 3 of 3
==3367111==    at 0x4C2B107: malloc (vg_replace_malloc.c:381)
==3367111==    by 0x511B6B7: CRYPTO_malloc (in /usr/lib64/libcrypto.so.1.0.2k)
==3367111==    by 0x51D8CB2: EVP_MD_CTX_copy_ex (in /usr/lib64/libcrypto.so.1.0.2k)
==3367111==    by 0x51421E5: HMAC_Init_ex (in /usr/lib64/libcrypto.so.1.0.2k)
==3367111==    by 0x4016BD: HmacEncode(char const*, char const*, unsigned int, char const*, unsigned int, unsigned char*&, unsigned int&) (algo_hmac.cpp:47)
==3367111==    by 0x401315: main (main.cpp:23)
==3367111==
==3367111== LEAK SUMMARY:
==3367111==    definitely lost: 300 bytes in 3 blocks
==3367111==    indirectly lost: 0 bytes in 0 blocks
==3367111==      possibly lost: 0 bytes in 0 blocks
==3367111==    still reachable: 0 bytes in 0 blocks
==3367111==         suppressed: 0 bytes in 0 blocks
==3367111==
==3367111== For lists of detected and suppressed errors, rerun with: -s
==3367111== ERROR SUMMARY: 3 errors from 3 contexts (suppressed: 0 from 0)
注:这个提示和实际工程中的msg_record_read函数提示的一毛一样。服务查到的结果如下:
另外在记录一个spp定位内存泄漏的案例(uc_msg_record_write_svr)。
(0)如果是tke机器的话重新部署一个实例,注意不要有健康检查啥的。
(1)通过织云包脚本 admin/stop.sh all ,直接杀掉进程会自动重启
(2)不要启动 ctrl 进程,该进程会自动拉起 proxy 和 worker 进程
(3)手动启动 proxy 进程,bin路径下:(直接root用户操作) ./spp_uc_msg_record_read_svr_online_proxy ../etc/spp_proxy.xml
(4)手动启动 worker 进程,bin路径下 (注:感觉可以不用启动普通worker!!!) ./spp_uc_msg_record_read_svr_online_worker ../etc/spp_worker1.xml
(5) 利用 valgrind 启动其中一个 worker 进程 valgrind --tool=memcheck --leak-check=full --show-reachable=yes --log-file=memmory.txt ./spp_uc_msg_record_read_svr_online_worker ../etc/spp_worker1.xml
(6)执行后立刻观察memmory.txt 看不到有用信息,搜索"definitely lost"只能看到如下(说明要采集一段时间才可以)。
==66791== LEAK SUMMARY:
==66791== definitely lost: 0 bytes in 0 blocks
==66791== indirectly lost: 0 bytes in 0 blocks
==66791== possibly lost: 0 bytes in 0 blocks
==66791== still reachable: 21,126 bytes in 37 blocks
==66791== of which reachable via heuristic:
==66791== stdstring : 173 bytes in 3 blocks
==66791== newarray : 112 bytes in 2 blocks
==66791== suppressed: 0 bytes in 0 blocks
==66791==
(7)采集一段时间后停止valgrind起的进程在观察valgrind。千万注意两点:①停止程序不可以直接kill -9,否则memmory文件中可能看不到最后的信息;应该用kill -10 pid(kill -USR1 pid)。②指定后可能要多等待一会儿,不要捉急。
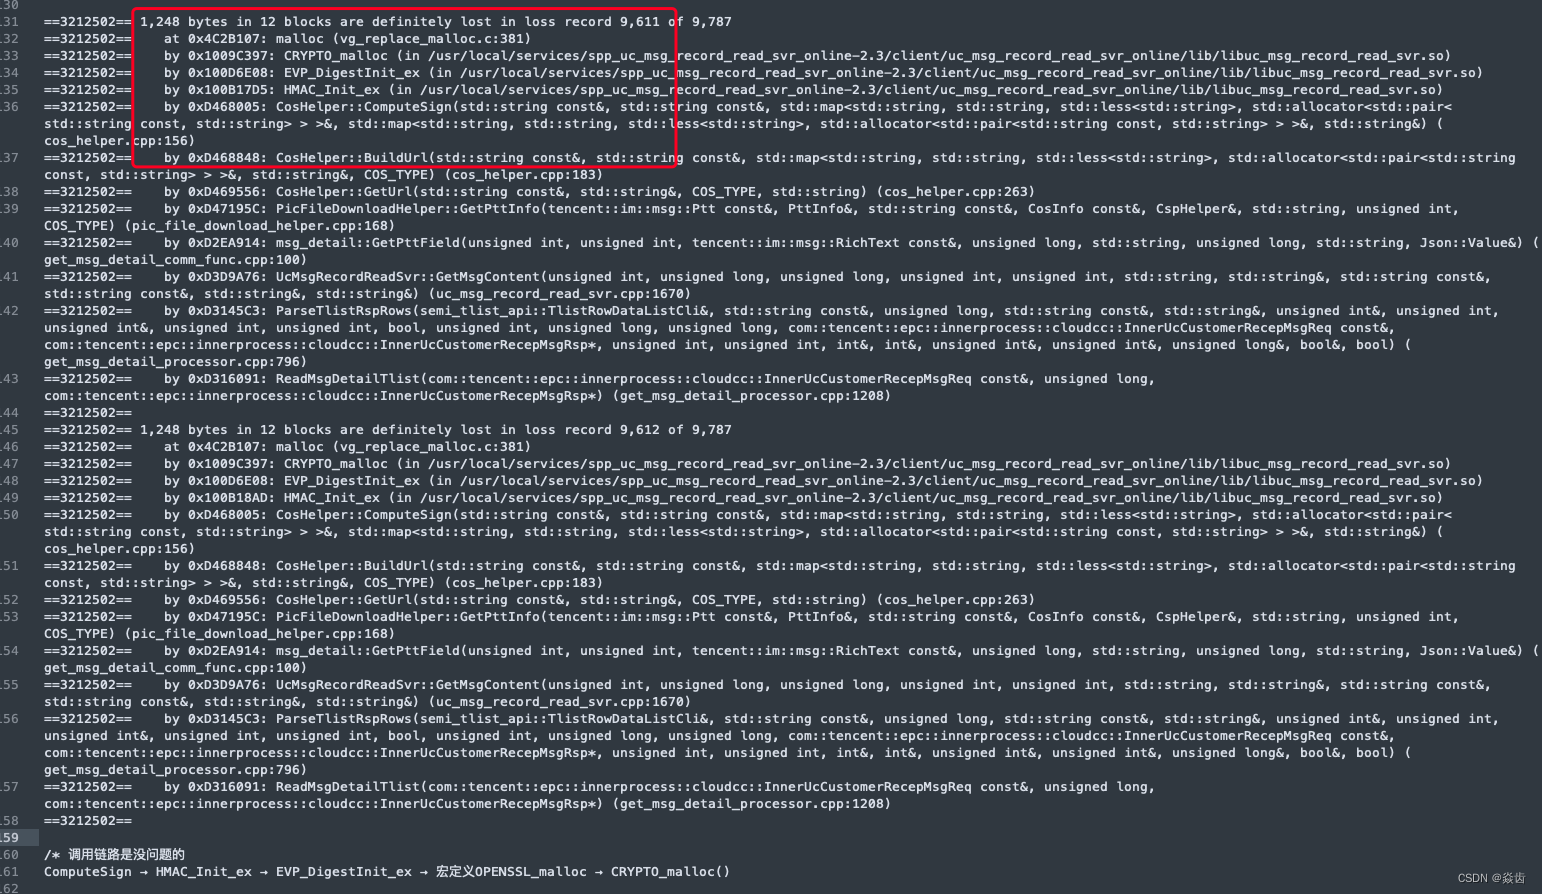
然后搜 ”definitely lost“ 就找到如下内存泄漏的位置了。 具体原因和上面的case类似就是在调用第三方库(此处为zlib)的时候并没有调用资源释放的函数就返回了。


旨在为数千万中国开发者提供一个无缝且高效的云端环境,以支持学习、使用和贡献开源项目。
更多推荐

 10
10 0
0- 0


 已为社区贡献11条内容

所有评论(0)