
R语言 tidyr包的三个重要函数:gather,spread,separate的用法和举例
tidyr是Hadley(Tidy Data的作者Hadley Wickham)写的非常有用、并且经常会使用到的包,常与dplyr包结合使用(这个包也是他写的)准备工作:首先安装tidyr包(一定要加引号,不然报错)install.packages("tidyr")载入tidyr(可以不加引号)library(tidyr)gather()gather函数类似于Exc...
tidyr是Hadley(Tidy Data的作者Hadley Wickham)写的非常有用、并且经常会使用到的包,常与dplyr包结合使用(这个包也是他写的)
准备工作:
首先安装tidyr包(一定要加引号,不然报错)
install.packages("tidyr")载入tidyr(可以不加引号)
library(tidyr)gather()
gather函数类似于Excel(2016起)中的数据透视的功能,能把一个变量名含有变量的二维表转换成一个规范的二维表(类似数据库中关系的那种表,具体看例子)
我们先 >?gather,看看官方文档说明:
gather {tidyr} R Documentation
Gather columns into key-value pairs.
Description
Gather takes multiple columns and collapses into key-value pairs, duplicating all other columns as needed. You use gather() when you notice that you have columns that are not variables.
Usage
gather(data, key = "key", value = "value", ..., na.rm = FALSE,
convert = FALSE, factor_key = FALSE)
Arguments
data
A data frame.
key, value
Names of new key and value columns, as strings or symbols.
This argument is passed by expression and supports quasiquotation (you can unquote strings and symbols). The name is captured from the expression with rlang::ensym() (note that this kind of interface where symbols do not represent actual objects is now discouraged in the tidyverse; we support it here for backward compatibility).
... (这是一个参数)
A selection of columns. If empty, all variables are selected. You can supply bare variable names, select all variables between x and z with x:z, exclude y with -y. For more options, see the dplyr::select() documentation. See also the section on selection rules below.
na.rm
If TRUE, will remove rows from output where the value column in NA.
convert
If TRUE will automatically run type.convert() on the key column. This is useful if the column types are actually numeric, integer, or logical.
factor_key
If FALSE, the default, the key values will be stored as a character vector. If TRUE, will be stored as a factor, which preserves the original ordering of the columns.
说明:
第一个参数放的是原数据,数据类型要是一个数据框;
下面传一个键值对,名字是自己起的,这两个值是做新转换成的二维表的表头,即两个变量名;
第四个是选中要转置的列,这个参数不写的话就默认全部转置;
后面还可以加可选参数na.rm,如果na.rm = TRUE,那么将会在新表中去除原表中的缺失值(NA)。
gather()举例
先构造一个数据框stu:
stu<-data.frame(grade=c("A","B","C","D","E"), female=c(5, 4, 1, 2, 3), male=c(1, 2, 3, 4, 5))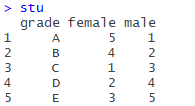 这个数据框什么意思就不说了,就是你想的那样,成绩-性别的人数分布。
变量中的female和male就是上面所说的变量名中含有了变量,female和male应该是“性别”这个变量的的变量值,下面的人数的变量名(或者说属性名)应该是“人数”,下面我们需要把原grade一列保留,去掉female和male两列,增加sex和count两列,值分别与原表对应起来,使用这个gather函数:
gather(stu, gender, count,-grade)结果如下,行列就转换过来了,第一个参数是原数据stu,二、三两个参数是键值对(性别,人数),第四个表示减去(除去grade列,就只转置剩下两列)
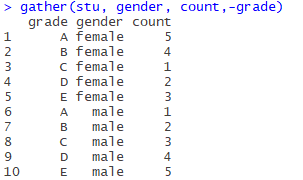
在原表中单看这两列是这样对应的:
(female, 5), (female, 4), (female, 1), (female, 2), (female, 3)
(male, 1), (male, 2), (male, 3), (male, 4), (male, 5),
就是把原变量名(属性名)做键(key),变量值做值(value)。
接下来就可以继续正常的统计分析了。
separate()
separate负责分割数据,把一个变量中就包含两个变量的数据分来(上例gather中是属性名也是一个变量,一个属性名一个变量),直接上例子:
separate()举例
构造一个新数据框stu2:
stu2<-data.frame(grade=c("A","B","C","D","E"),
                 female_1=c(5, 4, 1, 2, 3), male_1=c(1, 2, 3, 4, 5),
                 female_2=c(4, 5, 1, 2, 3), male_2=c(0, 2, 3, 4, 6))
跟上面stu很像,性别后面的1、2表示班级
我们先用刚才的gather函数转置一下:
stu2_new<-gather(stu2,gender_class,count,-grade)不解释了,跟上面一样,结果如下:
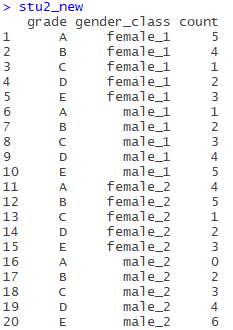
但这个表仍然不是个规范二维表,我们发现有一列(gender_class)的值包含多个属性(变量),使用separate()分开,separate用法如下:
separate(data, col, into, sep (= 正则表达式), remove =TRUE,convert = FALSE, extra = "warn", fill = "warn", ...)
第一个参数放要分离的数据框;
第二个参数放要分离的列;
第三个参数是分割成的变量的列(肯定是多个),用向量表示;
第四个参数是分隔符,用正则表达式表示,或者写数字,表示从第几位分开(文档里是这样写的:
If character, is interpreted as a regular expression. The default value is a regular expression that matches any sequence of non-alphanumeric values.
If numeric, interpreted as positions to split at. Positive values start at 1 at the far-left of the string; negative value start at -1 at the far-right of the string. The length of sep should be one less than into.)
后面参数就不一一说明了,可以自己看文档
现在我们要做的就是把gender_class这一列分开:
separate(stu2_new,gender_class,c("gender","class"))注意第三个参数是向量,用c()表示,第四个参数本来应该是"_",这里省略不写了(可能是下划线是默认分隔符?)
结果如下:

spread()
spread用来扩展表,把某一列的值(键值对)分开拆成多列。
spread(data, key, value, fill = NA, convert = FALSE, drop =TRUE, sep = NULL)
key是原来要拆的那一列的名字(变量名),value是拆出来的那些列的值应该填什么(填原表的哪一列)
下面直接上例子
spread()举例
构造数据框stu3:
name<-rep(c("Sally","Jeff","Roger","Karen","Brain"),c(2,2,2,2,2))
test<-rep(c("midterm","final"),5)
class1<-c("A","C",NA,NA,NA,NA,NA,NA,"B","B")
class2<-c(NA,NA,"D","E","C","A",NA,NA,NA,NA)
class3<-c("B","C",NA,NA,NA,NA,"C","C",NA,NA)
class4<-c(NA,NA,"A","C",NA,NA,"A","A",NA,NA)
class5<-c(NA,NA,NA,NA,"B","A",NA,NA,"A","C")
stu3<-data.frame(name,test,class1,class2,class3,class4,class5)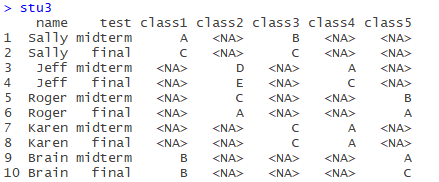
总共5门课,每个学生选两门,列出期中、期末成绩。
显然,原表是不整洁的数据,表头中含有变量(class1-5),所以先用gather函数。注意,这里面有很多缺失值,就可以用到上面所讲的na.rm=TRUE参数,自动去除有缺失值的记录(一条记录就是一行):

如果不写 na.rm=TRUE 的话,结果是这样的:
 (未截全)
(未截全)
分析学生没选课的“NA”成绩是没有意义的,所以这个情况下应该舍弃有缺失值的记录。
现在这个表看起来已经很整齐了,但是每个人都有四条记录,其中每门课除了test和grade的值不一样,姓名、课程是一样的,并且很多时候,我们需要分别对期中、期末成绩进行统计分析,那么现在这个表就不利于做分类统计了。
用spread函数将test列分来成midterm和final两列,这两列的值是选的两门课的成绩。
再重复一遍,第二个参数是要拆分的那一列的列名,第三个参数是扩展出的列的值应该来自原表的哪一列的列名。
stu3_new<-gather(stu3, class, grade, class1:class5, na.rm = TRUE)
spread(stu3_new,test,grade)
结果如下:
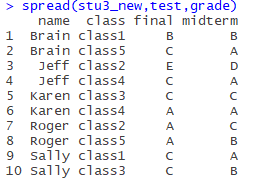
现在得到非常整齐的仅有10条数据的表,处理起来会更加方便。
最后补充一条,现在class列显得有些冗余,直接用数字似乎更简洁,使用readr包中的parse_number()提出数字(还用到了dplyr的mutate函数),下面放出代码:
install.packages("dplyr")
install.packages("readr")
library(readr)
library(dplyr)
mutate(spread(stu3_new,test,grade),class=parse_number(class))
最终结果:
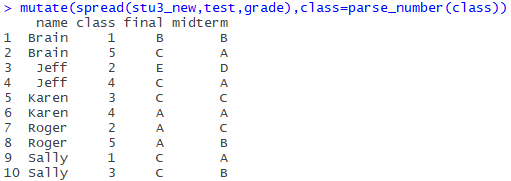
是不是整整齐齐很好看!!!(*╹▽╹*)

旨在为数千万中国开发者提供一个无缝且高效的云端环境,以支持学习、使用和贡献开源项目。
更多推荐


 57
57 0
0- 0


 已为社区贡献3条内容

所有评论(0)