
Latex基本表格绘制
latex基本表格绘制
一键AI生成摘要,助你高效阅读
问答
·
Latex基本表格绘制
1.基本格式
\documentclass{article}

\begin{document}

\begin{tabular}{cc}%一个c表示有一列,格式为居中显示(center)
(1,1)&(1,2)\\%第一行第一列和第二列  中间用&连接
(2,1)&(2,2)\\%第二行第一列和第二列  中间用&连接
\end{tabular}

\end{document}
效果如下:

2.添加竖线和横线
\documentclass{article}

\begin{document}

\begin{tabular}{|c|c|}% 通过添加 | 来表示是否需要绘制竖线
\hline  % 在表格最上方绘制横线
(1,1)&(1,2)\\
\hline  %在第一行和第二行之间绘制横线
(2,1)&(2,2)\\
\hline % 在表格最下方绘制横线
\end{tabular}

\end{document}
效果如下:

3.设置每一列的单元格格式
\documentclass{article}

\begin{document}

\begin{tabular}{|l|c|r|} %l(left)居左显示 r(right)居右显示 c居中显示
\hline
Name&Steve&Bill\\
\hline
Matlab&Mathmatica&Maple\\
\hline
\end{tabular}

\end{document}
效果如下:

4.常见的三线表
\documentclass[UTF8]{ctexart}
\begin{document}

\begin{tabular}{ccc}
\hline
姓名& 学号& 性别\\
\hline
Steve Jobs& 001& Male\\
Bill Gates& 002& Female\\
\hline
\end{tabular}

\end{document}
效果如下:

通常来说,我们会希望表格的第一根线和最后一根线比表格中的横线更粗一些。
booktabs 宏包为我们提供了这个功能,加载 booktabs 宏包之后可以使用 \toprule 和 \bottomrule 命令分别画出表格头和表格底的粗横线,而用 \midrule 画出表格中的横线。
\documentclass[UTF8]{ctexart}
\usepackage{booktabs} %需要加载宏包{booktabs}
\begin{document}

\begin{tabular}{ccc}
\toprule  %添加表格头部粗线
姓名& 学号& 性别\\
\midrule  %添加表格中横线
Steve Jobs& 001& Male\\
Bill Gates& 002& Female\\
\bottomrule %添加表格底部粗线
\end{tabular}

\end{document}
效果如下:

5.table环境
\documentclass[UTF8]{ctexart}
\usepackage{booktabs}
\begin{document}

\begin{table}[!htbp]
\centering
\caption{这是一张三线表}\label{tab:aStrangeTable}%添加标题 设置标签
\begin{tabular}{ccc}
\toprule
姓名& 学号& 性别\\
\midrule
Steve Jobs& 001& Male\\
Bill Gates& 002& Female\\
\bottomrule
\end{tabular}
%\caption{这是一张三线表}\label{tab:aStrangeTable}  标题放在这里也是可以的
\end{table}

\end{document}
{table}有若干可选参数 [!htbp]
h代表here,将表格排在当前文字位置
t 表示将表格放在下一页的 top (页首)
b 表示将表格放在当前页的 bottom (底部)
!表示忽略美观因素,尽可能按照参数指定的方式来处理表格浮动位置。
表格将会按照所给参数,依次尝试按照每个参数进行排版,当无法排版时,将会按照下一个参数
6.单元格合并
\documentclass[UTF8]{ctexart}
\begin{document}

\begin{table}[!htbp]
\centering
\begin{tabular}{|c|c|c|}
\hline
\multicolumn{3}{|c|}{学生信息}\\ % 用\multicolumn{3}表示横向合并三列
                        % |c|表示居中并且单元格两侧添加竖线 最后是文本
\hline
姓名&学号&性别\\
\hline
Jack& 001& Male\\
\hline
Angela& 002& Female\\
\hline
\end{tabular}
\caption{这是一张三线表}
\end{table}

\end{document}
效果如下:

\documentclass[UTF8]{ctexart}
\usepackage{multirow}
\begin{document}

\begin{table}[!htbp]
\centering
\begin{tabular}{|c|c|c|c|c|c|c|} %表格7列 全部居中显示
\hline
\multicolumn{7}{|c|}{事件}\\  %横向合并7列单元格  两侧添加竖线
\hline
\multirow{4}*{策略}&50&0&100&200&300&300\\  %纵向合并4行单元格
\cline{2-7}  %为第二列到第七列添加横线
&100&100&0&100&200&200\\
\cline{2-7}
&150&200&100&0&100&200\\
\cline{2-7}
&200&300&200&100&0&300\\
\hline
\end{tabular}
\end{table}

\end{document}

横向合并和纵向合并可以嵌套,代码如下:
\documentclass[UTF8]{ctexart}
\usepackage{multirow}
\begin{document}

\begin{table}[!htbp]
\centering
\begin{tabular}{|c|c|c|c|c|c|c|}
\hline

\multicolumn{2}{|c|}{ \multirow{2}*{$S_i$} }& \multicolumn{4}{c|}{事件} &\multirow{2}*{max}\\
\cline{3-6}
\multicolumn{2}{|c|}{}&50&100&150&200&\\
\hline
\multirow{4}*{策略}&50&0&100&200&300&300\\
\cline{2-7}
&100&100&0&100&200&200\\
\cline{2-7}
&150&200&100&0&100&200\\
\cline{2-7}
&200&300&200&100&0&300\\
\hline
\end{tabular}
\end{table}

\end{document}
效果如下:

7.斜线表头
需要使用{diagbox}宏包
\documentclass{UTF8}{ctexart}
\usepackage{diagbox} % 加载宏包
\begin{document}

\begin{table}[!htbp]
\centering
\begin{tabular}{|c|c|c|c|}
\hline
\diagbox{甲}{$\alpha_{i,j}$}{乙}&$\beta_1$&$\beta_2$&$\beta_3$\\ %添加斜线表头
\hline
$\alpha_1$&-4&0&-8\\
\hline
$\alpha_2$&3&2&4\\
\hline
$\alpha_3$&16&1&-9\\
\hline
$\alpha_4$&-1&1&7\\
\hline
\end{tabular}
\end{table}

\end{document}
效果如下:

8.其他(2018.11.23)
对于多行多列嵌套斜线表头的情况,不加参数会出现斜线不处于对角线位置的情况
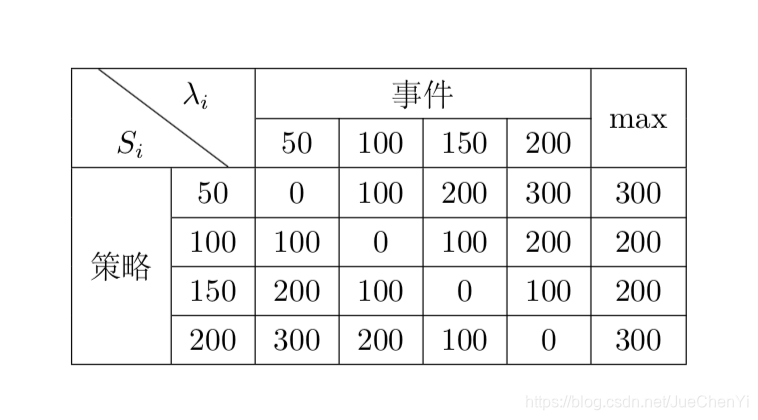
可以通过添加参数\diagbox[innerwidth=2cm](参数大小取决于列宽度)解决。
\documentclass{ctexart}
\usepackage{multirow}
\usepackage{diagbox} % 加载宏包
\begin{document}

\begin{table}[!htbp]
  \centering
  \begin{tabular}{|c|c|c|c|c|c|c|}
   \hline
   \multicolumn{2}{|c|}{\multirow{2}*{\diagbox[innerwidth=2cm]{$S_i$}{$\lambda_i$}}}& \multicolumn{4}{c|}{事件} &\multirow{2}*{max}\\
   \cline{3-6}
   \multicolumn{2}{|c|}{}&50&100&150&200&\\
   \hline
   \multirow{4}*{策略}&50&0&100&200&300&300\\
   \cline{2-7}
   &100&100&0&100&200&200\\
   \cline{2-7}
   &150&200&100&0&100&200\\
   \cline{2-7}
   &200&300&200&100&0&300\\
   \hline
  \end{tabular}
 \end{table}
\end{document}
效果如下:


旨在为数千万中国开发者提供一个无缝且高效的云端环境,以支持学习、使用和贡献开源项目。
更多推荐


 388
388 0
0- 0


 已为社区贡献1条内容

所有评论(0)