
MPAndroidChart开源图表库(一)之饼状图
MPAndroidChart是一款基于Android的开源图表库,MPAndroidChart不仅可以在Android设备上绘制各种统计图表,而且可以对图表进行拖动和缩放操作,应用起来非常灵活。MPAndroidChart同样拥有常用的图表类型:线型图、饼图、柱状图和散点图。GitHub地址:https://github.com/PhilJay/MPAndroidChart下面主要
一键AI生成摘要,助你高效阅读
问答
·
MPAndroidChart是一款基于Android的开源图表库,MPAndroidChart不仅可以在Android设备上绘制各种统计图表,而且可以对图表进行拖动和缩放操作,应用起来非常灵活。MPAndroidChart同样拥有常用的图表类型:线型图、饼图、柱状图和散点图。
GitHub地址:
https://github.com/PhilJay/MPAndroidChart
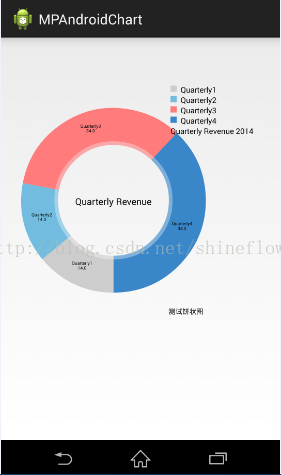
下面主要实现以下饼状图:
1.从上面的地址中下载最新mpandroidchartlibrary-2-0-8.jar包, 然后copy到项目的libs中
2.定义xml文件
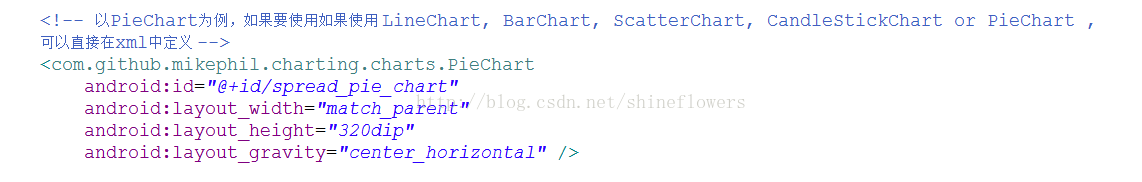
3.主要Java逻辑代码如下,注释已经都添加上了。
package com.jackie.mpandroidpiechart;

import java.util.ArrayList;

import com.github.mikephil.charting.charts.PieChart;
import com.github.mikephil.charting.components.Legend;
import com.github.mikephil.charting.components.Legend.LegendPosition;
import com.github.mikephil.charting.data.Entry;
import com.github.mikephil.charting.data.PieData;
import com.github.mikephil.charting.data.PieDataSet;

import android.support.v7.app.ActionBarActivity;
import android.graphics.Color;
import android.os.Bundle;
import android.util.DisplayMetrics;

public class MainActivity extends ActionBarActivity {

    private PieChart mChart;

    @Override
    protected void onCreate(Bundle savedInstanceState) {
        super.onCreate(savedInstanceState);
        setContentView(R.layout.activity_main);

        mChart = (PieChart) findViewById(R.id.spread_pie_chart);
        PieData mPieData = getPieData(4, 100);
        showChart(mChart, mPieData);
    }

    private void showChart(PieChart pieChart, PieData pieData) {
        pieChart.setHoleColorTransparent(true);

        pieChart.setHoleRadius(60f);  //半径
        pieChart.setTransparentCircleRadius(64f); // 半透明圈
        //pieChart.setHoleRadius(0)  //实心圆

        pieChart.setDescription("测试饼状图");

        // mChart.setDrawYValues(true);
        pieChart.setDrawCenterText(true);  //饼状图中间可以添加文字

        pieChart.setDrawHoleEnabled(true);

        pieChart.setRotationAngle(90); // 初始旋转角度

        // draws the corresponding description value into the slice
        // mChart.setDrawXValues(true);

        // enable rotation of the chart by touch
        pieChart.setRotationEnabled(true); // 可以手动旋转

        // display percentage values
        pieChart.setUsePercentValues(true);  //显示成百分比
        // mChart.setUnit(" €");
        // mChart.setDrawUnitsInChart(true);

        // add a selection listener
//      mChart.setOnChartValueSelectedListener(this);
        // mChart.setTouchEnabled(false);

//      mChart.setOnAnimationListener(this);

        pieChart.setCenterText("Quarterly Revenue");  //饼状图中间的文字

        //设置数据
        pieChart.setData(pieData);

        // undo all highlights
//      pieChart.highlightValues(null);
//      pieChart.invalidate();

        Legend mLegend = pieChart.getLegend();  //设置比例图
        mLegend.setPosition(LegendPosition.RIGHT_OF_CHART);  //最右边显示
//      mLegend.setForm(LegendForm.LINE);  //设置比例图的形状,默认是方形
        mLegend.setXEntrySpace(7f);
        mLegend.setYEntrySpace(5f);

        pieChart.animateXY(1000, 1000);  //设置动画
        // mChart.spin(2000, 0, 360);
    }

    /**
     *
     * @param count 分成几部分
     * @param range
     */
    private PieData getPieData(int count, float range) {

        ArrayList<String> xValues = new ArrayList<String>();  //xVals用来表示每个饼块上的内容

        for (int i = 0; i < count; i++) {
            xValues.add("Quarterly" + (i + 1));  //饼块上显示成Quarterly1, Quarterly2, Quarterly3, Quarterly4
        }

        ArrayList<Entry> yValues = new ArrayList<Entry>();  //yVals用来表示封装每个饼块的实际数据

        // 饼图数据
        /**
         * 将一个饼形图分成四部分, 四部分的数值比例为14:14:34:38
         * 所以 14代表的百分比就是14%
         */
        float quarterly1 = 14;
        float quarterly2 = 14;
        float quarterly3 = 34;
        float quarterly4 = 38;

        yValues.add(new Entry(quarterly1, 0));
        yValues.add(new Entry(quarterly2, 1));
        yValues.add(new Entry(quarterly3, 2));
        yValues.add(new Entry(quarterly4, 3));

        //y轴的集合
        PieDataSet pieDataSet = new PieDataSet(yValues, "Quarterly Revenue 2014"/*显示在比例图上*/);
        pieDataSet.setSliceSpace(0f); //设置个饼状图之间的距离

        ArrayList<Integer> colors = new ArrayList<Integer>();

        // 饼图颜色
        colors.add(Color.rgb(205, 205, 205));
        colors.add(Color.rgb(114, 188, 223));
        colors.add(Color.rgb(255, 123, 124));
        colors.add(Color.rgb(57, 135, 200));

        pieDataSet.setColors(colors);

        DisplayMetrics metrics = getResources().getDisplayMetrics();
        float px = 5 * (metrics.densityDpi / 160f);
        pieDataSet.setSelectionShift(px); // 选中态多出的长度

        PieData pieData = new PieData(xValues, pieDataSet);

        return pieData;
    }
} 
主要是一些基本属性和API的调用,具体每个API都有什么样的效果和作用,只能靠自己去尝试。后面还会陆陆续续为大家介绍MPAndroidChart其他类型的图表。

旨在为数千万中国开发者提供一个无缝且高效的云端环境,以支持学习、使用和贡献开源项目。
更多推荐

 28
28 0
0- 0


 已为社区贡献5条内容

所有评论(0)