

QCustomPlot开源库使用
QCustomPlot是用于绘图和数据可视化的Qt C ++小部件。它没有进一步的依赖关系,并且有据可查。该绘图库专注于制作美观,出版质量的2D绘图,图形和图表,以及为实时可视化应用程序提供高性能。看一下“ 设置”和“ 基本绘图”教程以开始使用。QCustomPlot可以导出为各种格式,例如矢量化的PDF文件和光栅化的图像(如PNG,JPG和BMP)。QCustomPlot是用于在应用程序内部显示
1.简介
QCustomPlot是用于绘图和数据可视化的Qt C ++小部件。它没有进一步的依赖关系,并且有据可查。该绘图库专注于制作美观,出版质量的2D绘图,图形和图表,以及为实时可视化应用程序提供高性能。看一下“ 设置”和“ 基本绘图”教程以开始使用。QCustomPlot可以导出为各种格式,例如矢量化的PDF文件和光栅化的图像(如PNG,JPG和BMP)。QCustomPlot是用于在应用程序内部显示实时数据以及为其他媒体生成高质量图的解决方案。
2.QCustomPlot下载与安装
参考:Qt Plotting Widget QCustomPlot - Setting Up
QCustomPlot 2.1.1官方文档:QCustomPlot 2.1.1 Documentation
QCustomPlot官网地址:Qt Plotting Widget QCustomPlot - Introduction
(1)下载下来的qcustomplot.h和qcustomplot.cpp加入工程中
(2)如果Qt版本在5.0以上,需要在.pro文件中的QT变量加上printsupport
(3)添加帮助文档
在下载的documentation文件夹下有个qcustomplot.qch文件,将它拷贝Qt的文档目录下(一般为C:\Users\用户名\AppData\Roaming\Microsoft\Windows\Start Menu\Programs\Qt\6.1.0\MinGW 8.1.0 (64-bit),会根据你的Qt版本号而做相应变动),然后在QtCreator——>工具——>选项——>帮助——>文档——>添加,选择qcustomplot.qch文件,确定,以后按F1就能跳转到QCustomPlot的帮助文档了。
3.QCustomPlot图层介绍
图层介绍:
QCustomPlot类管理着所有的图层,它默认自带了六个图层,分别是:
- 背景层background
- 网格层grid
- 绘图层main
- 坐标轴层axes
- 图例层legend
- overlay层overlay
依据层的顺序的不同,绘制的顺序也不同,越在底下的层越早绘制,当前层默认为绘图层main。下图中就是QCPAxisRect。

层有两种刷新模式:
- lmLogical:只用于渲染的顺序,并且与相邻的lmLogical层共享绘图缓存(注意这里的相邻,如果前一个层是lmBuffered模式,则会新建一个绘图缓存用于绘图)
- lmBuffered:拥有自己的绘图缓存,并且可以单独的刷新(调用QCPLayer::replot函数)
默认只有overlay层启用了lmBuffered单独绘制机制,其它层都共享一个绘图缓存,因为overlay层主要是用于存放悬浮与图表上的item项,需要频繁的刷新,启用了lmBuffered的层会多占用内存。
布局方式:
在QCustomPlot中,布局方式只有两种:
- QCPLayoutGrid:网格布局
- QCPLayoutInset:内嵌式布局, 这种布局的作用是把子元素与布局的边界对齐或者将其放置在布局内的任意位置(图例QCPLegend就被放置在此布局内),严格来说这个并不算布局
继承关系图如下所示:

这两种布局都继承自QCPLayout,而QCPLayout继承自QCPLayoutElement布局元素,所以一个布局可以包含另一个布局,布局内的元素都要继承自QCPLayoutElement。
4.QCustomPlot坐标轴的相关属性和方法
(1)QCustomPlot中的轴介绍:
QCustomPlot中由QCPAxis类管理QCustomPlot内的单个轴。通常不需要外部实例化。通过QCustomPlot::xAxis(底部)、QCustomPlot::yAxis(左侧)、QCustomPlot::xAxis2(顶部)和QCustomPlot::yAxis2(右侧)访问QCustomPlot的默认四个轴。其位置如下图所示:

(2)设置轴标签与清空轴标签:
设置轴标签利用setLabel函数:
void QCPAxis::setLabel const QString &str)
(3)设置轴范围:
设置轴的范围利用setRange函数:
void QCPAxis::setRange (double lower, double upper)
lower表示最小值,upper表示最大值
(4)设置使坐标轴自行缩放能够完全显示:
customPlot->graph(0)->rescaleAxes();
customPlot->graph(1)->rescaleAxes(true);
【注意】:
调用 customPlot->graph(0)->rescaleAxes();后范围被缩小了,曲线正好占满整个区域,但是调用customPlot->graph(0)->rescaleAxes(true)就不会有变化,因为区域不会缩小。
(5)设置轴与记号标签的显示与隐藏:
设置是否显示轴利用setVisible()函数:
void QCPLayer::setVisible(bool visible)
轴默认显示,如果不显示可以将bool设置为false
(6)设置是否显示记号标签:
利用setTickLabels()函数:
void QCPAxis::setTickLabels(bool show)
记号标签是在记号旁边绘制的数字。记号标签默认显示,如果不显示可以将bool设置为false
左轴和下轴默认显示轴和记号标签,右轴和上轴默认不显示轴和记号标签,如果想为右轴和上轴显示刻度但不显示标签,可以进行如下设置
设置后,还需要设置使左轴和下轴始终将其范围转移到上轴和右轴上,代码如下:
connect(customPlot->xAxis, SIGNAL(rangeChanged(QCPRange)), customPlot->xAxis2, SLOT(setRange(QCPRange)));
connect(customPlot->yAxis, SIGNAL(rangeChanged(QCPRange)), customPlot->yAxis2, SLOT(setRange(QCPRange)));
(7)设置轴的颜色
设置轴的颜色利用setBasePen函数:
void QCPAxis::setBasePen(const QPen & pen)
(8)设置背景颜色:
设置背景颜色利用setBackground函数:
void QPainter::setBackground(const QBrush &brush)
(9)设置背景图片:
设置背景图片同样利用setBackground()函数:
void QCPAxisRect::setBackground (const QPixmap & pm)
设置背景缩放使用setBackgroundScaled()函数:
void QCPAxisRect::setBackgroundScaled (bool scaled)
设置缩放图形的横纵比利用setBackgroundScaledMode函数:
void QCPAxisRect::setBackgroundScaledMode(Qt::AspectRatioMode mode)
该函数常与setBackgroundScaled函数集合使用,代表缩放图形时的横纵比。常用参数如下:

| 参数 | 描述 |
| Qt::IgnoreAspectRatio | 大小可自由缩放。不保留纵横比 |
| Qt::KeepAspectRatio | 在给定的矩形内,大小被缩放为一个尽可能大的矩形,保留纵横比 |
| Qt::KeepAspectRatioByExpanding | 将大小缩放为给定矩形外尽可能小的矩形,保留纵横比 |
(10)图例统一放在下方
代码示例:
// 设置图例行优先排列
customPlot->legend->setFillOrder(QCPLayoutGrid::foColumnsFirst);
// 设置六个图例自动换行
customPlot->legend->setWrap(6);
// 设置图例可见
customPlot->legend->setVisible(true);

// 设置图例位置,这里选择显示在QCPAxisRect下方,同理可设置显示在QCustomPlot中任意位置
customPlot->plotLayout()->addElement(1 , 0, customPlot->legend);
// 设置显示比例
customPlot->plotLayout()->setRowStretchFactor(1, 0.001);
// 设置边框隐藏
customPlot->legend->setBorderPen(Qt::NoPen);
运行效果如下所示:

(11)设置图例与曲线同步选中
首先,需要设置Qcustomplot的属性:
//设置基本坐标轴(左侧Y轴和下方X轴)可拖动、可缩放、曲线可选、legend可选、设置伸缩比例,使所有图例可见
CustomPlot->setInteractions(QCP::iRangeDrag|QCP::iRangeZoom| QCP::iSelectAxes | QCP::iSelectLegend | QCP::iSelectPlottables);
//设置legend只能选择图例
CustomPlot->legend->setSelectableParts(QCPLegend::spItems);
然后需要编写槽函数:
void MainWindow::selectionChanged()
{
  // make top and bottom axes be selected synchronously, and handle axis and tick labels as one selectable object:
  if (ui->customPlot->xAxis->selectedParts().testFlag(QCPAxis::spAxis) || ui->customPlot->xAxis->selectedParts().testFlag(QCPAxis::spTickLabels) ||
      ui->customPlot->xAxis2->selectedParts().testFlag(QCPAxis::spAxis) || ui->customPlot->xAxis2->selectedParts().testFlag(QCPAxis::spTickLabels))
  {
    ui->customPlot->xAxis2->setSelectedParts(QCPAxis::spAxis|QCPAxis::spTickLabels);
    ui->customPlot->xAxis->setSelectedParts(QCPAxis::spAxis|QCPAxis::spTickLabels);
  }
  // make left and right axes be selected synchronously, and handle axis and tick labels as one selectable object:
  if (ui->customPlot->yAxis->selectedParts().testFlag(QCPAxis::spAxis) || ui->customPlot->yAxis->selectedParts().testFlag(QCPAxis::spTickLabels) ||
      ui->customPlot->yAxis2->selectedParts().testFlag(QCPAxis::spAxis) || ui->customPlot->yAxis2->selectedParts().testFlag(QCPAxis::spTickLabels))
  {
    ui->customPlot->yAxis2->setSelectedParts(QCPAxis::spAxis|QCPAxis::spTickLabels);
    ui->customPlot->yAxis->setSelectedParts(QCPAxis::spAxis|QCPAxis::spTickLabels);
  }

  // 将图形的选择与相应图例项的选择同步
  for (int i=0; i<ui->customPlot->graphCount(); ++i)
  {
    QCPGraph *graph = ui->customPlot->graph(i);
    QCPPlottableLegendItem *item = ui->customPlot->legend->itemWithPlottable(graph);
    if (item->selected() || graph->selected())
    {
      item->setSelected(true);
      //注意:这句需要Qcustomplot2.0系列版本
      graph->setSelection(QCPDataSelection(graph->data()->dataRange()));
      //这句1.0系列版本即可
      //graph->setSelected(true);
    }
  }
}
最后,在主函数中将信号与槽进行连接:
connect(ui->customPlot, SIGNAL(selectionChangedByUser()), this, SLOT(selectionChanged()));selectionChangedByUser()信号在用户更改QCustomPlot中的选择后发出,例如通过单击。

5.QCustomPlot图例的相关设置
(1)显示图例:图例默认不显示,显示图例使用setVisible()函数
(2)设置图例位置:设置图例位置利用setInsetAlignment函数
| 位置 | 描述 |
| Qt::AlignLeft | 居左 |
| Qt::AlignHCenter | 水平居中 |
| Qt::AlighRight | 居右 |
| Qt::AlignTop | 居上 |
| Qt::AlignVCenter | 垂直居中 |
| Qt::AlignBottom | 居下 |
(3)设置边框隐藏:设置图例的边框利用setBorderPen()函数:
void QCPLegend::setBorderPen(const QPen & pen)
设置边框隐藏代码如下:
customPlot->legend->setBorderPen(Qt::NoPen);
(4)设置图例字体代码为:
customPlot->legend->setFont(QFont("Helvetica", 9));
(5)设置图例间隔代码为:
customPlot->legend->setRowSpacing(-3);
(6)设置图例文字颜色代码为:
customPlot->legend->setTextColor(TextColor);//设置图例文字颜色
(7)设置图例中图形与文字距离图例边框的距离代码为:
customPlot->legend->setMargins(QMargins(0,0,0,0));
(8)设置图例背景
设置图例背景为空白利用如下语句实现:
customPlot->legend->setBrush(QColor(255,255,255,0));//设置图例背景
(9)设置图例名称
设置第i条直线的名称:
customPlot->graph(i)->setName(names);//设置名称
6.QCustomPlot线条样式设置
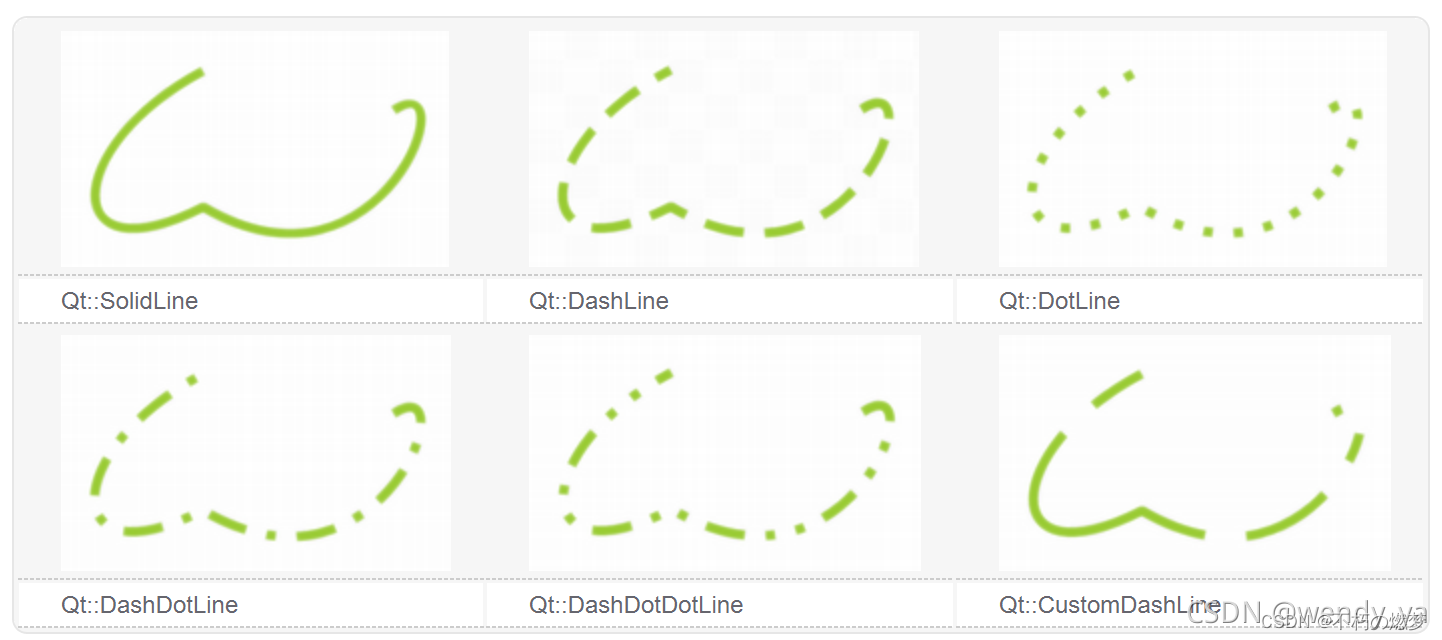
通过画笔QPen设置线的线宽、样式和颜色,以及线的样式,代码示例:
QPen pen;
pen.setWidth(3);//设置线宽
// 添加Graph,一条曲线使用一个Graph
customPlot->addGraph();
pen.setStyle(Qt::PenStyle::DashLine);//设置为虚线
pen.setColor(Qt::blue);//设置线条蓝色
customPlot->graph(0)->setPen(pen);
常见的线条样式如下:
设置线条样式填充,设置曲线和x轴围成区域的填充颜色利用画刷QBrush:
customPlot->graph(0)->setBrush(QBrush(QColor(0,0,255,50))); //蓝色,透明度50
7.QCustomPlot绘制曲线
    // 生成数据,画出的是抛物线
    QVector<double> x(101), y(101); //初始化向量x和y
    for (int i=0; i<101; ++i)
    {
      x[i] = i/50.0 - 1; // x范围[-1,1]
      y[i] = x[i]*x[i]; // y=x*x
    }
    ui->customPlot->addGraph();//添加数据曲线(一个图像可以有多个数据曲线)

    // graph(0);可以获取某个数据曲线(按添加先后排序)
    // setData();为数据曲线关联数据
    ui->customPlot->graph(0)->setData(x, y);
    ui->customPlot->graph(0)->setName("第一个示例");// 设置图例名称
    // 为坐标轴添加标签
    ui->customPlot->xAxis->setLabel("x");
    ui->customPlot->yAxis->setLabel("y");
    // 设置坐标轴的范围,以看到所有数据
    ui->customPlot->xAxis->setRange(-1, 1);
    ui->customPlot->yAxis->setRange(0, 1);
    ui->customPlot->legend->setVisible(true); // 显示图例
    // 重画图像
    ui->customPlot->replot();
8.QCustomlot绘制多条曲线
QCustomPlot *customPlot = ui->customPlot;//创建customPlot
//每条曲线都会独占一个graph()
customPlot->addGraph();
customPlot->graph(0)->setPen(QPen(Qt::blue)); // 曲线的颜色
customPlot->graph(0)->setBrush(QBrush(QColor(0, 0, 255, 20))); // 曲线与X轴包围区的颜色

customPlot->addGraph();//添加graph等价于添加一条新曲线
customPlot->graph(1)->setPen(QPen(Qt::red)); // 曲线的颜色
// 生成模拟数据点 (x-y0 第一条曲线, x-y1为第2条曲线):
QVector<double> x(251), y0(251), y1(251);
for (int i=0; i<251; ++i)
{
   x[i] = i;
   y0[i] = qExp(-i/150.0)*qCos(i/10.0); // 第一条曲线:y0衰减cos
   y1[i] = qExp(-i/150.0);              // 第二条曲线:y1衰减指数
}
// 边框右侧和上侧均显示刻度线,但不显示刻度值:
customPlot->xAxis2->setVisible(true);
customPlot->xAxis2->setTickLabels(false);
customPlot->yAxis2->setVisible(true);
customPlot->yAxis2->setTickLabels(false);
// 使上下两个X轴的范围总是相等,使左右两个Y轴的范围总是相等
connect(customPlot->xAxis, SIGNAL(rangeChanged(QCPRange)), customPlot->xAxis2, SLOT(setRange(QCPRange)));
connect(customPlot->yAxis, SIGNAL(rangeChanged(QCPRange)), customPlot->yAxis2, SLOT(setRange(QCPRange)));
// 把已存在的数据填充进graph的数据区
customPlot->graph(0)->setData(x, y0);
customPlot->graph(1)->setData(x, y1);
//自动调整XY轴的范围,以便显示出graph(0)中所有的点(下面会单独讲到这个函数)
customPlot->graph(0)->rescaleAxes();
//自动调整XY轴的范围,以便显示出graph(1)中所有的点
customPlot->graph(1)->rescaleAxes(true);
// 支持鼠标拖拽轴的范围、滚动缩放轴的范围,左键点选图层(每条曲线独占一个图层)
customPlot->setInteractions(QCP::iRangeDrag | QCP::iRangeZoom | QCP::iSelectPlottables);
// 立即刷新图像
ui->customPlot->replot();
9.QCustomPlot绘制散点图
可参考案例:Plot Screenshots: Line Style Demo和Screenshots: Scatter Style Demo。
    QCustomPlot *customPlot = ui->customPlot;//创建customPlot
    QPen pen;
    QStringList lineNames;
    lineNames << "lsNone" << "lsLine" << "lsStepLeft" << "lsStepRight" << "lsStepCenter" << "lsImpulse";

    for (int i = QCPGraph::lsNone; i <= QCPGraph::lsImpulse; ++i)
    {
        customPlot->addGraph();
        pen.setColor(QColor(qSin(i*1+1.2)*80+80, qSin(i*0.3+0)*80+80, qSin(i*0.3+1.5)*80+80));
        customPlot->graph()->setPen(pen);       // 设置画笔
        customPlot->graph()->setName(lineNames.at(i-QCPGraph::lsNone));//图例名称
        customPlot->graph()->setLineStyle((QCPGraph::LineStyle)i);  // 线段风格
        customPlot->graph()->setScatterStyle(QCPScatterStyle(QCPScatterStyle::ssCircle, 5));//设置散点形状
        customPlot->legend->setVisible(true); // 显示图例

        QVector<double> x(15), y(15);
        for (int j=0; j<15; ++j)
        {
            x[j] = j/15.0 * 5*3.14 + 0.01;
            y[j] = 7*qSin(x[j])/x[j] - (i-QCPGraph::lsNone)*5 + (QCPGraph::lsImpulse)*5 + 2;
        }
        customPlot->graph()->setData(x, y);//x和y
        customPlot->graph()->rescaleAxes(true);//自动调整XY轴的范围
    }
这里主要解释一下LineStyle和ScatterShape这两个函数。
(1)enum QCPGraph::LineStyle:定义图形线在绘图中的视觉表示方式。
| 参数 | 描述 |
| lsNone | 数据点不与任何线连接 |
| lsLine | 数据点由一条直线连接 |
| lsStepLeft | 将线绘制为阶跃,其中阶跃高度为左侧数据点的值 |
| lsStepRight | 将线绘制为阶跃,其中阶跃高度为右侧数据点的值 |
| lsStepCenter | 当阶跃位于两个数据点之间时,将线绘制为阶跃 |
| lsImpulse | 每个数据点由一条平行于值轴的线表示(脉冲线) |
(2)enum QCPScatterStyle::ScatterShape:设置散点形状
| 名称 | 形状 | 描述 |
| ssNone | 不绘制散点符号 | |
| ssDot | . | 单点 |
| ssCross | x | 交叉 |
| ssPlus | + | 加 |
| ssCircle | o | 圆圈 |
| ssDisc | ● | 实心圆圈(圈内为pen颜色) |
| … | … | … |
10.绘制柱状图
//绘制柱状图
QCPAxis *xAxis = ui->customPlot->xAxis;//x轴
QCPAxis *yAxis = ui->customPlot->yAxis;//y轴
QCPBars *bars = new QCPBars(xAxis, yAxis);  // 使用xAxis作为柱状图的x轴,yAxis作为y轴

bars->setAntialiased(false); // 为了更好的边框效果,关闭抗齿锯
bars->setName("Bars"); // 设置图例
bars->setPen(QPen(QColor(0, 160, 140).lighter(130))); // 设置柱状图的边框颜色
bars->setBrush(QColor(20,68,106));  // 设置柱状图的画刷颜色

QVector<double> ticks;
QVector<QString> labels;
ticks << 1 << 2 << 3 << 4 << 5 << 6 << 7;//轴的范围
labels << "A" << "B" << "C" << "D" << "E" << "F" << "G";//轴的刻度文字显示
QSharedPointer<QCPAxisTickerText> textTicker(new QCPAxisTickerText);
textTicker->addTicks(ticks, labels);
xAxis->setTicker(textTicker);        // 设置为文字轴
xAxis->setTickLabelRotation(60);     // 轴刻度文字旋转60度
xAxis->setSubTicks(false);           // 不显示子刻度
xAxis->setTickLength(0, 4);          // 轴内外刻度的长度分别是0,4,也就是轴内的刻度线不显示
xAxis->setRange(0, 8);               // 设置x轴范围
xAxis->setLabel("x");
xAxis->setUpperEnding(QCPLineEnding::esSpikeArrow);

yAxis->setRange(0, 12.1);          //设置y轴范围
yAxis->setPadding(35);             // 轴的内边距
yAxis->setLabel("y");
yAxis->setUpperEnding(QCPLineEnding::esSpikeArrow);
QVector<double> fossilData;
fossilData  << 10 << 9 << 2 << 5 << 7 << 4 << 1;//y轴坐标值
bars->setData(ticks, fossilData);
11.QCustomPlot将绘制的图形保存导出
QCustomPlot提供了四种常用的save接口,其格式如下:
saveBmp(const QString &fileName, int width, int height, double scale, int resolution, QCP::ResolutionUnit resolutionUnit);
saveJpg(const QString &fileName, int width, int height, double scale, int quality, int resolution, QCP::ResolutionUnit resolutionUnit);
savePng(const QString &fileName, int width, int height, double scale, int quality, int resolution, QCP::ResolutionUnit resolutionUnit);
savePdf(const QString &fileName, int width, int height, QCP::ExportPen exportPen, const QString &pdfCreator, const QString &pdfTitle);
代码示例:
    QString filename = QFileDialog::getSaveFileName();

    if( filename == "" ){
        QMessageBox::information(this,"fail","保存失败");
         return false;
     }
     else if( filename.endsWith(".png") ){
         QMessageBox::information(this,"success","成功保存为png文件");
         return ui->customPlot->savePng( filename, ui->customPlot->width(), ui->customPlot->height() );

     }
     else if( filename.endsWith(".jpg")||filename.endsWith(".jpeg") ){
         QMessageBox::information(this,"success","成功保存为jpg文件");
         return ui->customPlot->saveJpg( filename, ui->customPlot->width(), ui->customPlot->height() );

     }
     else if( filename.endsWith(".bmp") ){
         QMessageBox::information(this,"success","成功保存为bmp文件");
         return ui->customPlot->saveBmp( filename, ui->customPlot->width(), ui->customPlot->height() );

     }
     else if( filename.endsWith(".pdf") ){
         QMessageBox::information(this,"success","成功保存为pdf文件");
         return ui->customPlot->savePdf( filename, ui->customPlot->width(), ui->customPlot->height() );

     }
    else{
     //否则追加后缀名为.png保存文件
         QMessageBox::information(this,"success","保存成功,已默认保存为png文件");
         return ui->customPlot->savePng(filename.append(".png"), ui->customPlot->width(), ui->customPlot->height() );

    }

旨在为数千万中国开发者提供一个无缝且高效的云端环境,以支持学习、使用和贡献开源项目。
更多推荐


 24
24 0
0- 0


 已为社区贡献2条内容

所有评论(0)