
QCustomPlot实现鼠标点击显示曲线值
QCustomPlot提供了QCPItemTracer,通过配置可实现对显示曲线数值点的跟踪。曲线数值点的取值信息文本显示通过配置QCPItemText实现。文本显示框与数值跟踪点由直线箭头相连,通过配置QCPItemLine实现。if(plot){//tracer按照坐标值设置位置//设置label的父锚点。
·
1.功能描述
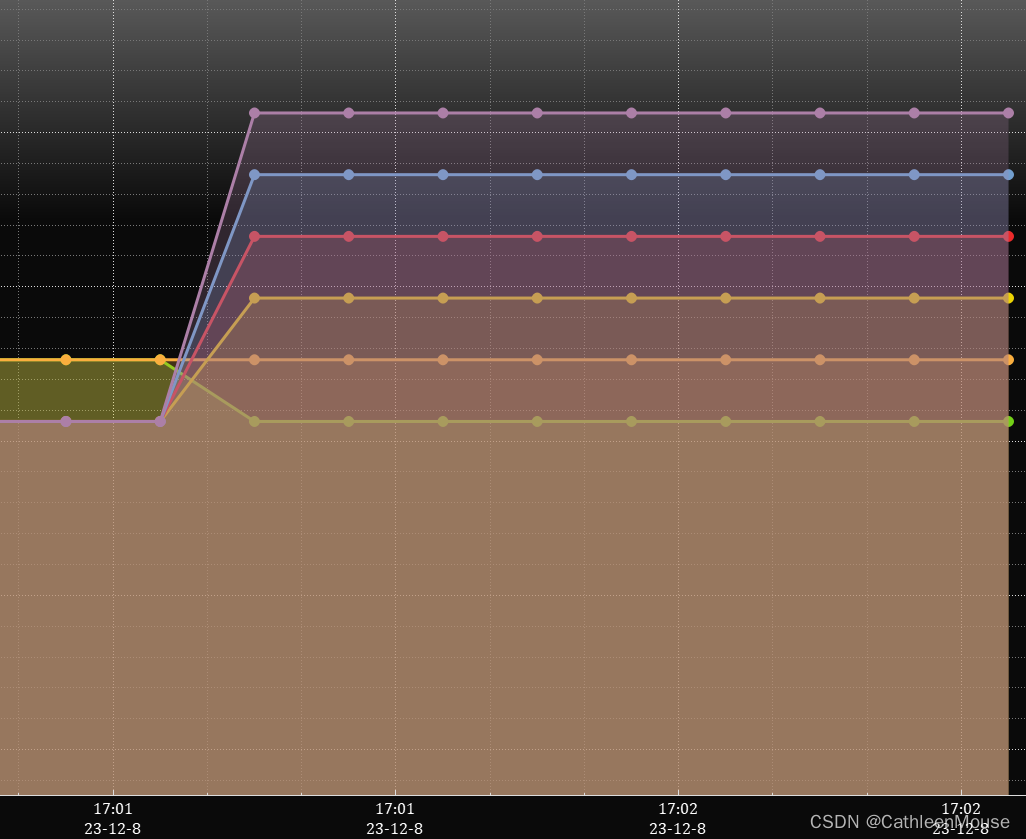
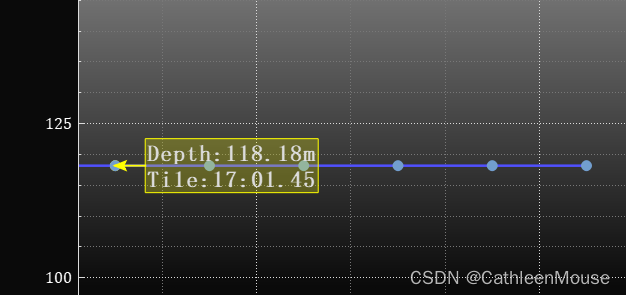
a.坐标内显示多条实时曲线,鼠标单击选择任一曲线,显示鼠标点击位置对应曲线上点的取值;
b.显示取值的文本框可根据选取点的位置调整在坐标内的显示位置。
2.开发环境
Win10 64bits+Qt5.12.9+MinGW7.3.0+qcustomplot2.1.0
3.参考文章
功能实现上参考文章(感谢大神文章指导):qt之QCustomPlot实现鼠标跟随显示xy坐标值,xy轴类型等
4.功能实现
a.自定义DataTracer
QCustomPlot提供了QCPItemTracer,通过配置可实现对显示曲线数值点的跟踪。曲线数值点的取值信息文本显示通过配置QCPItemText实现。文本显示框与数值跟踪点由直线箭头相连,通过配置QCPItemLine实现。自定义的DataTracer源码如下:
DataTracer.h

#include <QObject>
#include "qcustomplot.h"

class DataTracer : public QObject
{
    Q_OBJECT
public:
    explicit  DataTracer(QCustomPlot *plot);
    ~DataTracer();

    void setPen(const QPen &pen);
    void setBrush(const QBrush &brush);
    void setText(const QString &x_text,const QString &y_text);
    void setLabelStyle(const QFont &font, const QPen &pen, const QColor&color);
    void updatePosition(QCPGraph *graph, double xValue, double yValue);
    bool isVisible();
    void setVisible(bool visible);
    void updateShow();

private:
    QCustomPlot *plot;
    QCPGraph *graph;
    QCPItemTracer *tracer;
    QCPItemText *label;
    QCPItemLine *arrow;
    bool visible;
    double key;
    double value;
    QString label_key;
    QString label_value;
};
DataTracer.cpp

#include "datatracer.h"
#include <QFontMetrics>
#include <QRect>
#include <QDebug>

DataTracer::DataTracer(QCustomPlot *plot):
    plot(plot),
    visible(false)
{
    if(plot){
        this->tracer = new QCPItemTracer(plot);
        this->tracer->setStyle(QCPItemTracer::tsCircle);
        this->tracer->setPen(QPen(Qt::yellow));
        this->tracer->setBrush(QPen(Qt::yellow).color());
        this->tracer->setSize(10);
        //tracer按照坐标值设置位置
        this->tracer->position->setType(QCPItemPosition::ptPlotCoords);

        this->label = new QCPItemText(plot);
        this->label->setLayer("overlay");
       this-> label->setClipToAxisRect(false);
        this->label->setPadding(QMargins(2,2,2,2));
        //设置label的父锚点
        this->label->position->setParentAnchor(tracer->position);
        //设置父锚点后,该函数设置的数值类型会变为ptAbsolute
        //按像素点的方式设置label与父锚点的相对位置
        this->label->position->setCoords(0,0);
        //设置label与跟踪点的相对位置
        this->label->setPositionAlignment(Qt::AlignLeft|Qt::AlignVCenter);
        this->label->setFont(this->plot->xAxis->labelFont());
        this->label->setBrush(QBrush(QColor(255, 255, 0, 60)));
        this->label->setPen(QPen(Qt::yellow,1));
        this->label->setColor(this->plot->xAxis->basePen().color());
        //设置label文字的对齐方式
        this->label->setTextAlignment(Qt::AlignLeft|Qt::AlignVCenter);

        this->arrow = new QCPItemLine(plot);
        this->arrow->setLayer("overlay");
        this->arrow->setPen(QPen(Qt::yellow,2));
        this->arrow->setClipToAxisRect(false);
        //设置arrow起始端点样式
        this->arrow->setHead(QCPLineEnding::esSpikeArrow);
        //设置arrow终点位置为tracer点位置
        this->arrow->end->setParentAnchor(tracer->position);
        //设置arrow起始点位置为label的下端点(初始状态)
        this->arrow->start->setParentAnchor(label->bottom);
        //设置arrow的起始的相对位置(初始状态)
        this->arrow->start->setCoords(0, 0);
        //设置初始不显示
        this->setVisible(visible);
    }
}

DataTracer::~DataTracer()
{
    if(tracer){
        plot->removeItem(tracer);
    }
    if(label){
        plot->removeItem(label);
    }
    if(arrow){
        plot->removeItem(arrow);
    }
}

void DataTracer::setPen(const QPen &pen)
{
    this->tracer->setPen(pen);
    this->arrow->setPen(pen);
}

void DataTracer::setBrush(const QBrush &brush)
{
    this->tracer->setBrush(brush);
}

void DataTracer::setText(const QString &x_text, const QString &y_text)
{
    this->label_key = x_text;
    this->label_value = y_text;
    this->label->setText(this->label_value+'\n'+ this->label_key);
}

void DataTracer::setLabelStyle(const QFont &font, const QPen &pen, const QColor &color)
{
    this->label->setFont(font);
    this->label->setPen(pen);
    this->label->setColor(color);
}

void DataTracer::updatePosition(QCPGraph *graph, double xValue, double yValue)
{
    this->graph = graph;
    this->key = xValue;
    this->value = yValue;
    //设置tracer的位置
    this->tracer->position->setCoords(xValue, yValue);
    //坐标(xValue,yValue)对应像素点的位置
    QPointF pf = graph->coordsToPixels(xValue, yValue);
    //当前坐标区域对应像素点区域
    QRectF axis_rect(this->plot->axisRect(0)->topLeft(), this->plot->axisRect(0)->bottomRight());

    //获取显示字符对应的像素区域大小
    QFontMetrics fm(this->label->font());
    QRect r1=fm.boundingRect(this->label_key);
    QRect r2=fm.boundingRect(this->label_value);

    //依据父锚点位置,计算相对父锚点位置为(0,0)时label对应的绝对位置的像素区域
    QRectF label_rect;
    if(r1.width() >= r2.width()){
        label_rect.setTopLeft(QPointF(pf.x(), pf.y()-0.5*r1.height()-2));
        label_rect.setSize(QSizeF(r1.width(), 2*r1.height()+4));
    }else{
        label_rect.setTopLeft(QPointF(pf.x(), pf.y()-0.5*r2.height()-2));
        label_rect.setSize(QSizeF(r1.width(), 2*r2.height()+4));
    }

    //计算label显示的像素区域位置
    QRectF show_rect = label_rect;
    //假如label显示在tracer的正上方
    show_rect.translate(-0.5*label_rect.width()-2, -1.0*label_rect.height()-2);
    if(axis_rect.contains(show_rect)){
        //up
        this->arrow->start->setParentAnchor(label->bottom);
        this->label->position->setCoords(-0.5*label_rect.width()-2, -1.0*label_rect.height()-2);
//        qDebug()<<"up";
    }else{
        show_rect = label_rect;
        //假如label显示在tracer的正下方
        show_rect.translate(-0.5*label_rect.width()-2, 1.0*label_rect.height()+2);
        if(axis_rect.contains(show_rect)){
            //bot
            this->arrow->start->setParentAnchor(label->top);
            this->label->position->setCoords(-0.5*label_rect.width()-2, 1.0*label_rect.height()+2);
//            qDebug()<<"bot";
        }else{
            show_rect = label_rect;
            //假如label显示在tracer的右侧
            show_rect.translate(30, 0);
            if(axis_rect.contains(show_rect)){
                //right
                this->arrow->start->setParentAnchor(label->left);
                this->label->position->setCoords(30, 0);
//                qDebug()<<"right";
            }else{
                show_rect = label_rect;
                //假如label显示在tracer的左侧
                show_rect.translate(-1.0*label_rect.width()-30, 0);
                if(axis_rect.contains(show_rect)){
                    //left
                    this->arrow->start->setParentAnchor(label->right);
                    this->label->position->setCoords(-1.0*label_rect.width()-30, 0);
//                    qDebug()<<"left";
                }
            }
        }
    }
}

bool DataTracer::isVisible()
{
    return visible;
}

void DataTracer::setVisible(bool visible)
{
    this->visible = visible;
    this->tracer->setVisible(visible);
    this->label->setVisible(visible);
    this->arrow->setVisible(visible);
}

void DataTracer::updateShow()
{
    if(!visible)    return;

    QPointF pf = this->graph->coordsToPixels(this->key, this->value);
    QRectF axis_rect(this->plot->axisRect(0)->topLeft(), this->plot->axisRect(0)->bottomRight());

    if(axis_rect.contains(pf)){
        updatePosition(this->graph, this->key, this->value);
    }else{
        this->setVisible(false);
    }
}
b.使用DataTracer
MainDialog.h
private slots:
	void CustomPlotMousePress(QMouseEvent* event);
	void CustomPlotSelectionChanged();
private:
    void FindSelectedPoint(QCPGraph *graph, QPoint select_point, double &key, double &value);
private:
	QPoint m_PressedPoint;
	DataTracer *p_DataTracer;
MainDialog.cpp

//QCustomPlot配置
void MainDialog::InitDialog(){
	.......
    QSharedPointer<QCPAxisTickerDateTime> dateTicker(new QCPAxisTickerDateTime);
    dateTicker->setDateTimeFormat("hh:mm\nyy-M-d");
    ui->ChartWidget->xAxis->setTicker(dateTicker);
    ui->ChartWidget->xAxis->setRange(QCPAxisTickerDateTime::dateTimeToKey(QDateTime::currentDateTime()), this->m_ChartShowTimeLen, Qt::AlignRight);
    ui->ChartWidget->setInteractions(QCP::iRangeDrag | QCP::iSelectLegend | QCP::iRangeZoom  | QCP::iSelectPlottables | QCP::iSelectAxes);
    connect(ui->ChartWidget, SIGNAL(mousePress(QMouseEvent*)), this, SLOT(CustomPlotMousePress(QMouseEvent*)));
    connect(ui->ChartWidget, SIGNAL(selectionChangedByUser()), this, SLOT(CustomPlotSelectionChanged()));
    this->p_DataTracer = new DataTracer(ui->ChartWidget);
    .......
}

void MainDialog::CustomPlotMousePress(QMouseEvent* event){
	......
	this->m_PressedPoint = event->pos();
}

void MainDialog::CustomPlotSelectionChanged(){
    if (ui->ChartWidget->xAxis->selectedParts().testFlag(QCPAxis::spAxis) || ui->ChartWidget->xAxis->selectedParts().testFlag(QCPAxis::spTickLabels) || ui->ChartWidget->xAxis->selectedParts().testFlag(QCPAxis::spAxisLabel))
    {
      ui->ChartWidget->xAxis2->setSelectedParts(QCPAxis::spAxis | QCPAxis::spTickLabels | QCPAxis::spAxisLabel);
      ui->ChartWidget->xAxis->setSelectedParts(QCPAxis::spAxis | QCPAxis::spTickLabels | QCPAxis::spAxisLabel);
    }
    if (ui->ChartWidget->yAxis->selectedParts().testFlag(QCPAxis::spAxis) || ui->ChartWidget->yAxis->selectedParts().testFlag(QCPAxis::spTickLabels) || ui->ChartWidget->yAxis->selectedParts().testFlag(QCPAxis::spAxisLabel))
    {
      ui->ChartWidget->yAxis2->setSelectedParts(QCPAxis::spAxis | QCPAxis::spTickLabels | QCPAxis::spAxisLabel);
      ui->ChartWidget->yAxis->setSelectedParts(QCPAxis::spAxis | QCPAxis::spTickLabels | QCPAxis::spAxisLabel);
    }

    int graph_index = -1;
    bool haveselected=false;
    for (int i=0; i<ui->ChartWidget->graphCount(); ++i)
    {
      QCPGraph *graph = ui->ChartWidget->graph(i);
      graph->setVisible(false);
      QCPPlottableLegendItem *item = ui->ChartWidget->legend->itemWithPlottable(graph);
      if (item->selected() || graph->selected())
      {
          //仅显示当前被选中的曲线
          graph_index = i;
          haveselected=true;
          graph->setVisible(true);
          item->setSelected(true);
          graph->setSelection(QCPDataSelection(graph->data()->dataRange()));
      }
    }

    if(!haveselected){
        this->p_DataTracer->setVisible(false);
        for (int i=0; i<ui->ChartWidget->graphCount(); ++i){
            ui->ChartWidget->graph(i)->setVisible(true);
        }
    }else{
        this->p_DataTracer->setVisible(true);
        double key, value;
        FindSelectedPoint(ui->ChartWidget->graph(graph_index), this->m_PressedPoint, key, value);
        QDateTime time = QCPAxisTickerDateTime::keyToDateTime(key);
        this->p_DataTracer->setText(time.toString("Time:hh:mm.ss"), QString("Depth:%1m").arg(value, 0,'f',2));
        this->p_DataTracer->updatePosition(ui->ChartWidget->graph(graph_index), key, value);
    }
}

//查找距离鼠标点击位置最近的曲线上采样点的位置
void MainDialog::FindSelectedPoint(QCPGraph *graph, QPoint select_point, double &key, double &value)
{
    double temp_key, temp_value;
    graph->pixelsToCoords(select_point, temp_key, temp_value);
    QSharedPointer<QCPGraphDataContainer> tmpContainer;
    tmpContainer = graph->data();
    int low=0, high=tmpContainer->size();

    if(tmpContainer->size()<3){
        if(tmpContainer->size() == 1){
            key = tmpContainer->constBegin()->mainKey();
            value = tmpContainer->constBegin()->mainValue();
            return;
        }else if(tmpContainer->size() == 2){
            double diff1 = qAbs(tmpContainer->at(1)->mainKey()-temp_key);
            double diff2 = qAbs(tmpContainer->at(0)->mainKey()-temp_key);
            if(diff1 <= diff2){
                key =  tmpContainer->at(1)->mainKey();
                value = tmpContainer->at(1)->mainValue();
            }else{
                key = tmpContainer->at(0)->mainKey();
                value = tmpContainer->at(0)->mainValue();
            }
            return;
        }
    }

    while (high>low) {
        int mid = (low+high)>>1;
        if(temp_key == (tmpContainer->constBegin()+mid)->mainKey()){
            key = temp_key;
            value = (tmpContainer->constBegin()+mid)->mainValue();
            break;
        }else if(temp_key > (tmpContainer->constBegin()+mid)->mainKey()){
            low = mid;
        }else if(temp_key < (tmpContainer->constBegin()+mid)->mainKey()){
            high = mid;
        }
        if(high - low <= 1){
            double diff1 = qAbs((tmpContainer->constBegin()+high)->mainKey()-temp_key);
            double diff2 = qAbs((tmpContainer->constBegin()+low)->mainKey()-temp_key);
            if(diff1 <= diff2){
                key =  (tmpContainer->constBegin()+high)->mainKey();
                value = (tmpContainer->constBegin()+high)->mainValue();
            }else{
                key = (tmpContainer->constBegin()+low)->mainKey();
                value = (tmpContainer->constBegin()+low)->mainValue();
            }
            break;
        }
    }
}
c.实现效果
(1)初始显示
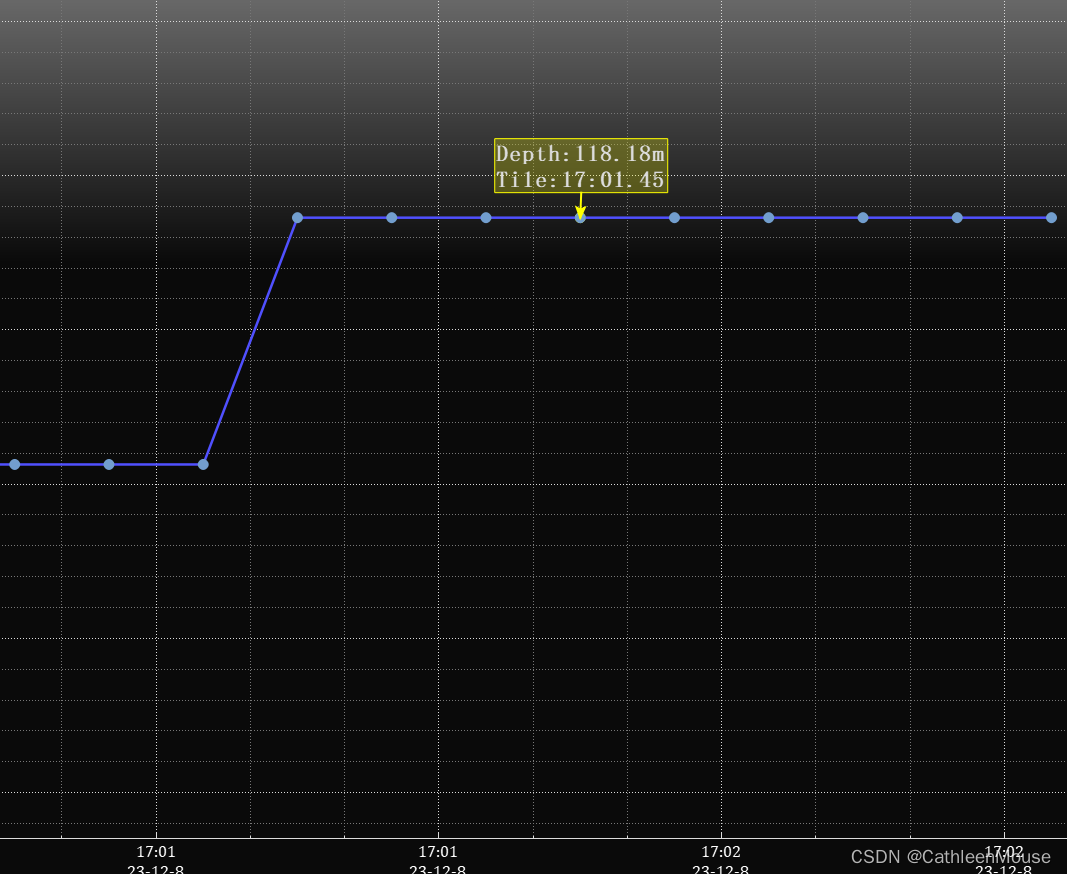
(2)点击曲线显示数值,默认在跟踪点正上方显示数值
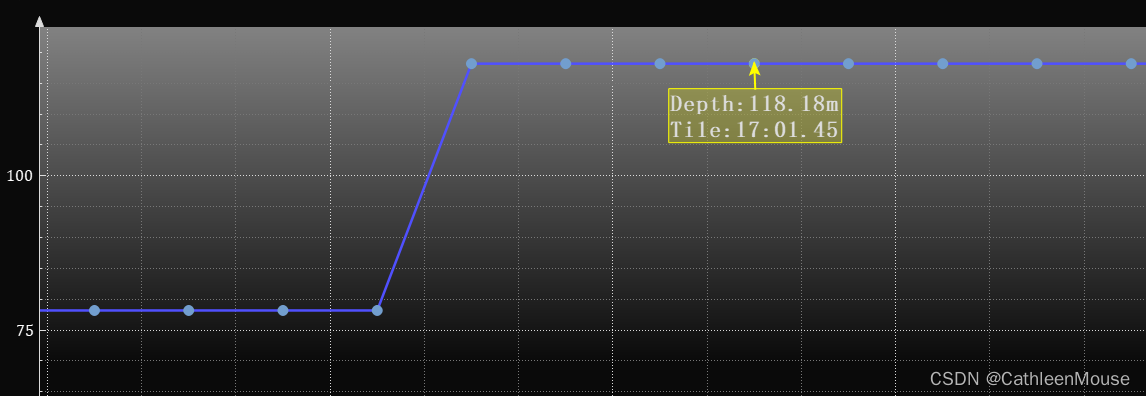
(3)拖动显示区域至上边界,数值显示框会转到跟踪点下方显示
(4)拖动显示区域至右边界,数值显示框会转到跟踪点左侧显示
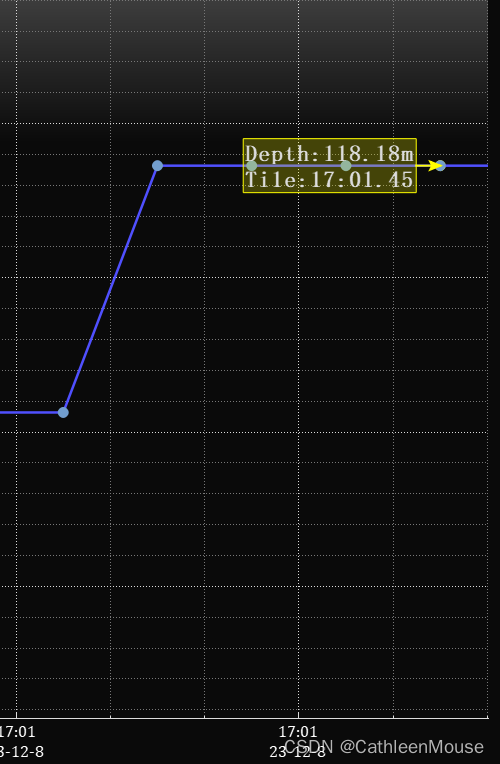
(5)拖动显示区域至左边界,数值显示框会转到跟踪点左侧显示

鸿蒙生态一站式服务平台。
更多推荐
 9
9 0
0- 0


 已为社区贡献1条内容

所有评论(0)