
prometheus监控nginx
下载prometheus[root@localhost ~]# wget https://github.com/prometheus/prometheus/releases/download/v2.28.0/prometheus-2.28.0.linux-amd64.tar.gz[root@localhost ~]# tar xf prometheus-2.28.0.linux-amd64.tar
下载prometheus
[root@localhost ~]# wget https://github.com/prometheus/prometheus/releases/download/v2.28.0/prometheus-2.28.0.linux-amd64.tar.gz
[root@localhost ~]# tar xf prometheus-2.28.0.linux-amd64.tar.gz
[root@localhost ~]# ls
anaconda-ks.cfg  prometheus-2.28.0.linux-amd64  prometheus-2.28.0.linux-amd64.tar.gz
安装prometheus
[root@localhost ~]# mv prometheus-2.28.0.linux-amd64 /usr/local/prometheus
[root@localhost ~]# useradd -r -M -s /sbin/nologin prometheus
[root@localhost ~]# mkdir -p /opt/data/prometheus
[root@localhost ~]# chown -R prometheus.prometheus /usr/local/prometheus /opt/data/prometheus
[root@localhost ~]# ll /usr/local/
total 0
drwxr-xr-x. 2 root       root         6 May 19  2020 bin
drwxr-xr-x. 2 root       root         6 May 19  2020 etc
drwxr-xr-x. 2 root       root         6 May 19  2020 games
drwxr-xr-x. 2 root       root         6 May 19  2020 include
drwxr-xr-x. 2 root       root         6 May 19  2020 lib
drwxr-xr-x. 3 root       root        17 Apr  3 20:06 lib64
drwxr-xr-x. 2 root       root         6 May 19  2020 libexec
drwxr-xr-x. 4 prometheus prometheus 132 Jun 22 00:01 prometheus
drwxr-xr-x. 2 root       root         6 May 19  2020 sbin
drwxr-xr-x. 5 root       root        49 Apr  3 20:06 share
drwxr-xr-x. 2 root       root         6 May 19  2020 src
[root@localhost ~]# ll /opt/data/
total 0
drwxr-xr-x. 2 prometheus prometheus 6 Jun 30 08:47 prometheus
编写service文件
[root@localhost ~]# vim /usr/lib/systemd/system/prometheus.service
[Unit]
Description=Prometheus
After=network.target

[Service]
Type=simple
Environment="GOMAXPROCS=4"
User=prometheus
Group=prometheus
ExecReload=/bin/kill -HUP $MAINPID
ExecStart=/usr/local/prometheus/prometheus \
  --config.file=/usr/local/prometheus/prometheus.yml \
  --storage.tsdb.path=/opt/data/prometheus \
  --storage.tsdb.retention=30d \
  --web.console.libraries=/usr/local/prometheus/console_libraries \
  --web.console.templates=/usr/local/prometheus/consoles \
  --web.listen-address=0.0.0.0:9090 \
  --web.read-timeout=5m \
  --web.max-connections=10 \
  --query.max-concurrency=20 \
  --query.timeout=2m \
  --web.enable-lifecycle
PrivateTmp=true
PrivateDevices=true
ProtectHome=true
NoNewPrivileges=true
LimitNOFILE=infinity
ReadWriteDirectories=/opt/data/prometheus
ProtectSystem=full

SyslogIdentifier=prometheus
Restart=always

[Install]
WantedBy=multi-user.target
启动prometheus
[root@localhost ~]# vim /usr/lib/systemd/system/prometheus.service
[root@localhost ~]# systemctl daemon-reload
[root@localhost ~]# systemctl enable prometheus && systemctl start prometheus
Created symlink /etc/systemd/system/multi-user.target.wants/prometheus.service → /usr/lib/systemd/system/prometheus.service.
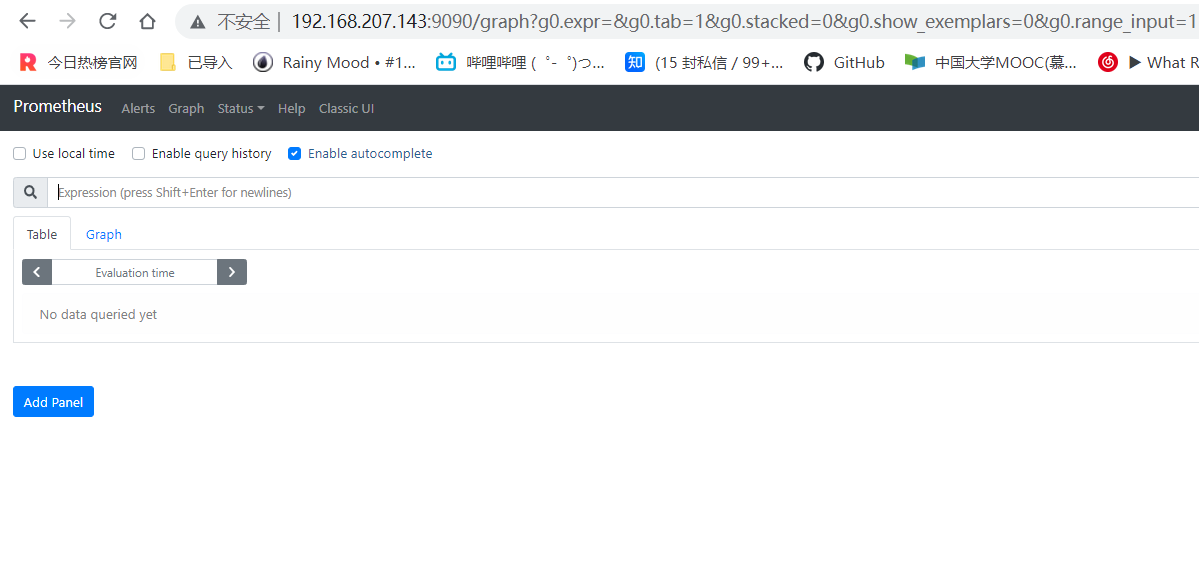
[root@localhost ~]# ss -antl
State Recv-Q Send-Q Local Address:Port Peer Address:Port Process
LISTEN 0 128 0.0.0.0:22 0.0.0.0:*
LISTEN 0 128 [::]:22 [::]:*
LISTEN 0 128 *:9090 *:*
AlertManager部署
下载AlertManager
[root@localhost ~]# wget https://github.com/prometheus/alertmanager/releases/download/v0.22.2/alertmanager-0.22.2.linux-amd64.tar.gz
[root@localhost ~]# tar xf alertmanager-0.22.2.linux-amd64.tar.gz
安装AlertManager
[root@localhost ~]# mv alertmanager-0.22.2.linux-amd64 /usr/local/alertmanager
[root@localhost ~]# chown -R prometheus.prometheus /usr/local/alertmanager
编写service文件
[root@localhost ~]# vim /usr/lib/systemd/system/alertmanager.service
[Unit]
Description=Alertmanager
After=network.target

[Service]
Type=simple
User=prometheus
Group=prometheus
ExecStart=/usr/local/alertmanager/alertmanager \
  --config.file=/usr/local/alertmanager/alertmanager.yml \
  --storage.path=/usr/local/alertmanager/data \
  --web.listen-address=0.0.0.0:9093 \
  --cluster.listen-address=0.0.0.0:9094 \
  --log.level=info \
  --log.format=logfmt
Restart=always

[Install]
WantedBy=multi-user.target
启动AlertManager
[root@localhost ~]# systemctl daemon-reload
[root@localhost ~]# systemctl enable alertmanager && systemctl start alertmanager
Created symlink /etc/systemd/system/multi-user.target.wants/alertmanager.service → /usr/lib/systemd/system/alertmanager.service.
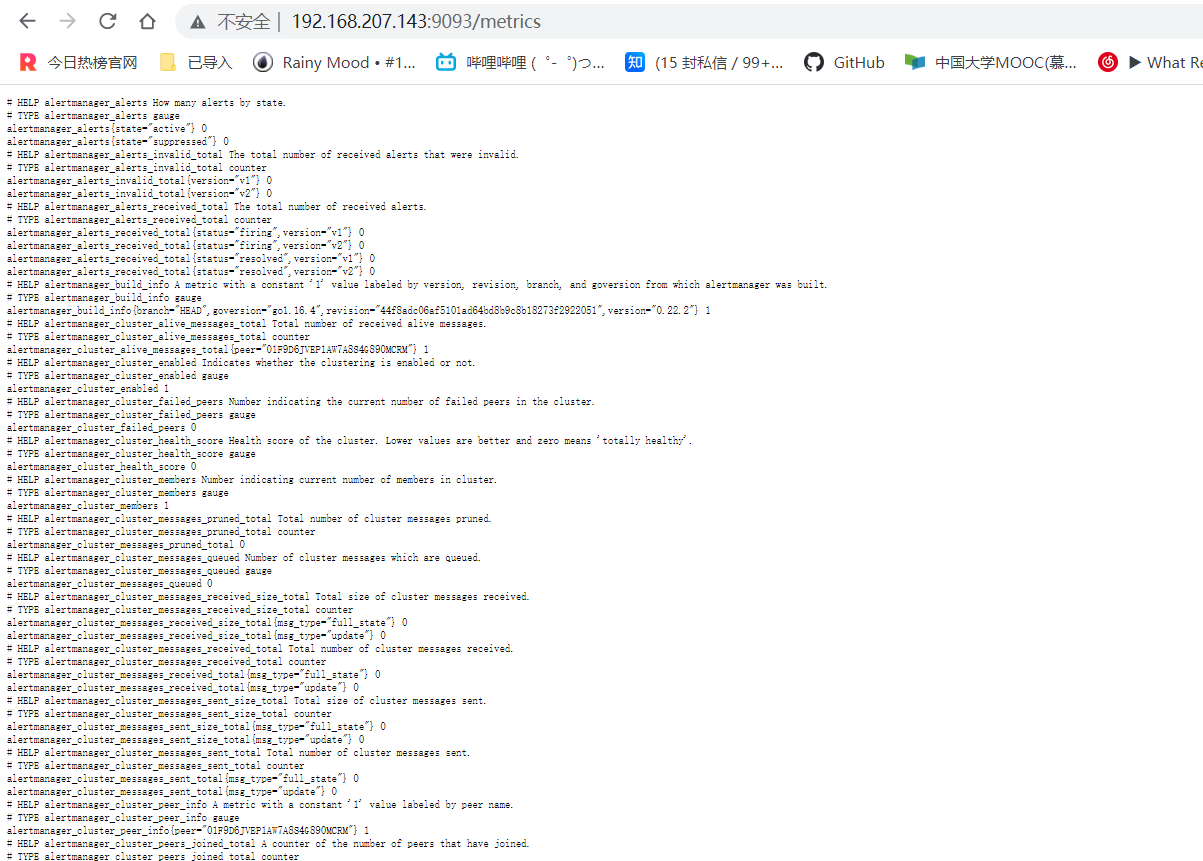
[root@localhost ~]# ss -antl
State Recv-Q Send-Q Local Address:Port Peer Address:Port Process
LISTEN 0 128 0.0.0.0:22 0.0.0.0:*
LISTEN 0 128 *:9093 *:*
LISTEN 0 128 *:9094 *:*
LISTEN 0 128 [::]:22 [::]:*
LISTEN 0 128 *:9090 *:*
配置prometheus
[root@localhost ~]# vim /usr/local/prometheus/prometheus.yml
 - job_name: 'alertmanager'
    static_configs:
    - targets: ['192.168.207.143:9093']
    [root@localhost ~]# systemctl restart prometheus
[root@localhost ~]# ss -antl
State      Recv-Q     Send-Q         Local Address:Port          Peer Address:Port     Process
LISTEN     0          128                  0.0.0.0:22                 0.0.0.0:*
LISTEN     0          128                        *:9093                     *:*
LISTEN     0          128                        *:9094                     *:*
LISTEN     0          128                     [::]:22                    [::]:*
LISTEN     0          128                        *:9090                     *:*

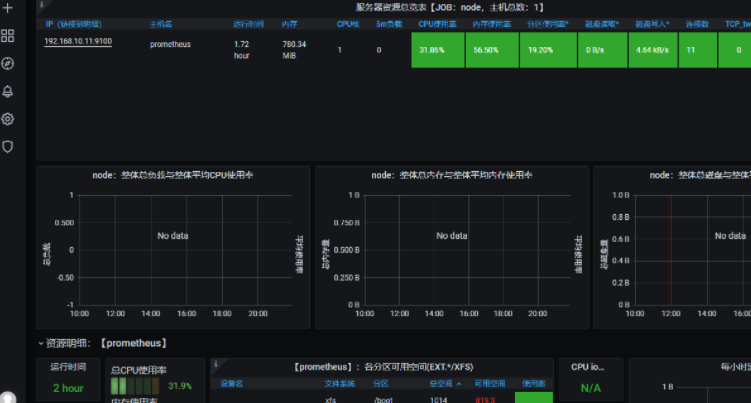
部署Node Exporter
node exporter 作用: 是收集操作系统的基本系统, 例如cpu, 内存, 硬盘空间等基本信息, 并对外提供api接口用于prometheus查询存储;
下载Node Exporter
[root@localhost ~]# wget https://github.com/prometheus/node_exporter/releases/download/v1.1.2/node_exporter-1.1.2.linux-amd64.tar.gz
[root@localhost ~]# tar xf node_exporter-1.1.2.linux-amd64.tar.gz
[root@localhost ~]# ls
alertmanager-0.22.2.linux-amd64.tar.gz  node_exporter-1.1.2.linux-amd64.tar.gz
anaconda-ks.cfg                         prometheus-2.28.0.linux-amd64.tar.gz
node_exporter-1.1.2.linux-amd64
安装Node Exporter
[root@localhost ~]# mv node_exporter-1.1.2.linux-amd64 /usr/local/node_exporter
[root@localhost ~]# chown -R prometheus.prometheus /usr/local/node_exporter
编写service文件
[root@localhost ~]# vim /usr/lib/systemd/system/node_exporter.service
[Unit]
Description=node_exporter
After=network.target

[Service]
Type=simple
User=prometheus
Group=prometheus
ExecStart=/usr/local/node_exporter/node_exporter \
  --web.listen-address=0.0.0.0:9100 \
  --web.telemetry-path=/metrics \
  --log.level=info \
  --log.format=logfmt
Restart=always

[Install]
WantedBy=multi-user.target
启动Node Exporter
[root@localhost ~]# systemctl daemon-reload
[root@localhost ~]# systemctl enable node_exporter && systemctl start node_exporter
Created symlink /etc/systemd/system/multi-user.target.wants/node_exporter.service → /usr/lib/systemd/system/node_exporter.service.
[root@localhost ~]# ss -antl
State      Recv-Q     Send-Q         Local Address:Port          Peer Address:Port     Process
LISTEN     0          128                  0.0.0.0:22                 0.0.0.0:*
LISTEN     0          128                        *:9093                     *:*
LISTEN     0          128                        *:9094                     *:*
LISTEN     0          128                        *:9100                     *:*
LISTEN     0          128                     [::]:22                    [::]:*
LISTEN     0          128                        *:9090                     *:*
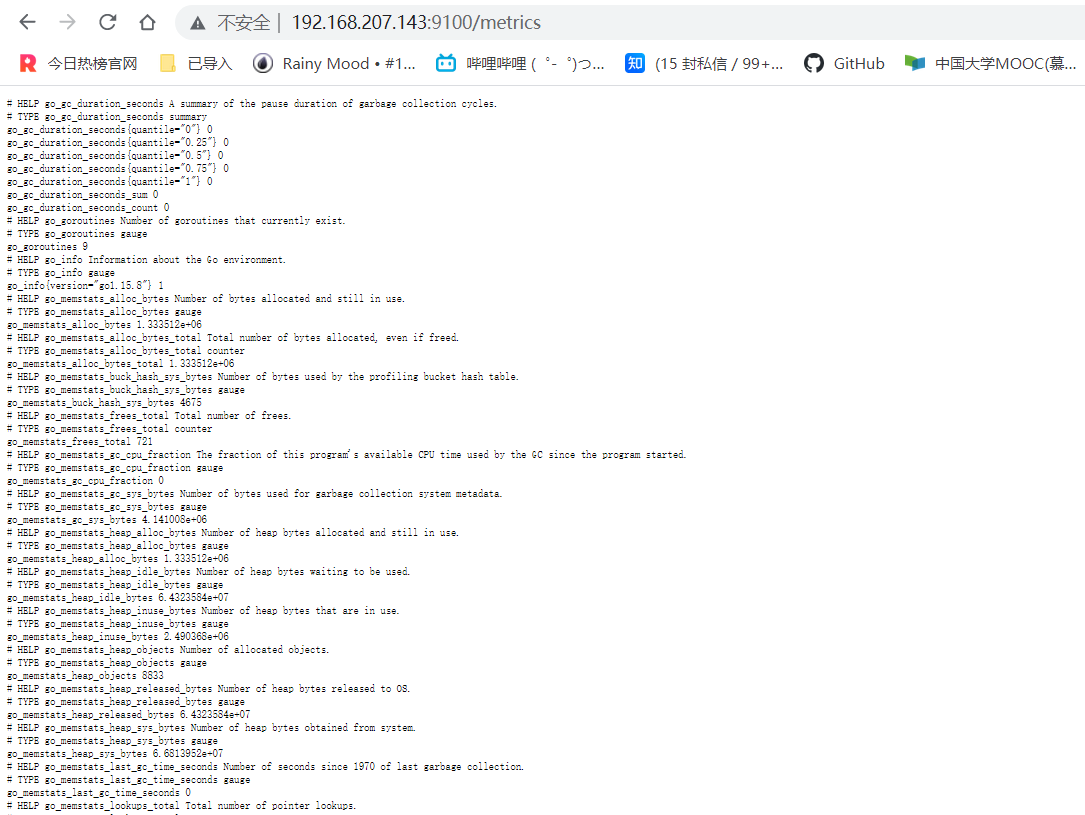
node exporter展示了prometheus可以拉取的指标,包括在输出中更下方的各种系统指标(带有前缀node_)。要查看这些指标(以及帮助和类型信息):
配置prometheus
[root@localhost ~]# vim /usr/local/prometheus/prometheus.yml
- job_name: 'prometheus'

    # metrics_path defaults to '/metrics'
    # scheme defaults to 'http'.

    static_configs:
    - targets: ['localhost:9090']
  - job_name: 'node'
    static_configs:
    - targets: ['192.168.207.143:9100']
[root@localhost ~]# systemctl restart prometheus
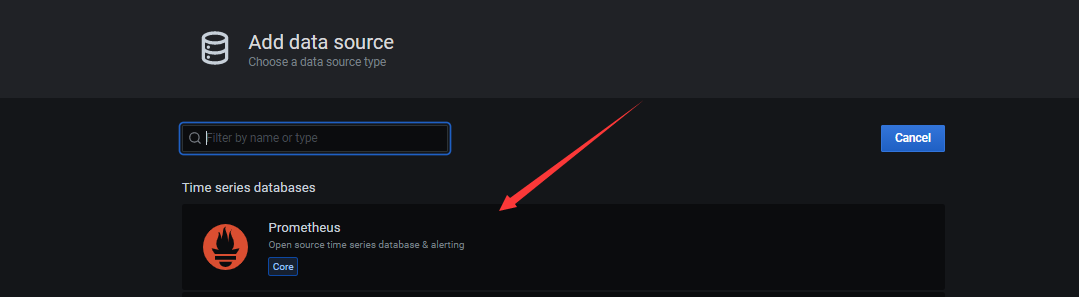
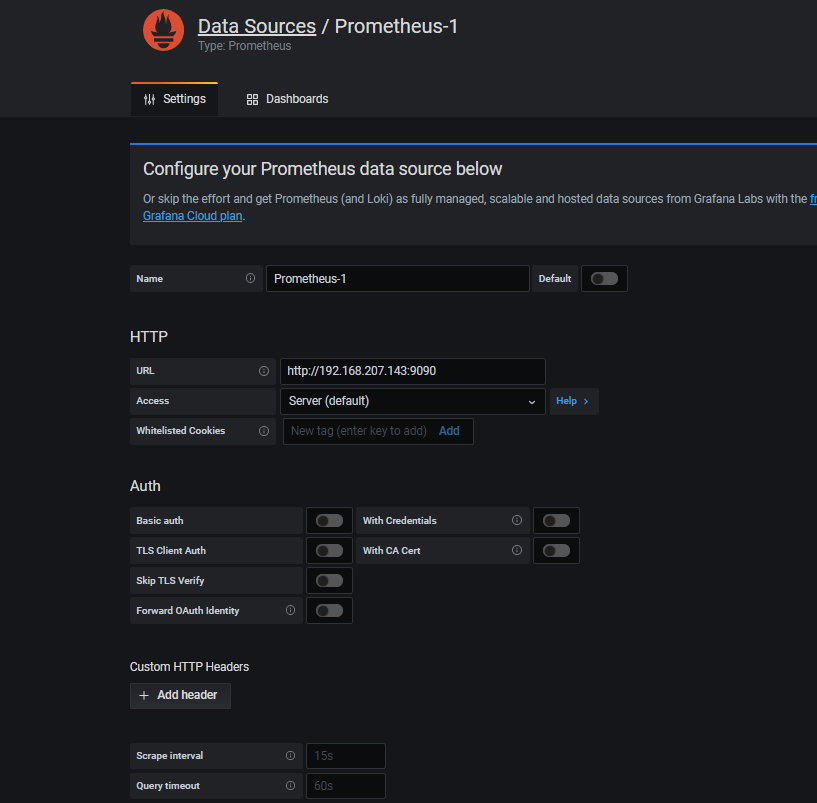
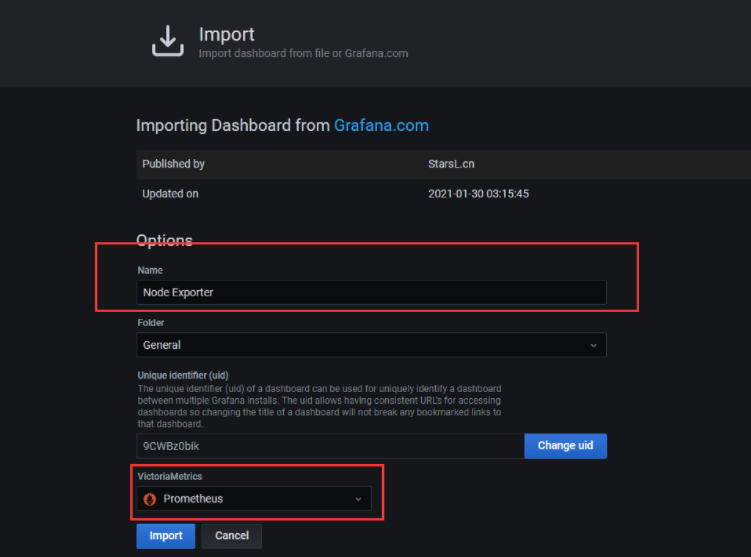
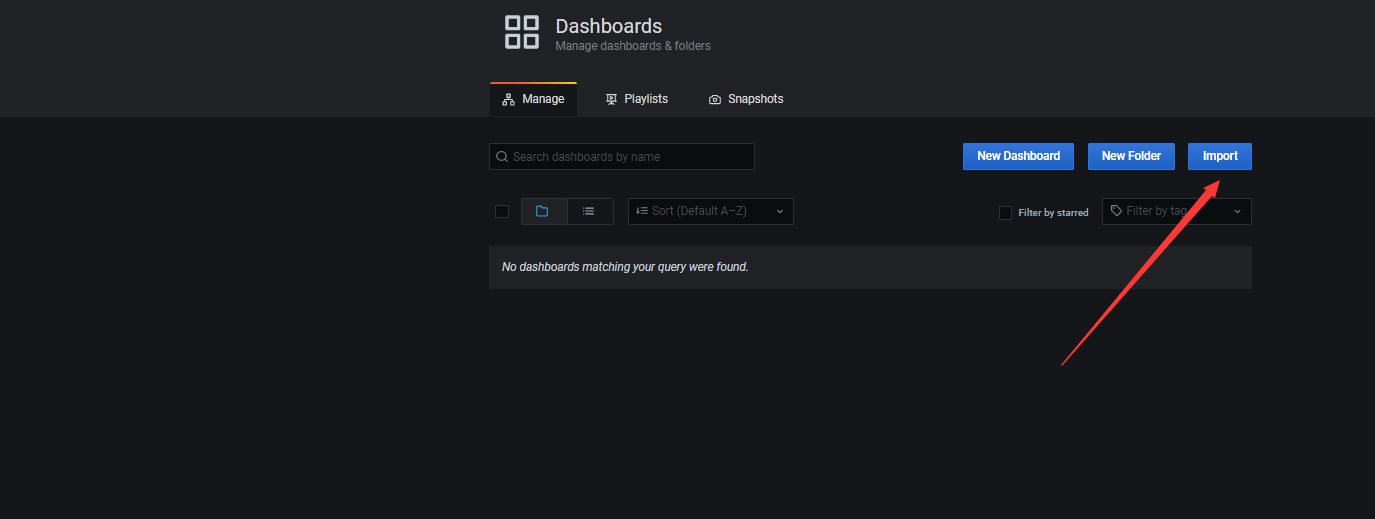
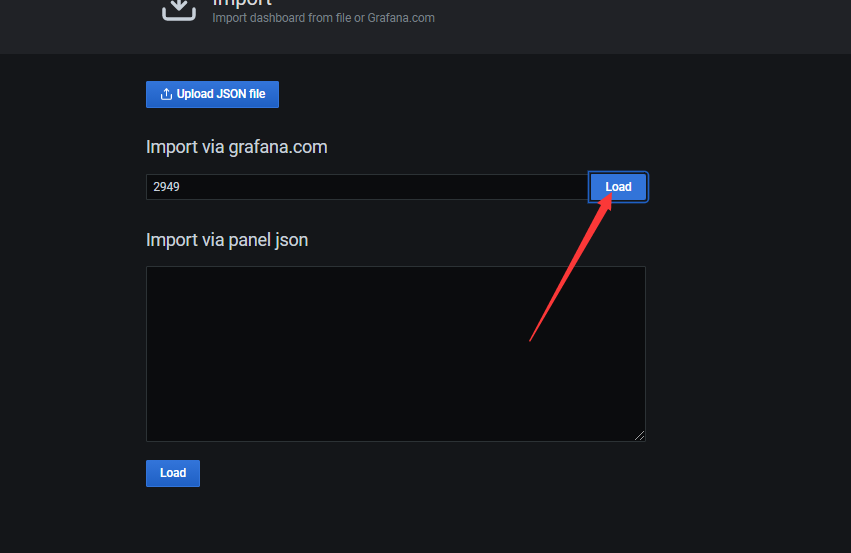
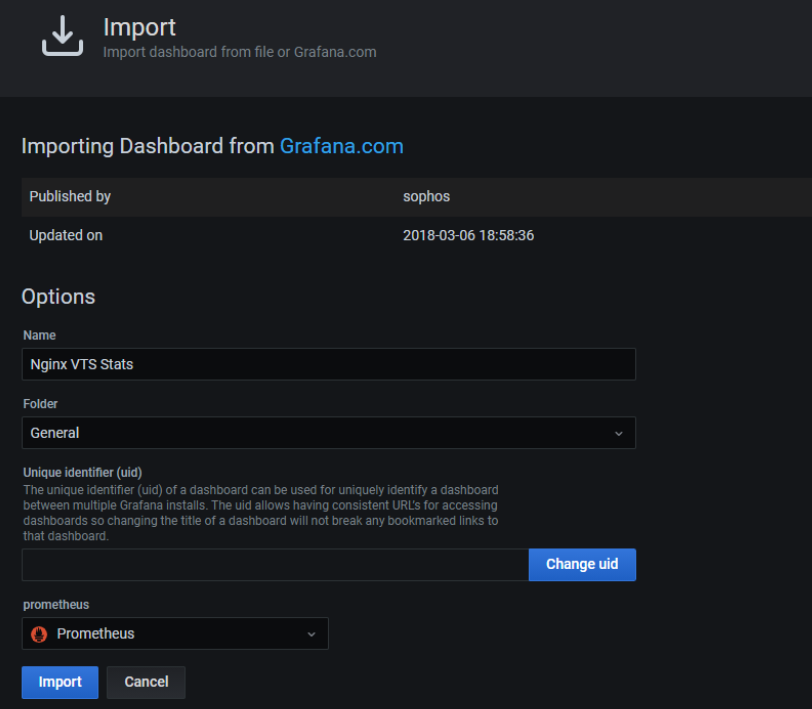
grafana部署
[root@localhost ~]# wget https://dl.grafana.com/oss/release/grafana-7.5.6-1.x86_64.rpm
[root@localhost ~]# dnf -y install grafana-7.5.6-1.x86_64.rpm
[root@localhost ~]# service grafana-server restart
Restarting grafana-server (via systemctl):                 [  OK  ]
[root@localhost ~]# ss -antl
State      Recv-Q     Send-Q         Local Address:Port          Peer Address:Port     Process
LISTEN     0          128                  0.0.0.0:22                 0.0.0.0:*
LISTEN     0          128                        *:9093                     *:*
LISTEN     0          128                        *:9094                     *:*
LISTEN     0          128                        *:9100                     *:*
LISTEN     0          128                     [::]:22                    [::]:*
LISTEN     0          128                        *:3000                     *:*

LISTEN     0          128                        *:9090                     *:*
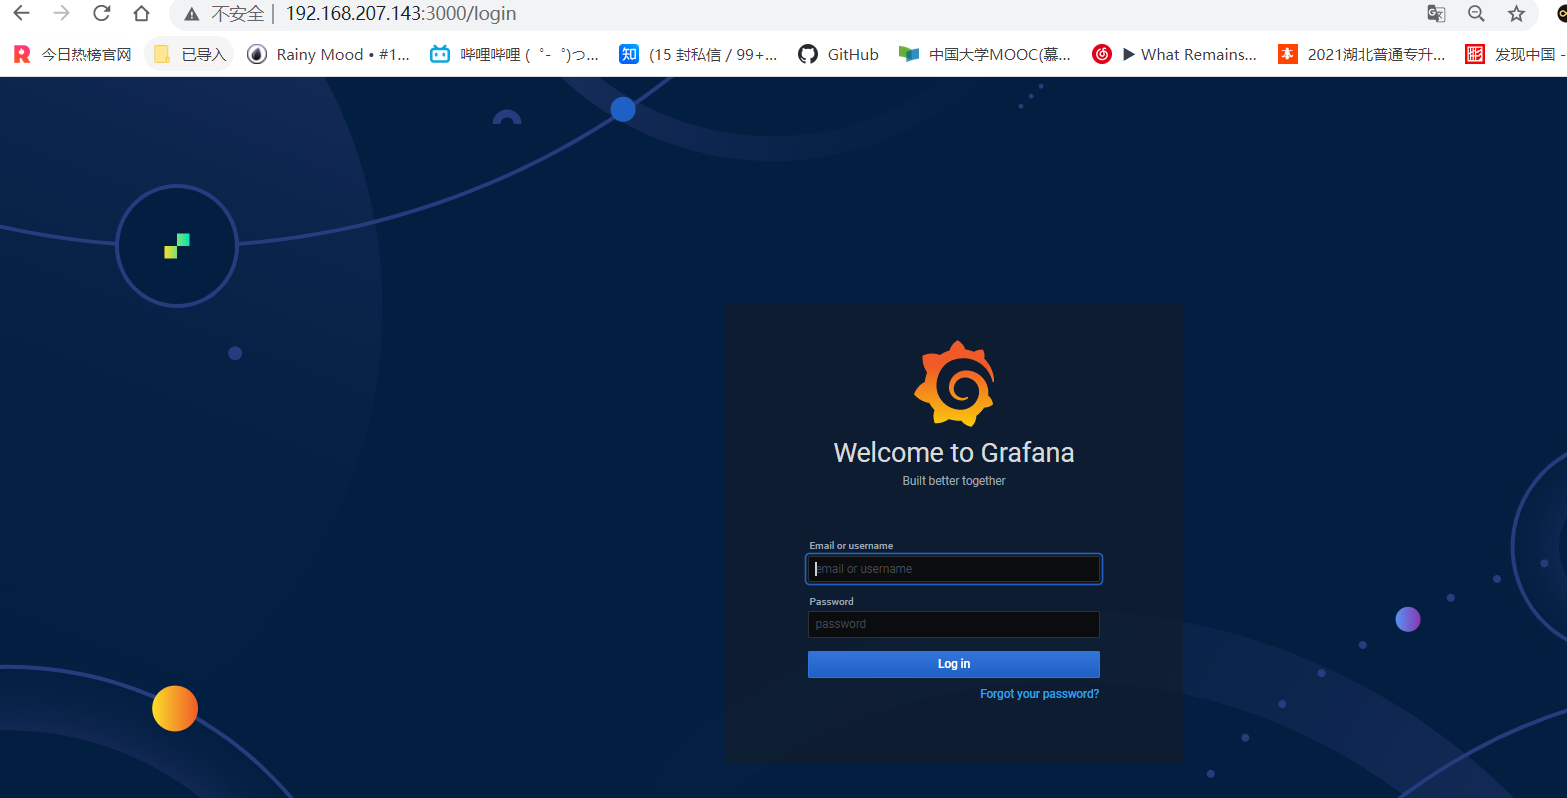
初始账号密码为admin
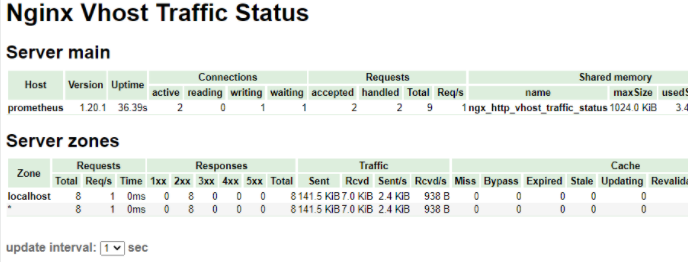
监控nginx
安装好nginx
下载nginx-module-vts模块
https://github.com/vozlt/nginx-module-vts.git
nginx的监控模块,能够提供json格式的数据产出
[root@localhost ~]# yum -y install git unzip
[root@localhost ~]# git clone https://github.com/vozlt/nginx-module-vts.git
[root@localhost ~]# unzip nginx-module-vts-master.zip
[root@localhost nginx-1.20.1]# ./configure --prefix=/usr/local/nginx --user=nginx --group=nginx --with-debug --with-http_ssl_module --with-http_realip_module --with-http_image_filter_module --with-http_gunzip_module --with-http_gzip_static_module --with-http_stub_status_module --http-log-path=/var/log/nginx/access.log --error-log-path=/var/log/nginx/error.log --add-module=../nginx-module-vts-master/
[root@localhost nginx-1.20.1]# make
[root@localhost nginx-1.20.1]# cp /usr/local/nginx/sbin/nginx{,-bak}
[root@localhost nginx-1.20.1]# pkill nginx;\cp objs/nginx /usr/local/nginx/sbin/;nginx
[root@localhost nginx-1.20.1]# nginx -V
nginx version: nginx/1.20.1
built by gcc 8.5.0 20210514 (Red Hat 8.5.0-2) (GCC)
built with OpenSSL 1.1.1k  FIPS 25 Mar 2021
TLS SNI support enabled
configure arguments: --prefix=/usr/local/nginx --user=nginx --group=nginx --with-debug --with-http_ssl_module --with-http_realip_module --with-http_image_filter_module --with-http_gunzip_module --with-http_gzip_static_module --with-http_stub_status_module --http-log-path=/var/log/nginx/access.log --error-log-path=/var/log/nginx/error.log --add-module=../nginx-module-vts-master/
修改配置文件
[root@localhost ~]# vim /usr/local/nginx/conf/nginx.conf
#在server中添加
        location /status {
            vhost_traffic_status_display;
            vhost_traffic_status_display_format html;
        }
#在http中添加
vhost_traffic_status_zone;
[root@localhost ~]# pkill nginx|nginx
安装nginx-vts-exporter
主要用于收集Nginx的监控数据,并且给prometheus提供监控接口,默认端口号是9913
[root@localhost ~]# wget https://github.com/hnlq715/nginx-vts-exporter/releases/download/v0.9.1/nginx-vts-exporter-0.9.1.linux-amd64.tar.gz
[root@localhost ~]# tar xf nginx-vts-exporter-0.9.1.linux-amd64.tar.gz
[root@localhost ~]# mv nginx-vts-exporter-0.9.1.linux-amd64 /usr/local/nginx-vts-exporter
编写service文件
[root@localhost ~]# vim /usr/lib/systemd/system/nginx_vts_exporter.service
[Unit]
Description=prometheus_nginx_vts
After=network.target

[Service]
Type=simple
ExecStart=/usr/local/nginx-vts-exporter/nginx-vts-exporter  -nginx.scrape_uri http://192.168.10.11/status/format/json
Restart=on-failure

[Install]
WantedBy=multi-user.target
启动nginx-vts-exporter
[root@localhost ~]# systemctl daemon-reload
[root@localhost ~]# systemctl enable  nginx_vts_exporter
[root@localhost ~]# systemctl start  nginx_vts_exporter

[root@localhost ~]# ss -antl
State         Recv-Q        Send-Q               Local Address:Port               Peer Address:Port       Process
LISTEN        0             128                        0.0.0.0:80                      0.0.0.0:*
LISTEN        0             128                        0.0.0.0:22                      0.0.0.0:*
LISTEN        0             128                              *:9093                          *:*
LISTEN        0             128                              *:9094                          *:*
LISTEN        0             128                              *:9100                          *:*
LISTEN        0             128                           [::]:22                         [::]:*
LISTEN        0             128                              *:3000                          *:*
LISTEN        0             128                              *:9913                          *:*
LISTEN        0             128                              *:9090                          *:*
配置prometheus
[root@localhost ~]# vim /usr/local/prometheus/prometheus.yml
- job_name: 'nginx'
    static_configs:
    - targets: ['192.168.207.143:9913']
[root@localhost ~]# systemctl restart prometheus

nginx监控指标说明
| 指标 | 说明 |
|---|---|
| nginx_server_requests | 统计nginx各个host 各个请求的总数,精确到状态码 |
| nginx_upstream_requests | 统计各个upstream 请求总数,精确到状态码 |
| nginx_server_connections | 统计nginx几种连接状态type的连接数 |
| nginx_server_cache | 统计nginx缓存计算器,精确到每一种状态和转发type |
| nginx_server_bytes | 统计nginx进出的字节计数可以精确到每个host,in进,out出 |
| nginx_upstream_bytes | 统计nginx各个 upstream 分组的字节总数,细分到进出 |
| nginx_upstream_responseMsec | 统计各个upstream 平均响应时长,精确到每个节点 |

瓜分20万奖金 获得内推名额 丰厚实物奖励 易参与易上手
更多推荐


 0
0 0
0- 0


 已为社区贡献1条内容

所有评论(0)