android 开源图表动画,Android 开源图表库 ------ MPAndroidChart
最近在开发心率方面,要绘制心率图,准备自己写自定义view来实现,查找资料时发现了一款基于Android的开源图表库 -- MPAndroidChart 在github上 已经commits 1500次,经常在维护,想必功能还是很完善,bug很少的。github地址: https://github.com/PhilJay/MPAndroidChart可以通过导入库的方式来将该库引入自己的项目也可以
最近在开发心率方面,要绘制心率图,准备自己写自定义view来实现,查找资料时发现了一款基于Android的开源图表库 -- MPAndroidChart 在github上 已经commits 1500次,经常在维护,想必功能还是很完善,bug很少的。
github地址: https://github.com/PhilJay/MPAndroidChart
可以通过导入库的方式来将该库引入自己的项目
也可以在这里 https://github.com/PhilJay/MPAndroidChart/releases 通过下载最新mpandroidchartlibrary-2-0-8.jar包, 然后copy到项目的libs中
MPAndroidChart主要功能特点:
支持x,y轴缩放
支持拖拽
支持手指滑动
支持高亮显示
支持保存图表到文件中
支持从文件(txt)中读取数据
预先定义颜色模板
自动生成标注
支持自定义x,y轴的显示标签
支持x,y轴动画
支持x,y轴设置最大值和附加信息
支持自定义字体,颜色,背景,手势,虚线等
具体使用方法可以参考在下载的demo中的MPChartExample里
这里介绍一下主要api:
setDescription(String desc) //设置表格的描述
setDescriptionTypeface(Typeface t) //自定义表格中显示的字体
setDrawYValues(boolean enabled) // 设置是否显示y轴的值的数据
setValuePaintColor(int color) //设置表格中y轴的值的颜色,但是必须设置 setDrawYValues(true)
setValueTypeface(Typeface t)//设置字体
setValueFormatter(DecimalFormat format) // 设置显示的格式
setPaint(Paint p, int which) // 自定义笔刷
public ChartData getDataCurrent() //返回ChartData对象当前显示的图表。它包含了所有信息的显示值最小和最大值等
public float getYChartMin() // 返回当前最小值
public float getYChartMax() //返回当前最大值
public float getAverage() //返回所有值的平均值。
public float getAverage(int type) //返回平均值
public PointF getCenter() // 返回中间点
public Paint getPaint(int which) //得到笔刷
setTouchEnabled(boolean enabled) //设置是否可以触摸,如为false,则不能拖动,缩放等
setDragScaleEnabled(boolean enabled) //设置是否可以拖拽,缩放
setOnChartValueSelectedListener(OnChartValueSelectedListener l) //设置表格上的点,被点击的时候,的回调函数
setHighlightEnabled(boolean enabled) // 设置点击value的时候,是否高亮显示
public void highlightValues(Highlight[] highs) // 设置高亮显示
saveToGallery(String title) // 保存图表到图库中
saveToPath(String title, String pathOnSD) //保存.
setScaleMinima(float x, float y) // 设置最小的缩放
centerViewPort(int xIndex, float val)// 设置视口
fitScreen() // 适应屏幕
demo中的简单实例
public class RealtimeLineChartActivity extends DemoBase implements
OnChartValueSelectedListener {
private LineChart mChart;
@Override
protected void onCreate(Bundle savedInstanceState) {
super.onCreate(savedInstanceState);
getWindow().setFlags(WindowManager.LayoutParams.FLAG_FULLSCREEN,
WindowManager.LayoutParams.FLAG_FULLSCREEN);
setContentView(R.layout.activity_realtime_linechart);
mChart = (LineChart) findViewById(R.id.chart1);
mChart.setOnChartValueSelectedListener(this);
// no description text
mChart.setDescription("");//设置图表描述信息
mChart.setNoDataTextDescription("You need to provide data for the chart.");
// enable touch gestures
mChart.setTouchEnabled(true); // 设置是否可以触摸
// enable scaling and dragging
mChart.setDragEnabled(true); // 是否可以拖拽
mChart.setScaleEnabled(true); // 是否可以缩放
mChart.setDrawGridBackground(false); //设置是否显示表格
// if disabled, scaling can be done on x- and y-axis separately
mChart.setPinchZoom(true);
// set an alternative background color
mChart.setBackgroundColor(Color.LTGRAY);
LineData data = new LineData();
data.setValueTextColor(Color.WHITE);
// add empty data
mChart.setData(data);
Typeface tf = Typeface.createFromAsset(getAssets(), "OpenSans-Regular.ttf");
// get the legend (only possible after setting data)
Legend l = mChart.getLegend(); // 设置比例图标示,就是那个一组y的value的
// modify the legend ...
// l.setPosition(LegendPosition.LEFT_OF_CHART);
l.setForm(LegendForm.LINE);
l.setTypeface(tf);
l.setTextColor(Color.WHITE);
XAxis xl = mChart.getXAxis();//设置是否显示表格
xl.setTypeface(tf);
xl.setTextColor(Color.WHITE);
xl.setDrawGridLines(false);//设置是否显示X轴表格
xl.setAvoidFirstLastClipping(true);//设置x轴起点和终点label不超出屏幕
xl.setSpaceBetweenLabels(5);// 设置x轴label间隔
xl.setEnabled(true);
//xl.setPosition(XAxisPosition.BOTTOM); //设置X轴的显示位置
YAxis leftAxis = mChart.getAxisLeft();//得到图表的左侧Y轴实例
leftAxis.setTypeface(tf);
leftAxis.setTextColor(Color.WHITE);
leftAxis.setAxisMaxValue(100f);// 设置Y轴最大值
leftAxis.setAxisMinValue(0f);// 设置Y轴最小值。
leftAxis.setDrawGridLines(true);
// leftAxis.enableGridDashedLine(10f, 10f, 0f); //设置横向表格为虚线
// limit lines are drawn behind data (and not on top)
// leftAxis.setDrawLimitLinesBehindData(true);
YAxis rightAxis = mChart.getAxisRight();//设置右侧Y轴不可用(这里可以向得到左侧Y轴那样,得到右侧Y轴实例去处理)
rightAxis.setEnabled(false);
}
@Override
public boolean onCreateOptionsMenu(Menu menu) {
getMenuInflater().inflate(R.menu.realtime, menu);
return true;
}
@Override
public boolean onOptionsItemSelected(MenuItem item) {
switch (item.getItemId()) {
case R.id.actionAdd: {
addEntry();
break;
}
case R.id.actionClear: {
mChart.clearValues();
Toast.makeText(this, "Chart cleared!", Toast.LENGTH_SHORT).show();
break;
}
case R.id.actionFeedMultiple: {
feedMultiple();
break;
}
}
return true;
}
private int year = 2015;
private void addEntry() {
LineData data = mChart.getData();
if (data != null) {
ILineDataSet set = data.getDataSetByIndex(0);
// set.addEntry(...); // can be called as well
if (set == null) {
set = createSet();
data.addDataSet(set);
}
// add a new x-value first
data.addXValue(mMonths[data.getXValCount() % 12] + " "
+ (year + data.getXValCount() / 12));
data.addEntry(new Entry((float) (Math.random() * 40) + 30f, set.getEntryCount()), 0);
// let the chart know it's data has changed
mChart.notifyDataSetChanged();
// limit the number of visible entries
mChart.setVisibleXRangeMaximum(120);
// mChart.setVisibleYRange(30, AxisDependency.LEFT);
// move to the latest entry
mChart.moveViewToX(data.getXValCount() - 121);
// this automatically refreshes the chart (calls invalidate())
// mChart.moveViewTo(data.getXValCount()-7, 55f,
// AxisDependency.LEFT);
}
}
private LineDataSet createSet() {
LineDataSet set = new LineDataSet(null, "Dynamic Data");
set.setAxisDependency(AxisDependency.LEFT);
set.setColor(ColorTemplate.getHoloBlue());
set.setCircleColor(Color.WHITE);
set.setLineWidth(2f);
set.setCircleRadius(4f);
set.setFillAlpha(65);
set.setFillColor(ColorTemplate.getHoloBlue());
set.setHighLightColor(Color.rgb(244, 117, 117));
set.setValueTextColor(Color.WHITE);
set.setValueTextSize(9f);
set.setDrawValues(false);
return set;
}
private void feedMultiple() {
new Thread(new Runnable() {
@Override
public void run() {
for (int i = 0; i < 500; i++) {
runOnUiThread(new Runnable() {
@Override
public void run() {
addEntry();
}
});
try {
Thread.sleep(35);
} catch (InterruptedException e) {
// TODO Auto-generated catch block
e.printStackTrace();
}
}
}
}).start();
}
@Override
public void onValueSelected(Entry e, int dataSetIndex, Highlight h) {
Log.i("Entry selected", e.toString());
}
@Override
public void onNothingSelected() {
Log.i("Nothing selected", "Nothing selected.");
}
}
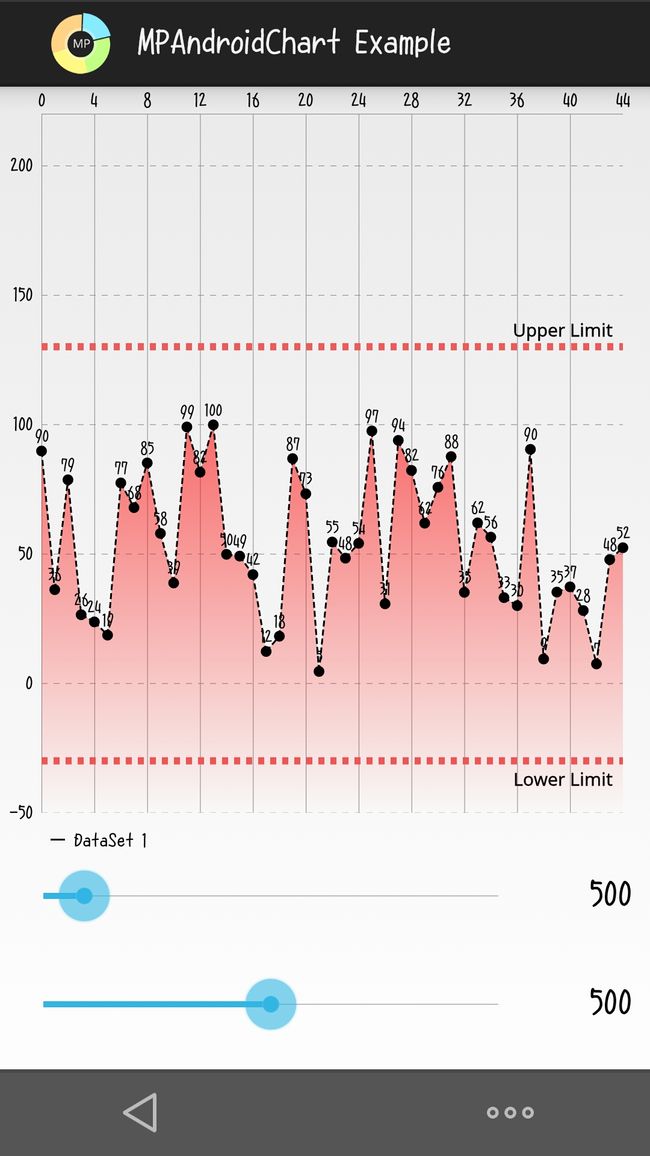
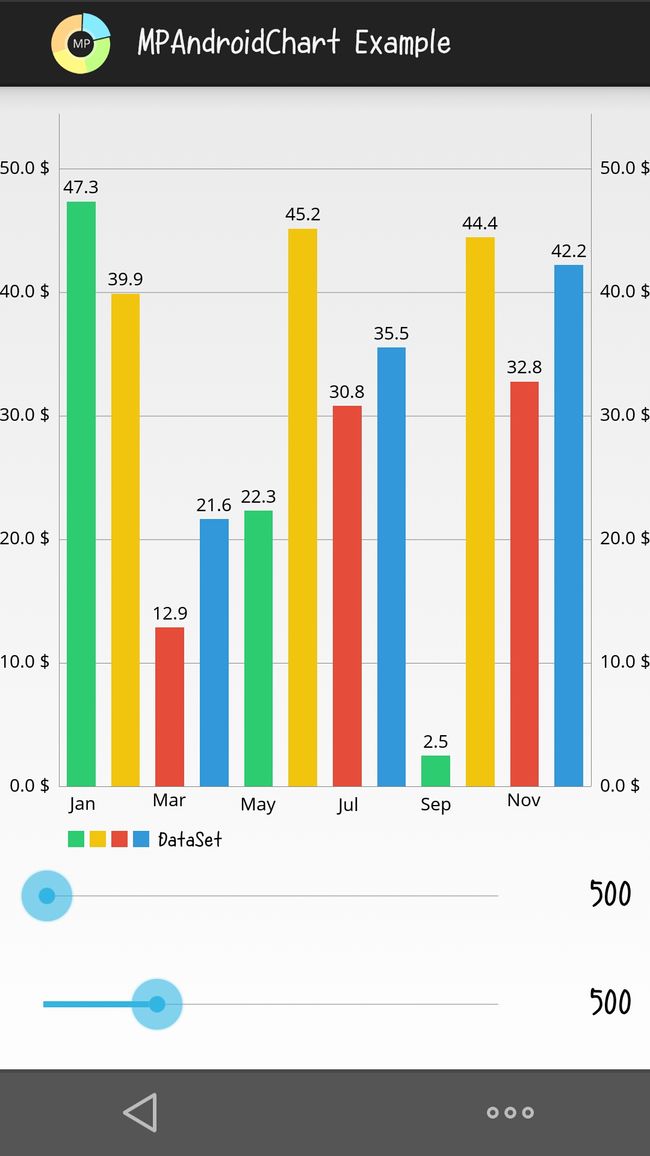
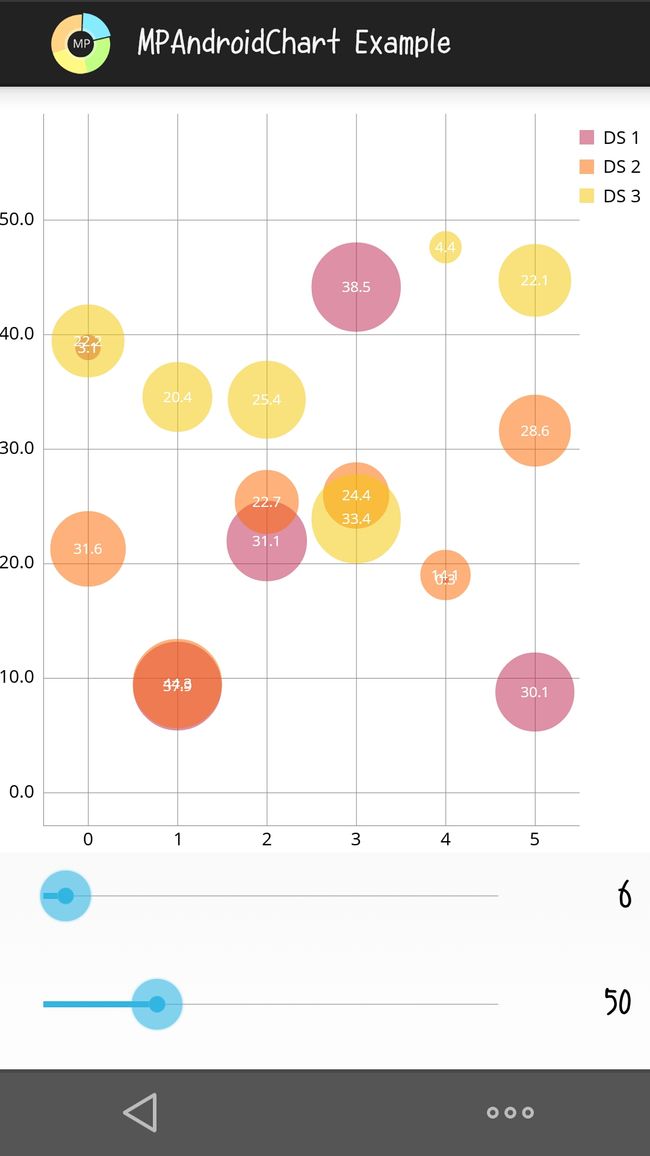
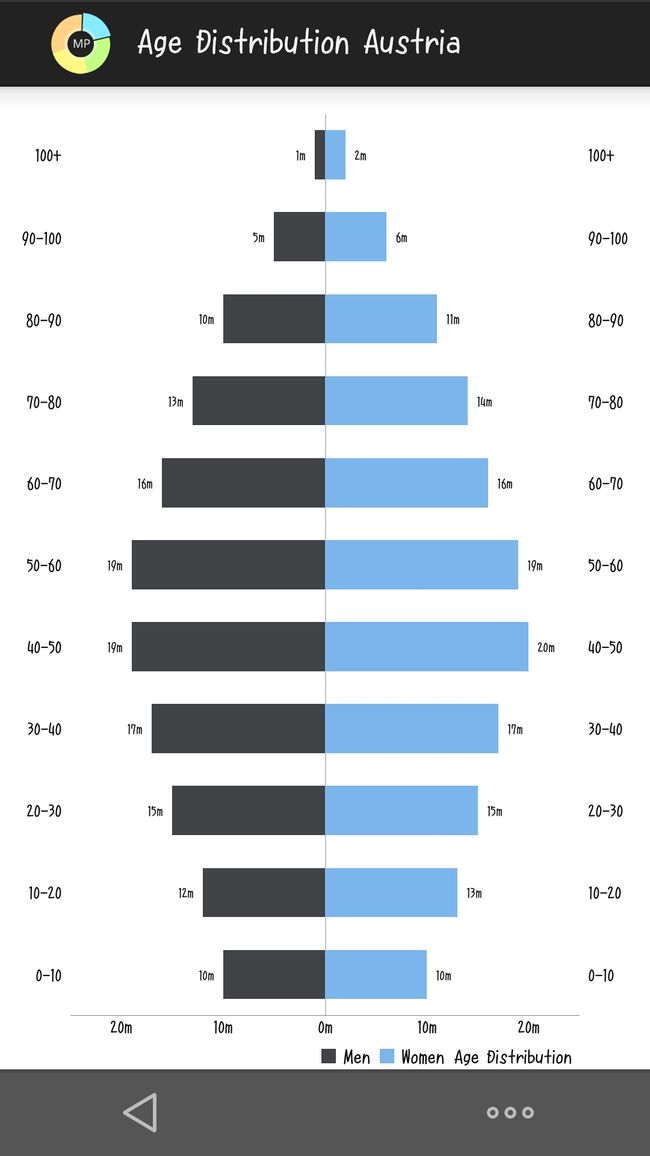
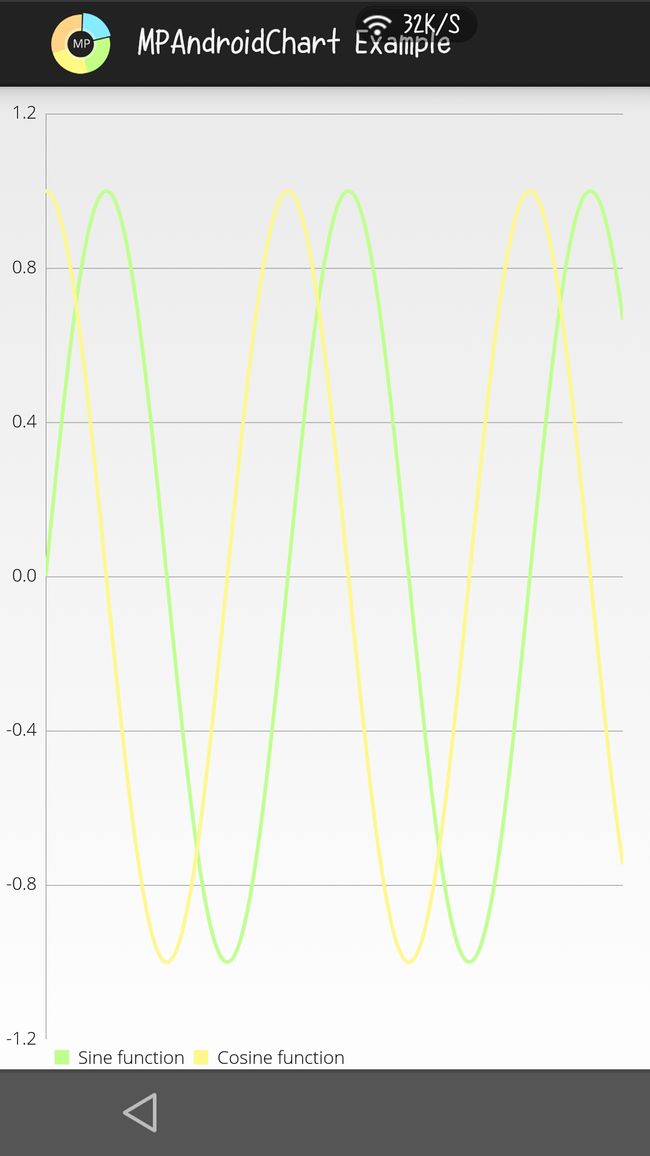
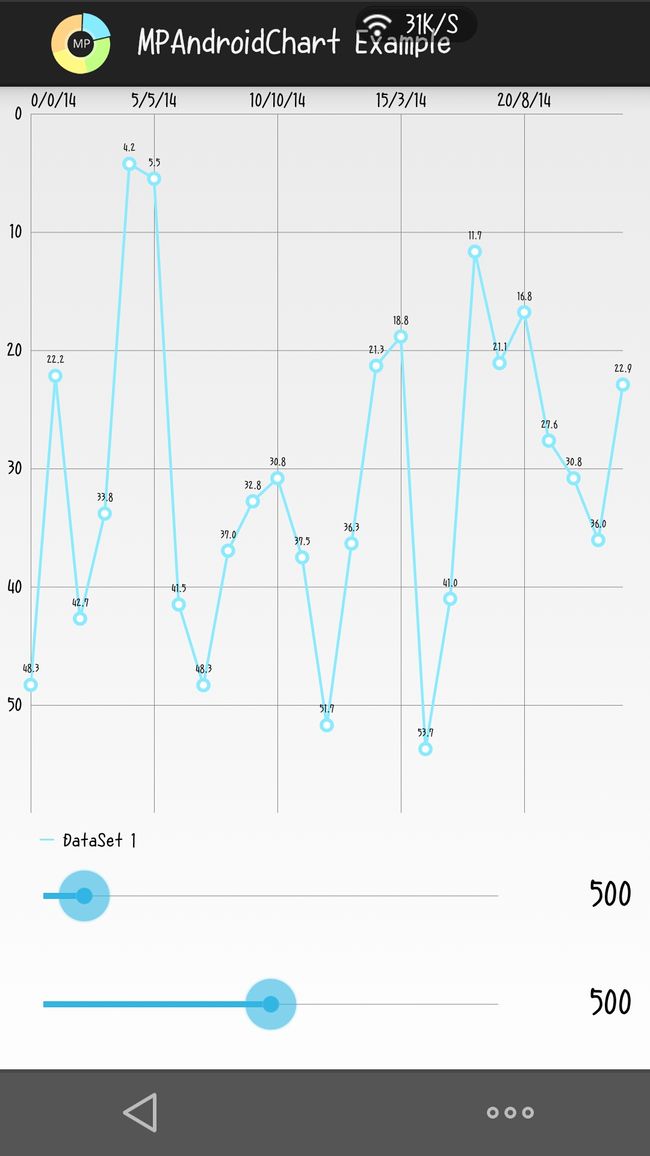
下面是几张demo中运行的效果图:
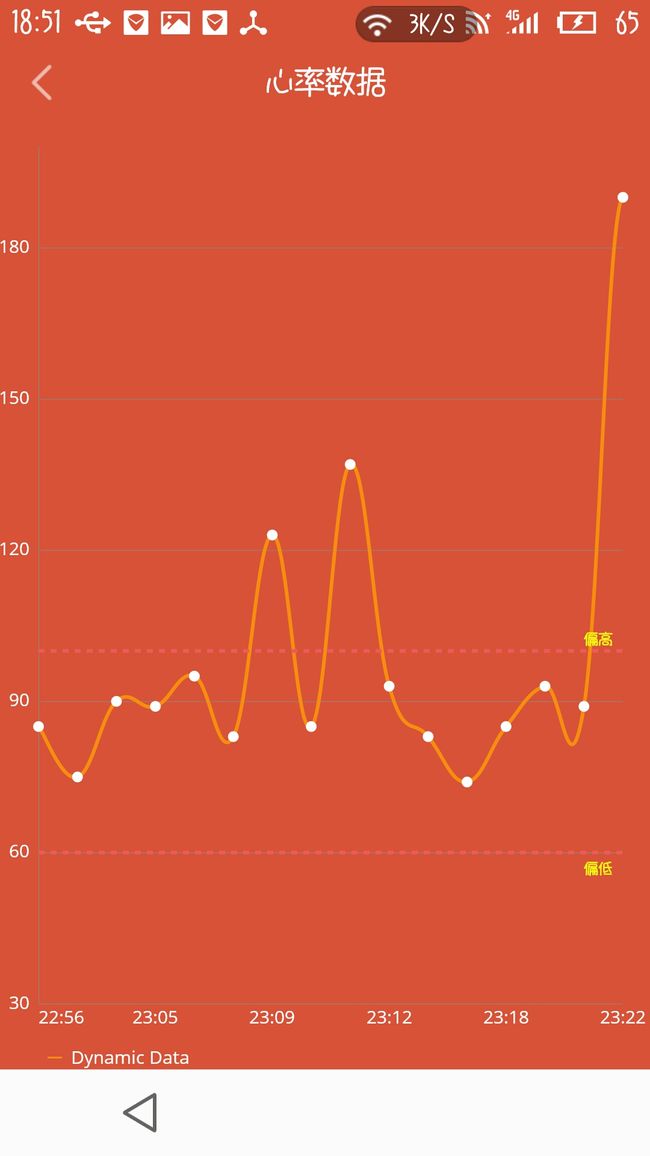
自己的心率图:

为开发者提供学习成长、分享交流、生态实践、资源工具等服务,帮助开发者快速成长。
更多推荐


 0
0 0
0- 0


 已为社区贡献2条内容

所有评论(0)