python检测特定颜色的形状_OpenCV-几何形状颜色识别
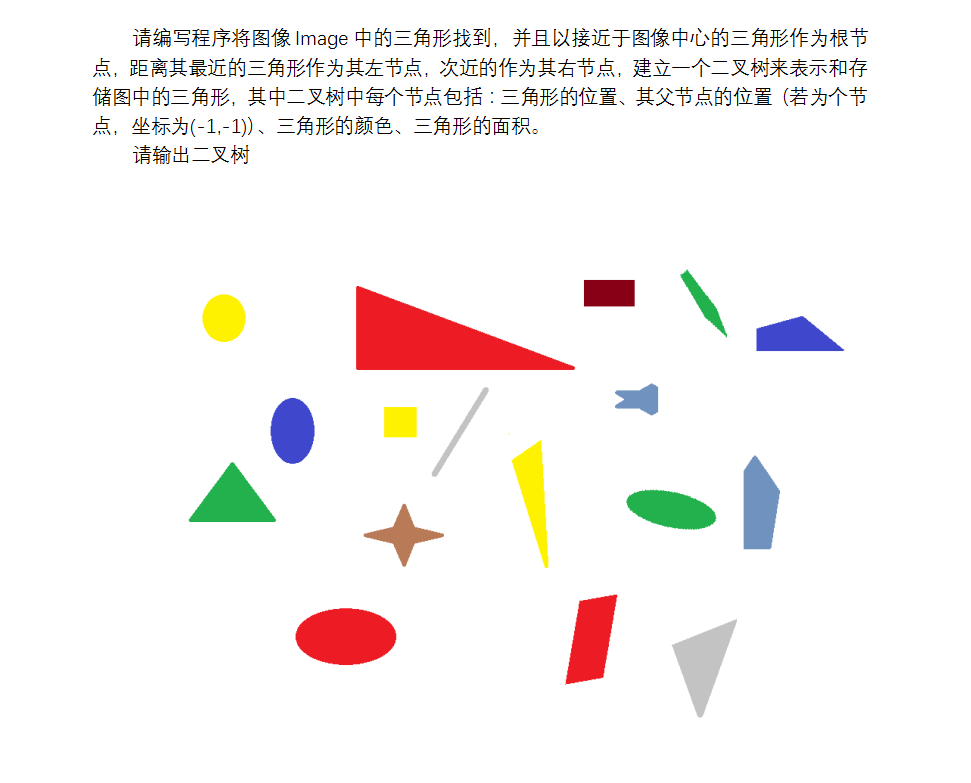
思路先先识别三角形,就先转成二值图像, 然后使用轮廓发现findContours相关函数,提取与绘制轮廓,最后用approxPolyDP对其进行轮廓逼近,然后对三角形找到中心点 ,需要用moments计算一阶几何距得到指定轮廓的中心位置然后的到的三角形中心位置坐标可以用来得出三角形的坐标和颜色“以接近于图像中心的三角形作为根节点,距离其最近的三角形作为其左节点,次近的作为其右节点”在构成二叉树的时

思路
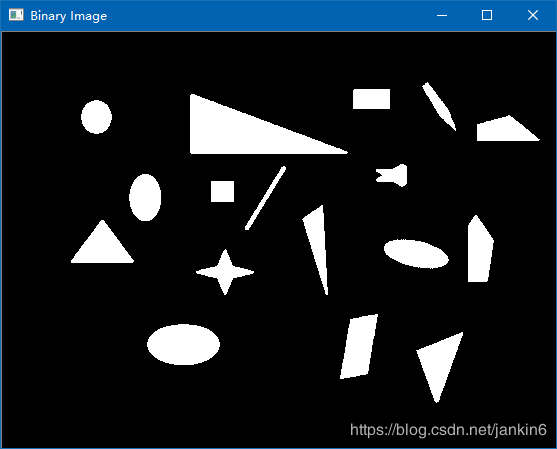
先先识别三角形,就先转成二值图像, 然后使用轮廓发现findContours相关函数,提取与绘制轮廓,最后用approxPolyDP对其进行轮廓逼近,
然后对三角形找到中心点 ,需要用moments计算一阶几何距得到指定轮廓的中心位置
然后的到的三角形中心位置坐标可以用来得出三角形的坐标和颜色
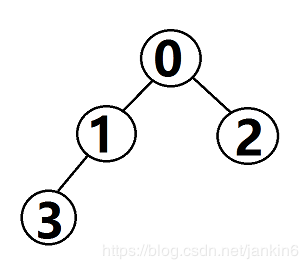
“以接近于图像中心的三角形作为根节点,距离其最近的三角形作为其左节点,次近的作为其右节点”在构成二叉树的时候(我印象中学习机器学习的时候貌似记得有个KNN算法,实现有点麻烦),这里我是直接用两点之间开方计算距离。
后面二叉树的,先按照距离进行排序,然后插入节点
打印节点
代码
# -*- coding: utf-8 -*-
#引入必要工具
import cv2 as cv
import numpy as np
import math
#计算距离
def caculateDistance(a, b):
return math.sqrt(math.pow(a[0] - b[0], 2) + math.pow(a[1] - b[1], 2))
class Node:
def __init__(self, pos, area, color):
# 节点内容:面积,颜色,坐标,左子树,右子树,父节点
self.area = area
self.color = color
self.pos = pos
self.left = None
self.right = None
self.Parent = None
#添加左子树
def addLeft(self, l):
self.left = l
# 添加右子树
def addRight(self, r):
self.right = r
# 添加父节点
def GetParent(self):
return self.Parent
#定义树
class Tree:
def __init__(self):
self.root = None
def addroot(self, root):
self.root = root
class ShapeAnalysis:
def __init__(self):
self.shapes = {'triangle': 0, 'rectangle': 0, 'polygons': 0, 'circles': 0}
self.i = 0
def analysis(self, frame, tree):
h, w, ch = frame.shape
result = np.zeros((h, w, ch), dtype=np.uint8)
# 二值化图像
print("start to detect lines...\n")
gray = cv.cvtColor(frame, cv.COLOR_BGR2GRAY)
ret, binary = cv.threshold(gray, 230, 255, cv.THRESH_BINARY_INV)
triangles = {}
cv.imshow("Binary Image", binary)
out_binary, contours, hierarchy = cv.findContours(binary, cv.RETR_EXTERNAL, cv.CHAIN_APPROX_SIMPLE)
for cnt in range(len(contours)):
# 提取与绘制轮廓
cv.drawContours(result, contours, cnt, (0, 255, 0), 2)
# 轮廓逼近
epsilon = 0.012 * cv.arcLength(contours[cnt], True)
approx = cv.approxPolyDP(contours[cnt], epsilon, True)
# 分析几何形状
corners = len(approx)
shape_type = []
if corners == 3:
count = self.shapes['triangle']
count = count + 1
self.shapes['triangle'] = count
shape_type = "三角形"
# 求中心位置
mm = cv.moments(contours[cnt])
cx = int(mm['m10'] / mm['m00'])
cy = int(mm['m01'] / mm['m00'])
if shape_type == "三角形":
cv.circle(result, (cx, cy), 3, (0, 0, 255), -1)
# 计算颜色
color = frame[cy][cx]
color_str = "(" + str(color[0]) + ", " + str(color[1]) + ", " + str(color[2]) + ")"
# 计算面积
area = cv.contourArea(contours[cnt])
# 判断三角形
if shape_type == "三角形":
n = Node([cx, cy], area, color)
triangles[self.i] = n
self.i = self.i + 1
print("-------------------------------------")
print("第%d个三角形:"%self.i)
print(" 坐标 %s 面积: %.3f 颜色: %s " % ((cx, cy), area, color_str))
print("-------------------------------------")
cv.imshow("Analysis Result", self.draw_text_info(result))
center = [frame.shape[0] / 2, frame.shape[1] / 2]
print("图片中心位置:%s"%center)
print("-------------------------------------")
dis = {}
# 以接近于图像中心的三角形作为根节点,
# 距离其最近的三角形作为其左节点,次近的作为其右节点
for j in range(4):
dis[j] = caculateDistance(center, triangles[j].pos)
for j in range(4):
for k in range(4):
if (dis[j] < dis[k]):
temp = dis[k]
dis[k] = dis[j]
dis[j] = temp
temp1 = triangles[k]
triangles[k] = triangles[j]
triangles[j] = temp1
for j in range(len(triangles)):
print(dis[j])
print(triangles[j].pos)
tree.addroot(triangles[0])
x = Node([-1, -1], 0, [-1, -1, -1])
triangles[0].Parent = x
triangles[0].addLeft(triangles[1])
triangles[1].Parent = triangles[0]
triangles[0].addRight(triangles[2])
triangles[2].Parent = triangles[0]
triangles[1].addLeft(triangles[3])
triangles[3].Parent = triangles[1]
# 3和2号没有子树,1号没有右子树
y = Node([0, 0], 0, [-1, -1, -1])
triangles[3].addLeft(y)
triangles[3].addRight(y)
triangles[2].addLeft(y)
triangles[2].addRight(y)
triangles[1].addRight(y)
for k in range(4):
print("-------------------------------------")
print("第%d节点 面积%.3f 颜色%s 父节点%s 自己节点%s 左子树%s 右子树%s "% (k,(triangles[k].area),(triangles[k].color),(triangles[k].Parent.pos),(triangles[k].pos),(triangles[k].left.pos),(triangles[k].right.pos)))
return self.shapes
def draw_text_info(self, image):
c1 = self.shapes['triangle']
cv.putText(image, "triangle: " + str(c1), (10, 20), cv.FONT_HERSHEY_PLAIN, 1.2, (255, 255, 255), 1)
return image
if __name__ == "__main__":
src = cv.imread("D:/picture/11.png")
tree = Tree()
ld = ShapeAnalysis()
ld.analysis(src, tree)
cv.waitKey(-1)
结果
图像处理

控制台输出结果
Python 3.6.4 |Anaconda, Inc.| (default, Jan 16 2018, 10:22:32) [MSC v.1900 64 bit (AMD64)] on win32
runfile('C:/Users/Jackinsun/Desktop/untitled0.py', wdir='C:/Users/Jackinsun/Desktop')
start to detect lines...
-------------------------------------
第1个三角形:
坐标 (436, 330) 面积: 1447.500 颜色: (195, 195, 195)
-------------------------------------
第2个三角形:
坐标 (99, 215) 面积: 1393.500 颜色: (76, 177, 34)
-------------------------------------
第3个三角形:
坐标 (315, 208) 面积: 965.500 颜色: (0, 243, 255)
-------------------------------------
第4个三角形:
坐标 (241, 101) 面积: 4813.500 颜色: (36, 28, 237)
-------------------------------------
图片中心位置:[208.0, 277.0]
-------------------------------------
125.39936203984452
[99, 215]
127.3184982632139
[315, 208]
179.06702655709677
[241, 101]
234.07904647789388
[436, 330]
-------------------------------------
第0节点 面积1393.500 颜色[ 76 177 34] 父节点[-1, -1] 自己节点[99, 215] 左子树[315, 208] 右子树[241, 101]
-------------------------------------
第1节点 面积965.500 颜色[ 0 243 255] 父节点[99, 215] 自己节点[315, 208] 左子树[436, 330] 右子树[0, 0]
-------------------------------------
第2节点 面积4813.500 颜色[ 36 28 237] 父节点[99, 215] 自己节点[241, 101] 左子树[0, 0] 右子树[0, 0]
-------------------------------------
第3节点 面积1447.500 颜色[195 195 195] 父节点[315, 208] 自己节点[436, 330] 左子树[0, 0] 右子树[0, 0]
参考资料

腾讯云面向开发者汇聚海量精品云计算使用和开发经验,营造开放的云计算技术生态圈。
更多推荐


 0
0 0
0- 0


 已为社区贡献4条内容


 服务器0元试用
所有评论(0)