
A Deep Dive into the CPU Usage Calculation on Linux
It is undoubtedly to say that insufficient system resources such as storage, memory or CPU can greatly affect an application’s performance, so monitoring these components is a must for any high-performing yet resource-constraint systems. Unlike disk and memory, monitoring the CPU usage on a Linux system isn’t as straightforward, as well as the use of the CPU usage and the CPU load is drastically different. In this article, we will dive into understanding and displaying CPU metrics in a human-readable format.
CPU Load vs CPU Usage
Although CPU load and CPU usage are similar terms, they are actually not interchangeable:
- CPU load: the number of processes using or waiting to use one core at a single point in time.
- CPU usage: the percentage of time a CPU takes to process non-idle tasks. It can only be measured over a specified interval of time.
Different definitions lead to different use:
CPU load: Quick check if more applications can be launched smoothly.
Suppose we are running multi-processing applications on a single-core system and if the CPU load average is below 0.6, then we should be confident that the CPU is underloaded and any process that needs to use the CPU can take the CPU over instantly. For multicore systems, having the load average above 1 does not indicate an issue as there are more cores available for use.
CPU usage: Application performance benchmark and the real-time application feasibility analysis.
1. Performance benchmark:
The average CPU usage of a running application tells us if the design or the implementation is sufficiently efficient for the running hardware platform. Suppose the application under analysis is proved to be CPU-bound, then it is highly likely that the majority of its operations tend to have few and long CPU bursts:
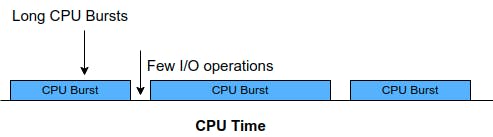
(CPU burst refers to the amount of time taken to execute a task). Consequently, the program execution is highly dependent on the CPU. For the development team, it is now a good time to review their design and possibly take the any of the following actions:
- Scale up the CPU frequency to reduce the program execution time
- Restructure the design to distribute the computation load into multiple subtasks and reduce or even remove the data/control dependency among computational-heavy subtasks
- Lower the priority of the application to allow other processes to run without side effects
2. The real-time application feasibility analysis:
Having the CPU usage known for the target application allows us to check if the target application is schedulable. Although the feasibility study shall be performed prior to the application implementation, occasionally the application is not designed or implemented as expected, resulting it fails to be schedulabled expectaily. In such a case, the following scheduling tests that use the CPU usage could help us quickly verify if our observations and concerns are valid.
(1). Rate-Monotonic Least Upper Bound (RM LUB)
Suppose the target application is a periodic real-time multi-threaded application, the RM LUB can be used to quickly validate if the application is schedulable in theory. The RM LUB is known as a pessimistic feasibility test that will fail some proposed service sets that actually are schedulable, but it will never pass a set that does not work. Such a sufficient but unnecessary feasibility test is therefore our first checker:

We compare the observed CPU usage ratio with the right-side term and if the CPU usage ratio is smaller, then the test passes. If the RM LUB test is passed, then it is guaranteed that the application is correctly designed for real-time scheduling. Failing the test does not mean the design guarantees wrong, however.
Depending on the nature of the application, either Scheduling Point test or Completion Time test can be run for further validation. Both tests are sufficient and necessary tests and neither of them makes use of the CPU usage so the development team can focus on the program feasibility test.
(2). Scheduling Point test
This test basically states that if a set of services can be shown to meet all deadlines from the critical instant up to the longest deadline of all tasks in the set, then the set is feasible.

(3). Completion Time test
This test is presented as an alternative to the Scheduling Point test:

Calculating CPU Usage
As to how the CPU usage is defined, we can calculate its value by measuring the CPU ratio on idle tasks and then subtract the ratio by 100. Here I will use vmstat and top commands, as well as /proc/stat file to illustrate the calculation.
1. Vmstat command
vmstat reports information about processes, memory, paging, block IO, traps, disks and cpu activity. It displays CPU activity in near-real time:

The columns under CPU provide an overview of where the processor time is spent:
- us – time spent running non-kernel code
- sy – time spent running kernel code
- id – time spent idle
- wa – time spent waiting for I/O
- st – time is stolen from a virtual machine
To calculate the CPU usage, we simply use the id column:

2. /proc/stat file
The /proc/stat file records the kernel/system statistics, and we can certainly extract the CPU activity from it:

The first line, ‘cpu’ is an aggregate of the metrics of all cores of the system. On a system with 7 cores, there would be 7 cpu lines — from cpu0 to cpu7. The columns in the ‘cpu‘ row represent times spent processing different tasks:
- user – time spent in user mode
- nice – time spent processing nice processes in user mode
- system – time spent executing kernel code
- idle – time spent idle
- iowait – time spent waiting for I/O
- irq – time spent servicing interrupts
- softirq – time spent servicing software interrupts
- steal – time stolen from a virtual machine
- guest – time spent running a virtual CPU for a guest operating system
- guest_nice – time spent running a virtual CPU for a “niced” guest operating system
We will use the above metrics to calculate the average idle percentage which then helps us derive the CPU usage:
Average idle time (%) = (idle * 100) / (user + nice + system + idle + iowait + irq + softirq + steal + guest + guest_nice)

Since we’re working on a multi-core system, we use head -1 to retrieve the aggregate of metrics on all cores.
3. Top command
The top (table of processes) command shows a real-time view of running processes in Linux and displays kernel-managed tasks. The command also provides a system information summary that shows resource utilization, including CPU and memory usage. To use the command to specifically check the CPU usage for each core, we need to do the following:
- Individual CPU Core Statistics
Pressing 1 on your keyboard allows you to see individual statistics for each CPU core.

- CPU Usage Graph
To obtain a graphical representation of the overall CPU usage, toggle the graphs on or off by pressing t.

If we press 1 after pressing t, we can obtain a graphical representation of the CPU usage for each core.

Once we obtain the idle usage of each CPU core, we can use the following simple equation to calculate the CPU usage, for each core:
CPU usage = 100 - idle usage
Here I am checking the CPU usage for the core 7 as an example:

Summary
In this article, I talked about the difference between the CPU load and the CPU usage, as well as the typical use of each term. Additionally, I shared three ways to calculate the CPU usage for each core. I hope you find this article useful and enjoy the reading !
更多推荐


 0
0 0
0- 0


 已为社区贡献12493条内容

所有评论(0)