Grafana is a de-facto observability visualization tool with a variety of chart panels and many community plugins like Plotly, but no one of them can compare with Apache ECharts flexibility.

Apache ECharts is a free, powerful charting and visualization library offering easy ways to add intuitive, interactive, and highly customizable charts. It is written in pure JavaScript and based on zrender, which is a new lightweight canvas library.
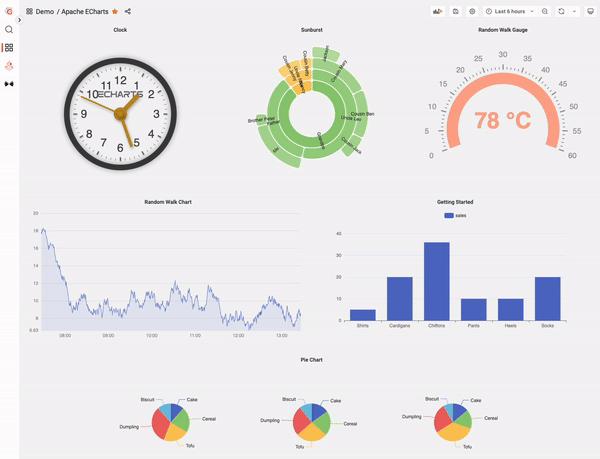
The Apache ECharts panel is a plugin for Grafana that allows you to use Apache ECharts library on Grafana dashboard. The original plugin was developed for Grafana 6.3/7.0 and ECharts 4.9.0. It has not been maintained since then.
Volkov Labs adapted and updated it based on the latest Grafana 9 with ECharts 5.3.3, introducing new features like Monaco Code Editor and supporting SVG and Canvas renderer.
The Apache ECharts panel was recently submitted to the Grafana Marketplace. Meanwhile, it can be installed manually from our private repository or downloaded directly from GitHub.
GitHub - VolkovLabs/volkovlabs-echarts-panel: Apache ECharts panel for @grafana.
Apache ECharts panel for @grafana. Contribute to VolkovLabs/volkovlabs-echarts-panel development by creating an account…
github.com
Apache ECharts is a mighty tool. You do not need a senior Javascript developer to start displaying modern-looking animated visualizations. And if your use case is unique, Apache ECharts provides an excellent venue to develop visualizations of any complexity.
The Apache ECharts panel for Grafana is a bridge that has been missing and finally arrived. You can use the benefits of two great open-source products — Grafana and Apache ECharts in one solution tailored for your needs.
According to the press release, “Apache ECharts is in use at Alibaba, Amazon, Baidu, GitLab, Intel, and Tencent, among others, as well as solutions such as Apache Superset data visualization software.”
The Apache Software Foundation Announces Apache® ECharts™ as a Top-Level Project
Adaptable, interactive, responsive Open Source charting and data visualization software in use at Alibaba, Amazon…
www.globenewswire.com
The project continues to grow in popularity, with more than 50,000 stars on GitHub and 450,000 weekly downloads on npm.
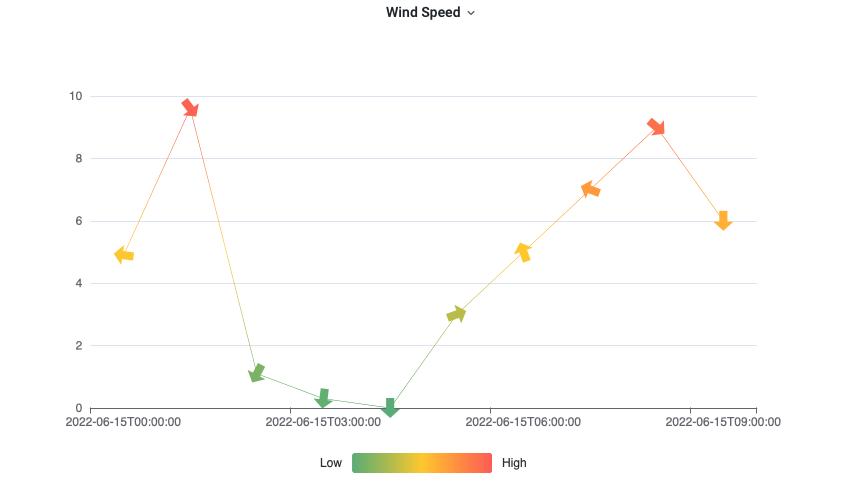
Wind Speed
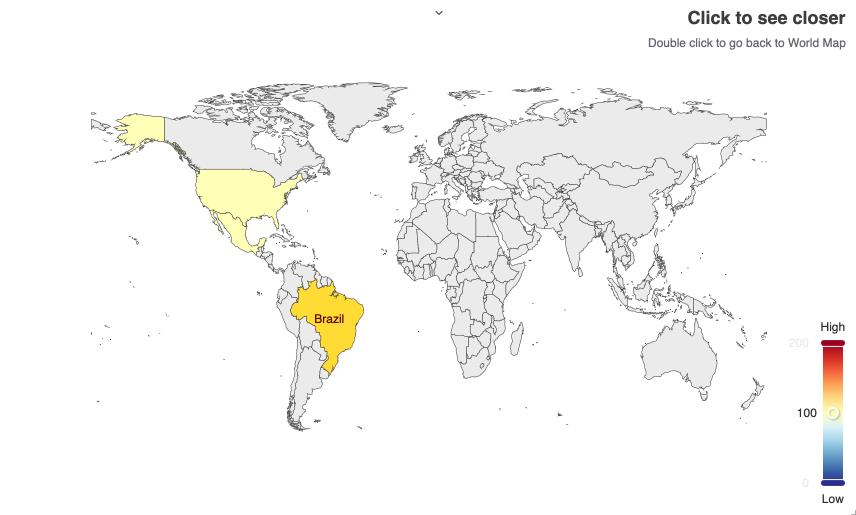
From visualizing wind speed with an arrow displays direction and color scale to seamlessly navigating a world map looking at countries and switching to regions using dynamic options. Apache ECharts can do both and everything in between.
We were looking for a Grafana plugin to visualize complex directed graphs and fascinated by how Apache ECharts produce it effortlessly.
Project Live (live.volkovlabs.io)
Data visualizations can and should be done in style. In the 30 minutes tutorial, Daria explained step-by-step how we created project Live to visualize all our activities for this year across Medium, GitHub, YouTube, and diverse External resources.
Let’s take a look at directed graphs displaying our activities related to Medium and GitHub. Graphs are built dynamically, and we constantly update them with new articles and releases daily.
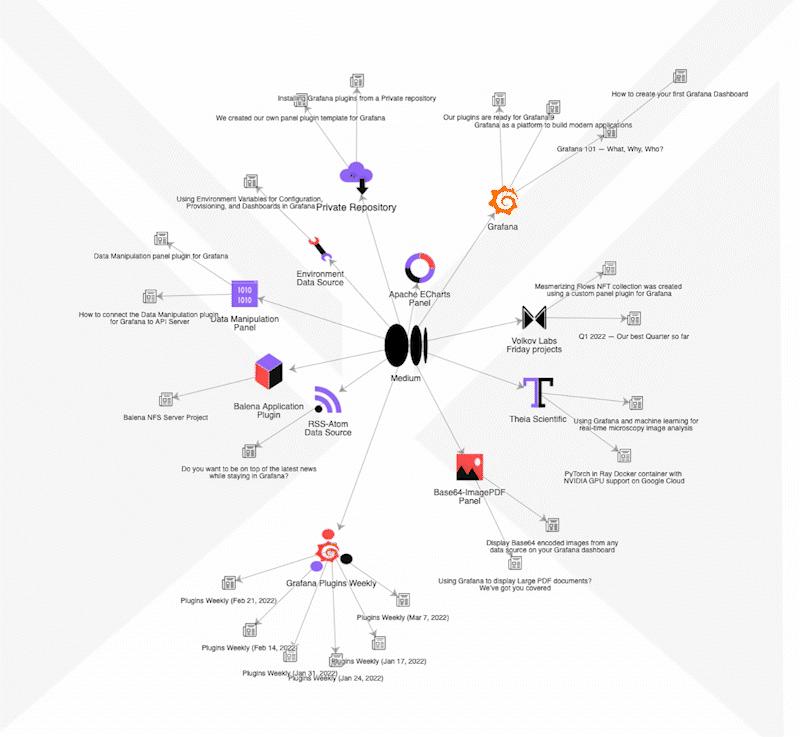
Directed graphs use force layout and automatically adjust based on the activities and connections. Elements have different icons, and style depending on the resources. Clicking on the elements allows you to open an external URL or take a closer look at the subgraphs.
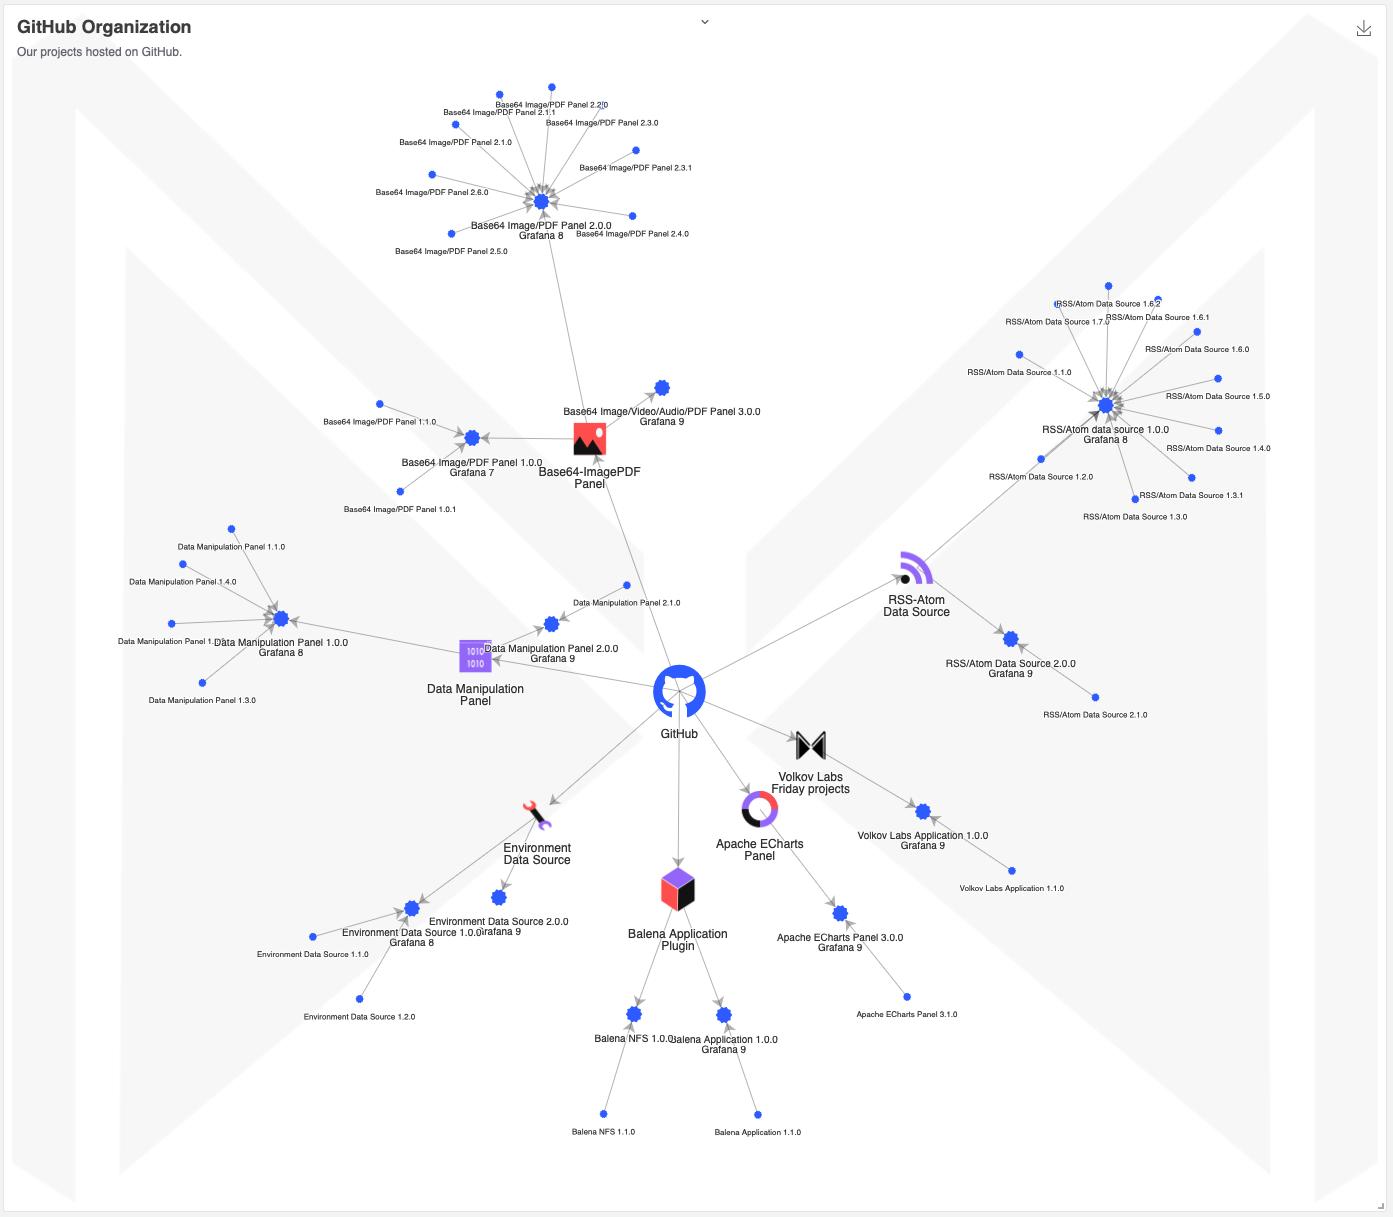
You are welcome to take a look and learn about our Grafana plugins at Project Live.
Since we adapted and released a new version for the Apache ECharts plugin, we have received overwhelming feedback from the community and helped customers migrate from an older version.
Volkov Labs just finished a project migrating industrial dashboards based on the Plotly to Apache ECharts. It also allowed us to add features like a custom toolbox button to dynamically change the charts and support the multiple Y-axis the customer was looking for.
Volkov Labs is an agency founded by long-time Grafana contributor Mikhail Volkov. We find elegant solutions for non-standard tasks.
Check out the latest plugins and projects at https://volkovlabs.io




 已为社区贡献15557条内容

所有评论(0)