
A topic shared at ApacheCon Asia 2022 recently by Liu Dingzheng, Engineering manager of Cisco Webex. Let’s reveal the stories behind Cisco Webex building the features on Apache DolphinScheduler, and how they implement Kubernetes with Apache DolphinScheduler for big data processing in the company.
Three subjects are discussed in this topic:
- Business background.
- Architecture and implementation of the features built on DolphinScheduler
- Community contribution
Business background
Why did we build the features on DolphinScheduler?
First, let me briefly introduce the Cisco Webex portfolio.
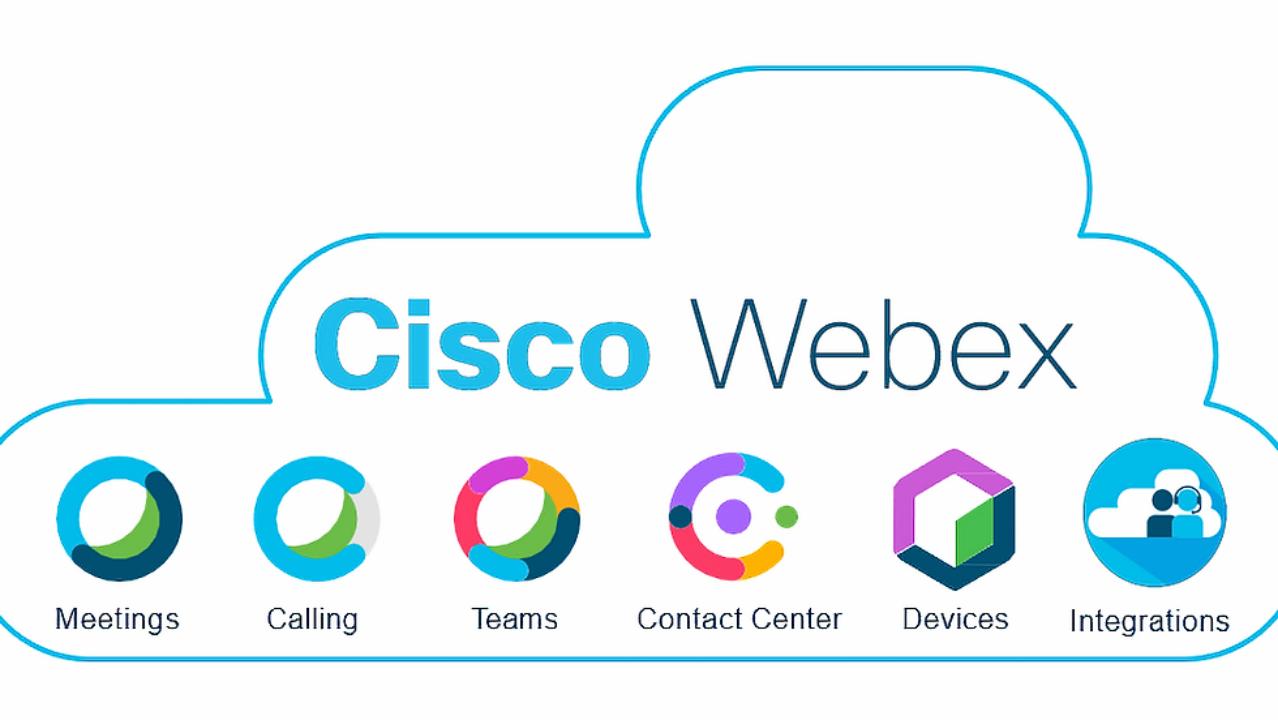
Cisco Webex San Francisco is a software company that develops and sells online conferencing, video conferencing, cloud calling services, and contact centers as service applications.
My team designs and builds the big data platforms to serve the data injection, and the data processing of workloads for the above collaboration products. Let’s take the Webex meetings product as an example, there are all kinds of metrics emitted from the Webex meetings, when you call a meeting, both client and server will send extensive amounts of metrics and logs to our Kafka clusters. Both external and internal customers rely on these metrics to troubleshoot their meeting experience or generator reports.
Also, we can offer an issue diagnostics page, which relies on the results of the ETL jobs, and the data processing jobs. In our production environments, there are a large number of Flink, Spark, and all kinds of ETL jobs running every day, both in batch and real-time.
Cisco Webex Data Islands — Before
As Webex is a global collaboration service provider, our customers span multiple time zones and continents, so we have many data centers across the world. These data centers include on-premise self-managed data centers and clusters managed by cloud providers like Amazon and Google. In the past, we would gather all the global data center data into a centralized Kafka cluster in the US using mirror maker and start data processing and ingestion from there.
But in recent years, with data bills carried out by different countries, so we build multiple clusters across the world to serve the purpose of data localization. The data model changes from a centralized cluster containing all the data from all over the world to every data center containing the data generated locally.
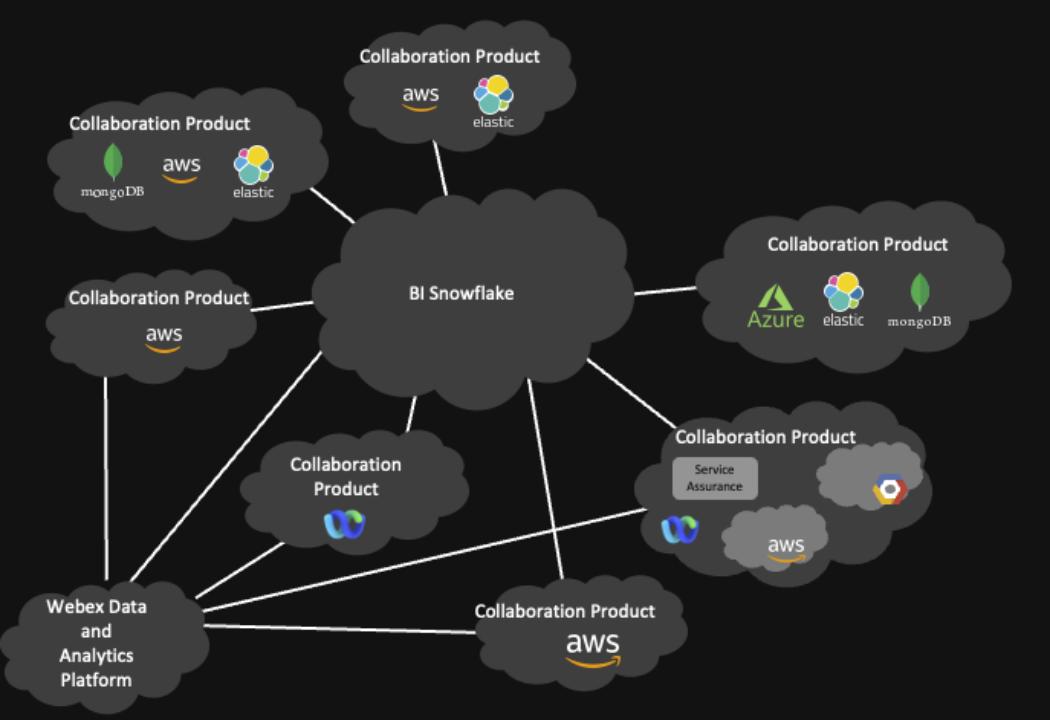
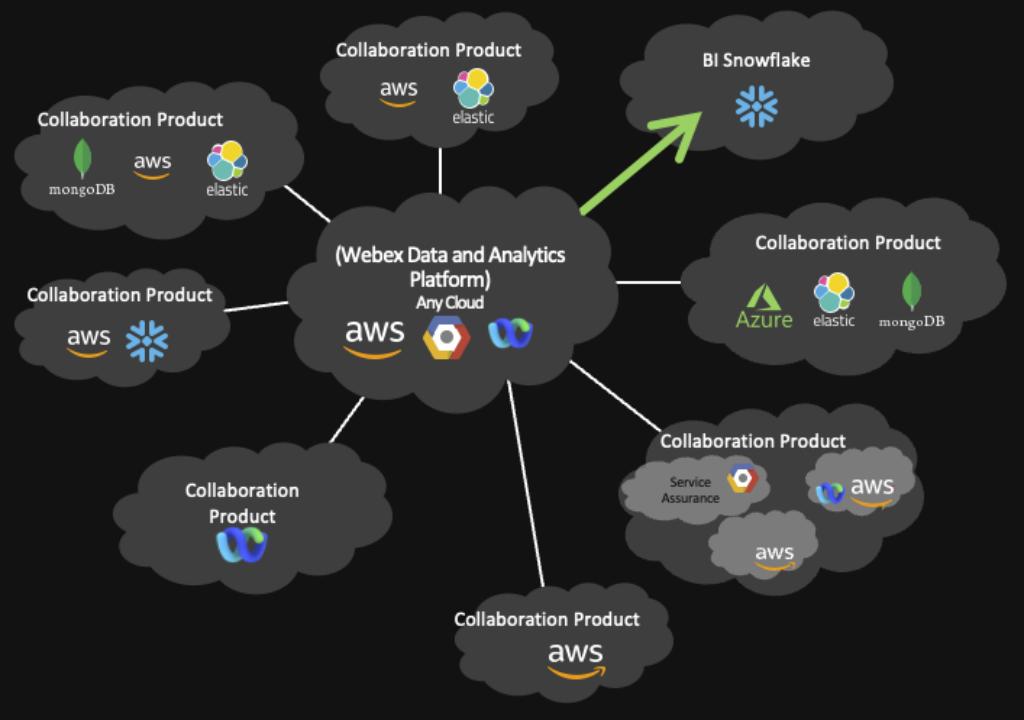
Another problem our next generation of data platforms is trying to address is the data silo problem. Webex has a lot of different types of services running on a lot of different infrastructures, like self-maintained data centers, AWS, and GCP. Basically, every collaboration product has its own implementation of data injection and data platform.
Also, its data is stored in different formats, such as HDFS cluster, private Snowflake, Google cloud storage, Azure blob storage, etc.
As for the infrastructure, we have Amazon web service, Azure, Google Cloud, and a self-maintained web sustained center, and also for the data center with the same business contest. There is no single source of truth. When the customer asks for data, it’s very hard to keep consistency between different systems.
Cisco Webex Data Islands — After
It’s our vision to build this data platform to serve every internal and external customer so that we can eliminate the data solo from the unified architecture, the data storage, and data injection technology, and all the infrastructure is consolidated within the boundary of our next-generation data platform. Our data platform will also be able to accommodate any public cloud in architecture as well as an existing private data center.
Architecture and implementation of the features built on DolphinScheduler
To make DolphinScheduler serve as a next-generation data platform for all Webex products, certain features are currently missing in the DolphinScheduler open source version. So we decided to implement these features by ourselves.
For the Kubernetes service, we build a rancher and maintain the Kubernetes cluster inside the private data center. For the public cloud, we use Amazon Elastic Kubernetes service and Google Kubernetes Engine, Amazon Elastic Kubernetes service, and Google Kubernetes Engine to manage the container service to run and scale Kubernetes application in AWS and GCP.
The data storage solution will also be unified as well. Currently, we’re using Apache Pinot for OLAP and Apache Iceberg for data storage.
By using Kubernetes as a computing cluster, we are able to separate the computing and storage clusters.
For the private data center, we are using Iceberg on top of HDFS, and we are also transitioning from CDH Hadoop to an open-source Hadoop cluster.
For the public cloud, as Iceberg is a flexible table format, so we can use it as object storage.
But it’s easier said than done. You may ask, Dolphin scheduled is just a distributed scheduling framework, how can you solve all these problems?
Our next-generation platform always comes with a much bigger scope, not only including the job scheduling parts, which is the main topic I’d like to talk about today. It also includes lineage and metadata management, data governance, and data daily integration. But I guess it’s a different topic for another day.
So when we started building this next-generation, big data platform earlier this year, we researched all kinds of different workflow data processing engines, including Airflow, Argo, and many others, but we choose DolphinScheduler because it’s elegant and easy to extend.
DolphinScheduler with Kubernetes Integration
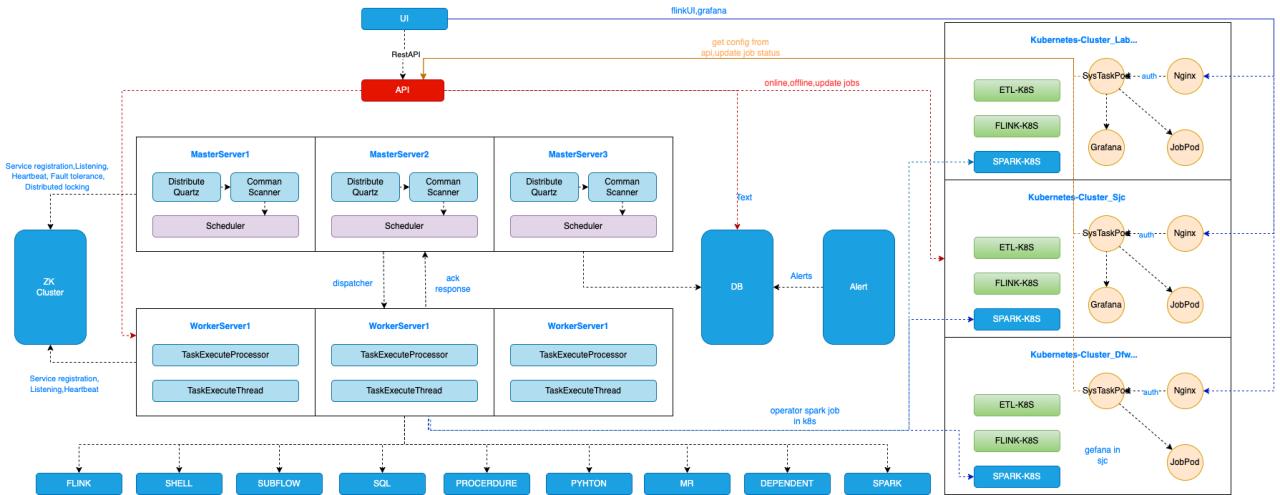
In this architectural diagram, the left part is DolphinScheduler’s features. DolphinScheduler uses multiple masters and workers with Zookeeper to guarantee high availability. Different kinds of tasks are running on these workers. All of our data processing jobs, for example, Flink, and Sparks used to be running multiple different Yarn clusters. We have a CDH cluster for batch Spark jobs and Flink jobs. We have multiple Flink jobs running a different Flink cluster. In 2021, we decided to build a Kubernetes cluster to replace the Yarn cluster, because it’s the following reasons.
- Using Kubernetes makes our daily operation much more smooth and effortless. In the DevOps principle, we are both application developers and operation owners for all the application and data processing jobs we developed. After building data pipelines and data platform features, my team also covers the CI/CD pipelines for deploying these applications and pipelines. We also build a monitoring platform based on metrics and analysis. If we want to build premises for metrics, it usually takes 1 or 2 days for the infrastructure provisioning and service building, even using automation scripts. But it takes literally 2 minutes if we use the Prometheus Operator in Kubernetes.
- The second reason for onboarding Kubernetes is that it allows us to deploy all kinds of containerized services inside it. Yarn supports all kinds of JVM-based jobs, for example, Flink, Spark jobs and batch jobs, and real-time jobs. While Kubernetes supports even more kinds of jobs, actually as long as it’s in a containerized image. Prometheus and Redis also can run in the same cluster. It saves us a lot of our operation work by utilizing the hybrid development characteristics of Kubernetes. We used to deploy our data platform serves as a dedicated VMS. Now, we have this separate monitoring cluster with Prometheus operators installed for all the data processing jobs. Now, all the services as a monitoring component are consolidated within a single Kubernetes cluster. Also, the CI/CD pipeline is much easier to maintain because everything is in Kubernetes.
Because all of our data processing jobs are running on the Kubernetes cluster, we extended the features of DolphinScheduler and submitted most of them back to the community.
For example, we integrated the Flink, Spark, and Kubernetes features with DolphinScheduler.
We divided our data processing workloads into two categories, batch and real-time.
For real-time, we concluded that 80% of the real-time jobs are some kind of simple extract, transform and load. But there are many of them, for example, the raw data injection to the data warehouse ODS layer is a complex case. This raw data injection pipeline takes up a big amount of total pipelines. Usually, the logic for these pipelines is very simple. The typical logic is consuming data from some Kafka port, doing some filtering logic based on field value or regular expression, then extracting all the fields needed and sinking the data into the data lake.
Instead of writing a Flink job for each of these simple pipelines, we developed a lightweight data processing engine that can scale automatically using K8s HPA metrics. Creating such jobs is also very easy. When you use the front and framework of DolphinScheduler, we can generate the data processing pipeline by simple drag and drop.
Multi-Cluster ETL Job Management
One typical use case for our platform users is to deploy the same job on multiple clusters with slight differences in configurations indicating different competitor centers. The data processing logic inside each of these jobs is identical. The only difference is the source cluster, topic name, and the sink connection between each different data center.
To minimize the deployment effort, we deploy this one-click development, and multiple clusters features by generalizing the common processing logic and substituting the required configuration for each cluster. A centralized DolphinScheduler is deployed as a job scheduling platform for all the data processing jobs, running different data centers. The higher reliability of the centralized DolphinScheduler is achieved by the DolphinScheduler instance in other data centers. When the user submits a new job to different clusters, DolphinScheduler will distribute the extra use examples and files to destination clusters based on user selection and then run the jobs. The resources for running jobs are managed on DolphinScheduler, this means we can set the CPU memory limit for each Namespace on different Kubernetes clusters.
We also added Pagerduty and Webex teams to DolphinScheduler as plug-ins, as these two are common tools for us to track the instance if something wrong happens.
Usually, the user wants to trigger the Pagerduty instance and send messages to the Webex team together, so we changed a lot of rules to support triggering multiple plugins with one configuration. We submitted these two features in the Alert module back to the community.
Kubernetes Multi-Cluster Management
Let’s take a look at the multi-cluster resource management feature.
We built many Kubernetes computing clusters all around the world in private data centers or public clouds like AWS. To make DolphinScheduler able to submit and manage jobs for all these data centers, we first implement this Namespace and Cluster management feature on DolphinScheduler.
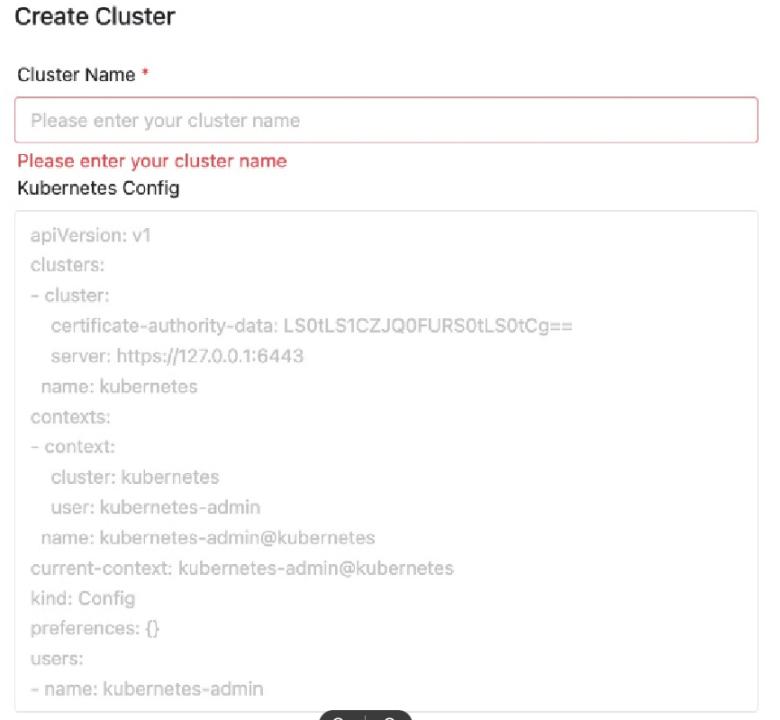
When the new cluster is created using Terraform or Kubeadm, users will export the required config for this unique cluster. For example, the certificate authority and cluster name. Then by copy-pasting this to DolphinScheduler, a customer management page, and a new cluster is added. Basically, job submission and management are done using the Kubernetes client integrated into DolphinScheduler. After a cluster is imported, we are then able to create Namespace for each of the user groups.
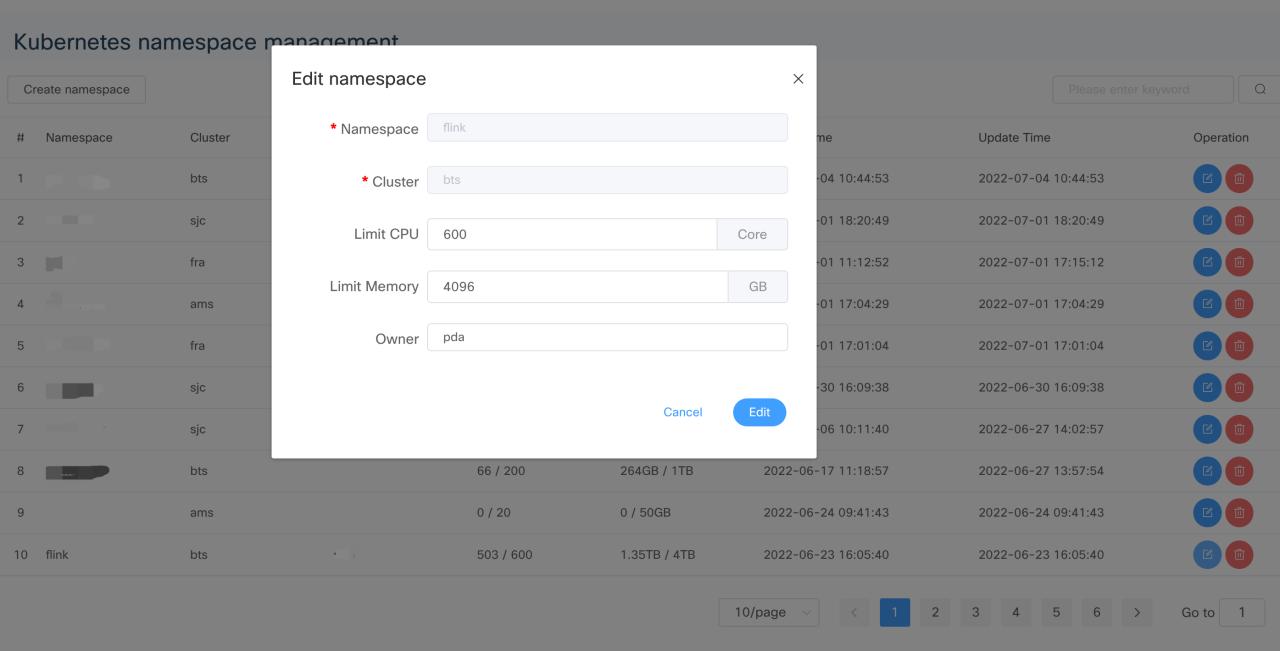
Kubernetes Multi-Cluster Namespace Management
The namespace is associated with the DolphinScheduler project, meaning that the resource limitation for that project is bound to CPU memory settings in this Namespace.
Cisco Webex Data Residency
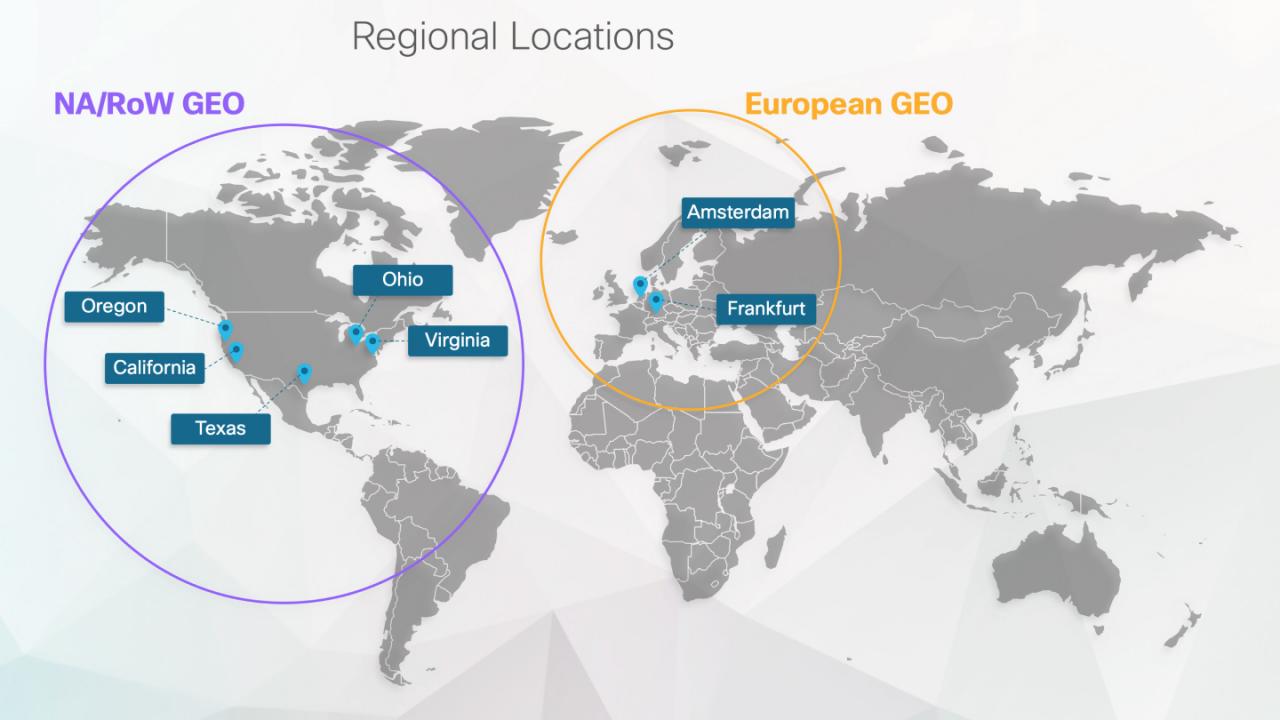
Cisco Webex Data Residency
With so many data centers to manage, higher liability is a key point for our customers.
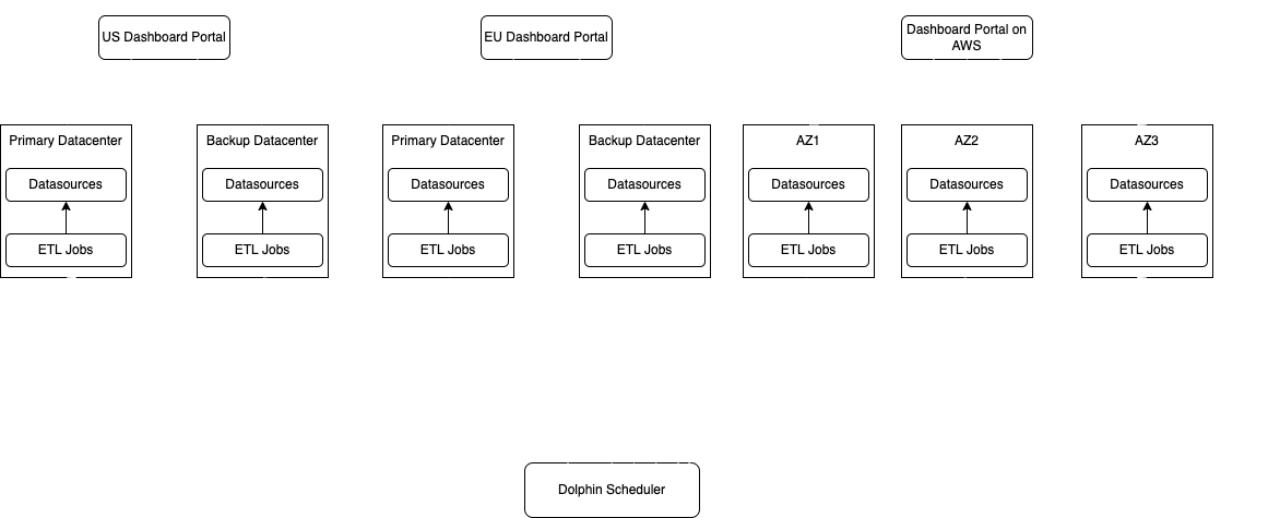
For private centers, we have a backup Kubernetes for high-reliability data generations. If a Kubernetes cluster fails for some reason, we can switch the backup cluster seamlessly. Some of our business adopts active way to guarantee all the data processing jobs running both primary and backup clusters at the same time. The active way will consume double the size of resources, and it’s only for latency-sensitive and mission-critical businesses. Most of our businesses were inactive in standby mode, so the backup clusters data will only be populated once the primitive center field. This approach will also require some recovery time to sink the data between the two primary and backup clusters, but it will consume fewer resources.
As for AWS-managed clusters, AWS offers three availability zones in each region for HA. This approach is more or less the same as our private data center approach, the difference is that AWS offers one extra AZ for better HA.
Simple ETL pipeline
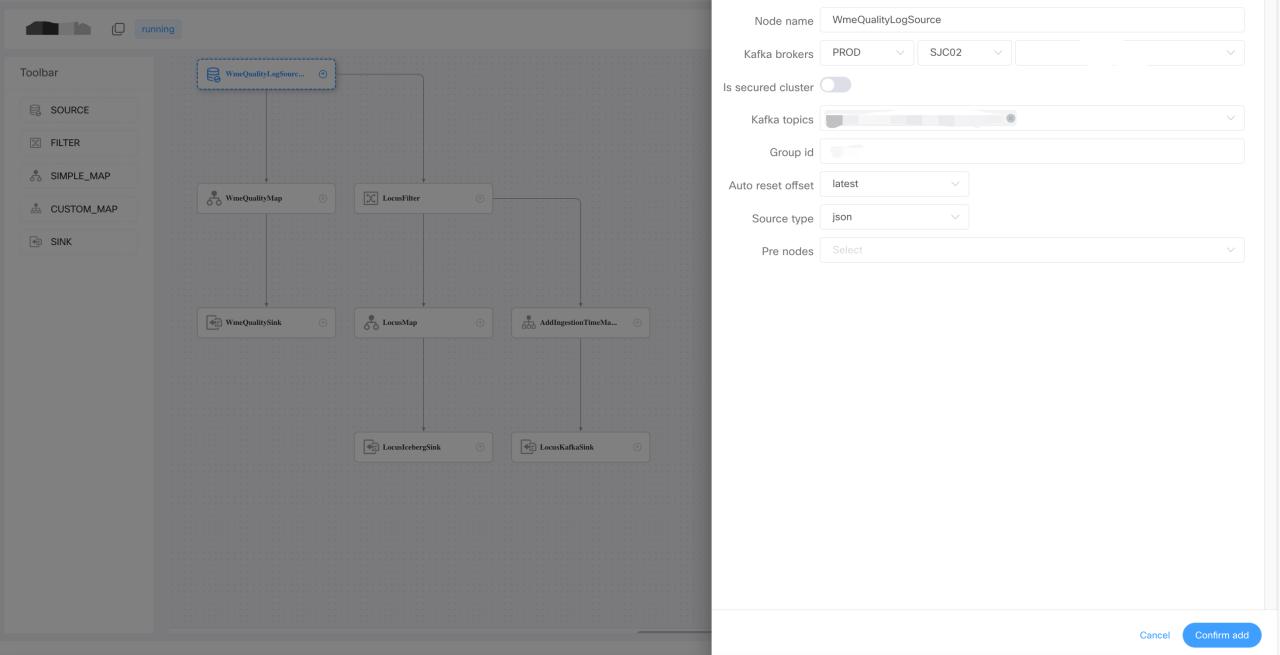
For simple processing jobs without complicated competing logic, we developed a drag-and-drop pipeline generation framework on DolphinScheduler.
Users can generate a complex, real-time data processing pipeline by dragging and dropping on canvas. By configuring the pre-defined source filter map and sync operators, the user does not have to write any code. One thing that was mentioned is that we integrated the metadata in the data hub for source and map operators. So when users choose which topic they want to consume, the jobs on the list here are from the API data in the data hub. Instead of typing the topping name and Kafka cluster configuration string on the portal, it’s automatically fetched from the data hub. In the map operator, the user can apply different kinds of user-defined functions for each of the fields.
The field list also comes from the data hub. Let’s say a topic contains 1,000 fields inside of typing fields, one by one like a traditional pipeline definition tool, a simple select all with one click will do the job in our framework.
UDF Management
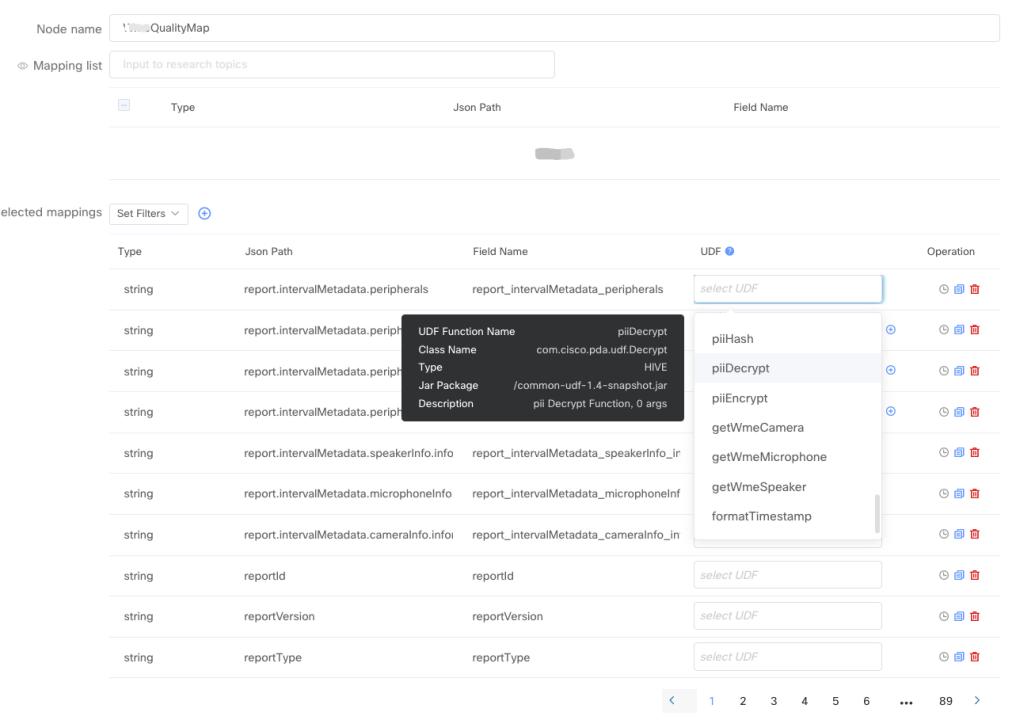
Simple ETL pipeline — UDF Management
The UDF creation and management is fully automated, users only need to provide UDF logic in Java or Scala snippet.
Then we’ll do the rest, including UDF packaging, upholding, and registering to different Kubernetes engines for them. This framework also provides a comprehensive amount of metrics for troubleshooting. Out of these metrics, we defined formula for data processing parts to be skilled automatically using HPA.
Automatic Scaling
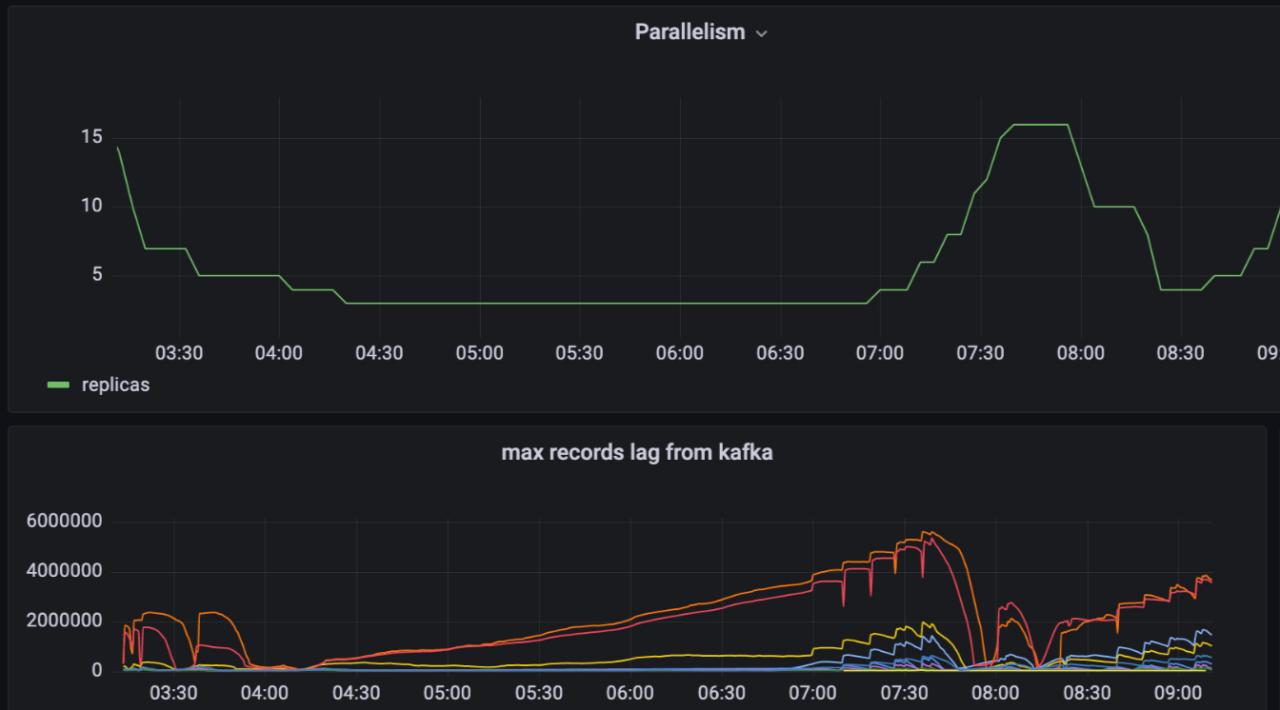
As you can see from the metrics, the parallelism of our data processing ports will match the data volume from upstream Kafka. We save a large number of resources by bringing this automatic scaling feature to our customers.
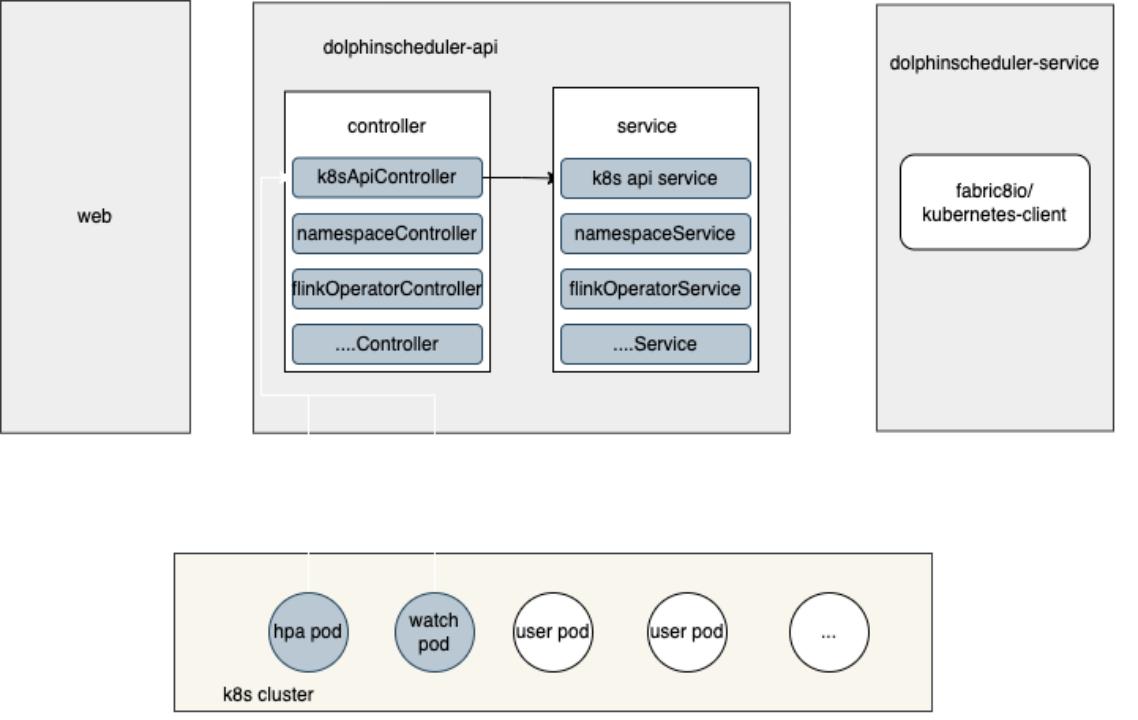
In order to get the most accurate and up-to-date job and parallelism status on the portal, we implemented this monitory feature based on Kubernetes API in the format of a long-running pod in the Kubernetes cluster.
Let’s say when this job scales down from two parts to one part, the monitoring part will update the database tables, parallelism, and field for that job. Also, when the job started a field, the monitoring report will catch these changes and update the corresponding record in the database.
Flink Jobs on Kubernetes
So we also build the Flink jobs on Kubernetes features in DolphinScheduler. Some of you may be confused because DolphinScheduler already has the Flink task port in the workflow. While the Flink task in DolphinScheduler is for Yarn only, we intended to run all our jobs on the Kubernetes cluster. We direct this feature by adding the Kubernetes-related API in the current DolphinScheduler architecture so that Flink jobs to Kubernetes are possible.
We also compare the native Flink on Kubernetes mode and Kubernetes operator for Flink on Kubernetes back end. Kubernetes operator it’s the most flexible way since we don’t have to build the image for each job. And it’s the most cognitive way for many jobs to run on the Kubernetes cluster.
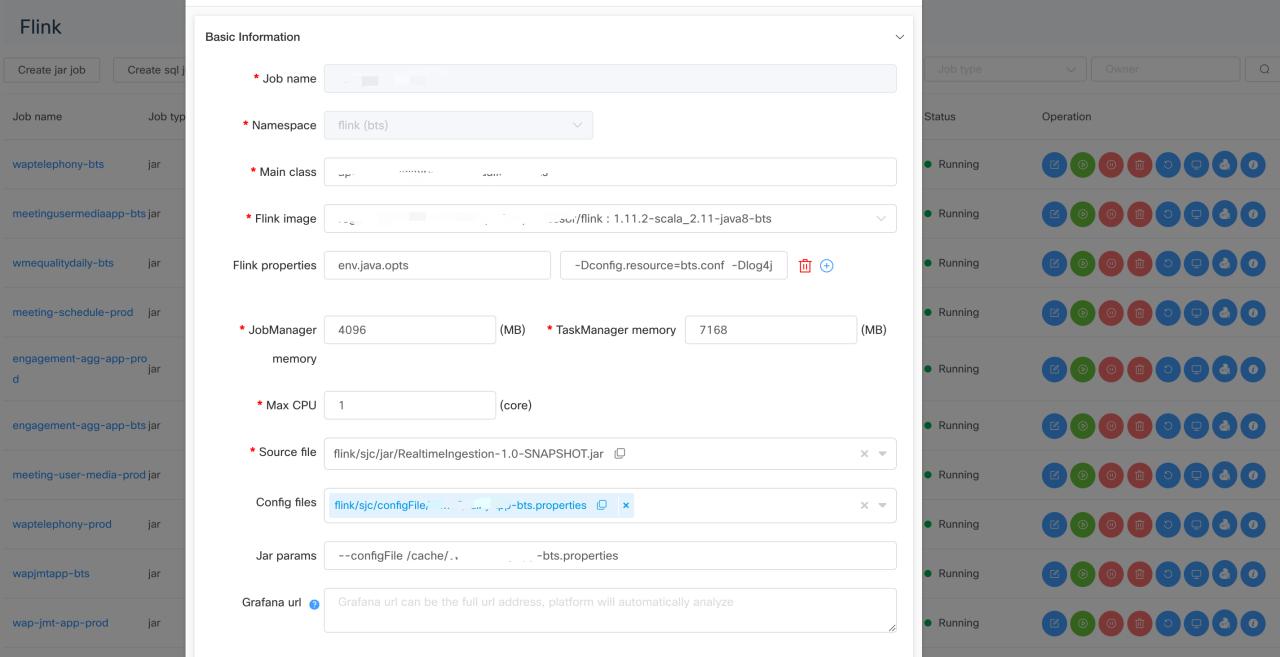
- Flink Jar jobs support
On the jobs portal, users can submit either Flink job in jar format or pure SQL format.
- Flink SQL jobs support
For SQL jobs, we will pack the SQL scripts into Jar format, then follow the same submission logic as jar format files. We also provide a lot of pre-defined metrics for both of these two formats. User can add their customized metrics and grammar and create their own business-minded alert rule.
- Time ranged scaling
We also support the time scaling feature for all the Flink jobs. The users can define different parallelism for different periods of time. For most of our collaboration products, the data volume follows the same chain, which is that the data search will come between 8:00 pm to eight am China time because most of our customers are European and North American corporate users. So during these peak hours, users can set relatively high parallelism for their jobs so that there will be no back pressure, and the latest logs can be processed without delay. In the non-peak hours, data volume is usually 1/3 of the peak hours.
Basically, we can scale down the parallelism based on user configuration. By importing this mechanism, we save thousands of CPU costs during nonpeak hours. Usually, all the batch jobs are running in the non-peak hours using resources saved by time range scaling of Flink jobs and HPA of the ETL jobs.
By saving these resources, we can also add less service into the Kubernetes cluster, so the total cost of operation effort is also much less compared to our old solution without scaling. The status and parallelism for all the Flink jobs are also monitored by a long-running port, following the same design principle, as I mentioned before.
Kubernetes batch job
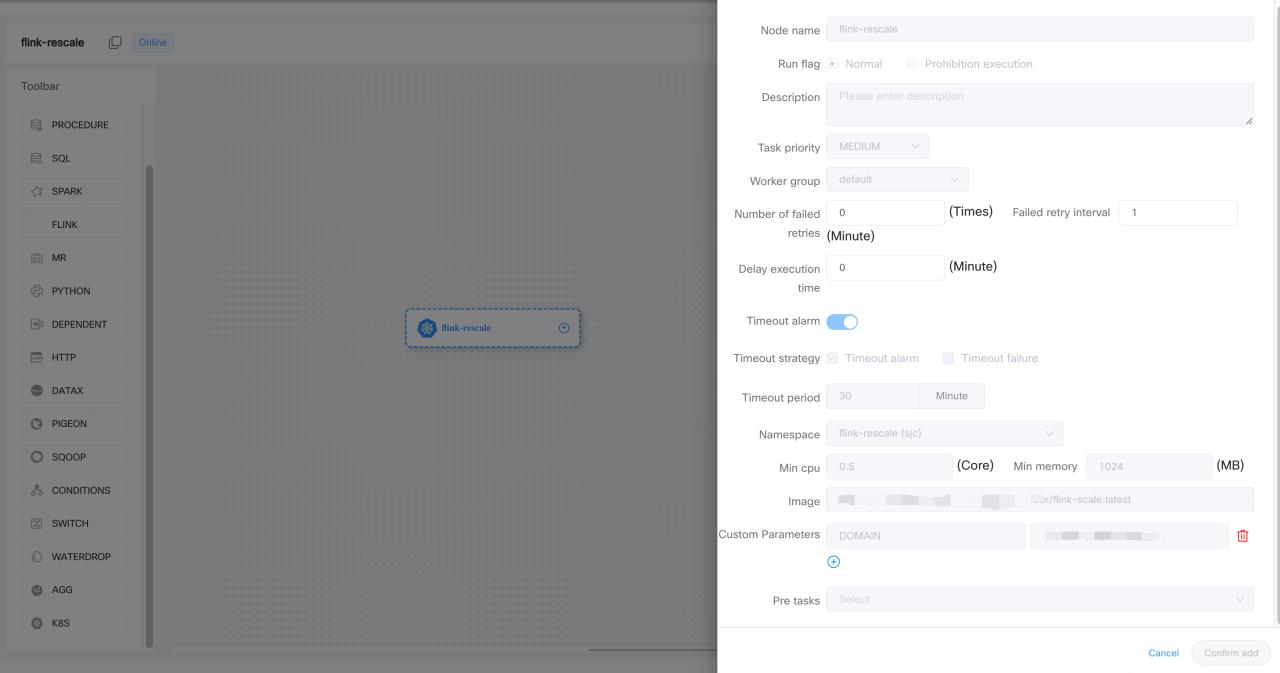
Enough talk with the real-time jobs. Let’s take a look at the batch jobs. Now, the use case for the Kubernetes job is to run a continuous image on the Kubernetes cluster for one time or at a scheduled time every day. In this scenario, the DolphinScheduler worker just acts as the job submitter and the status reporter for the Kubernetes job. The extra execution for user code in the container will happen in the Kubernetes cluster. So for the computing-intensive tasks, we shall take a lot of CPUs and memory.
Not all type of task is currently supported by DolphinScheduler yet. Just like any other tasks or job runs running on Kubernetes, the Kubernetes batch job also comes with Namespace integration. Users can choose which Namespace they want a batch job to write a log. We also implemented the Namespace access control, so users can only view the namespace assigned to them because every namespace has an upper limit for CPU and memory usage. Batch job achieves better resource management and association.
SQL Task Customization
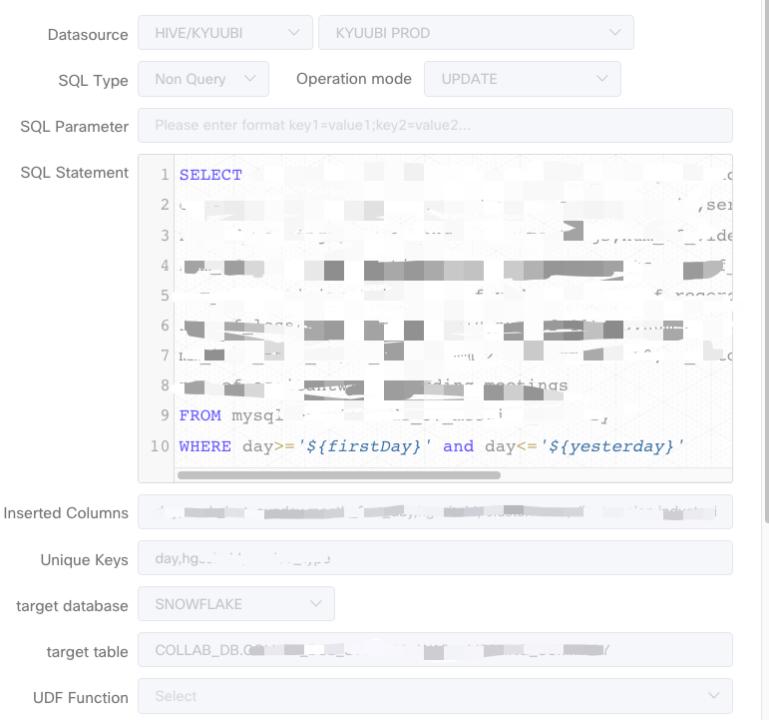
We also did some work on the SQL task customization. SQL task is building task type in DolphinScheduler. The use case for us is to run ETL jobs in circle format using Apache Kube. These ETL jobs usually come in a batch way. The SQL is provided by its customers. And data source is usually our data lake.
There are multiple things for the resource data, pushing the resource data to Snowflake and Iceberg covers 90% of our use case.
- Snowflake Support in SQL Task
The first customization of the SQL task is we added the sink selection on the task UI. It’s easy for users to sink into the UI for the location of the data to be stored.
- Upsert feature for Snowflake Spark connector
The second customization is on the Spark center for Snowflake, because we want to support multiple Snowflakes, we implemented this Spark Snowflake catalog for the data source in version two. We also implemented the upsert grammar in the Snowflake connector to support update use cases. We have submitted both of the features back to the Snowflake and Spark communities.
Community Contribution
I’d like to summarize the community contribution we have made. All the features I mentioned are up and running in our production environment right now. We contributed most of the features to the community because we think they might be useful for other users.
Firstly, we contributed the front UI, back-end service of Kubernetes Namespace management, and multiple Kubernetes cluster management features to the community. This feature is a cornerstone for other parts of the Kubernetes and DolphinScheduler integration.
Also, we contributed the Kubernetes batch task to the community. Now users can create a workflow with Kubernetes batch in it.
As for the Alert plugins, we added page duty and Webex teams in the alert module. Besides, we also fix the LDAP login feature for DolphinScheduler 3 . 0.
That’s all for today. Hope you enjoy it.
Join the Community
There are many ways to participate and contribute to the DolphinScheduler community, including:
Documents, translation, Q&A, tests, codes, articles, keynote speeches, etc.
We assume the first PR (document, code) to contribute to be simple and should be used to familiarize yourself with the submission process and community collaboration style.
So the community has compiled the following list of issues suitable for novices: https://github.com/apache/dolphinscheduler/issues/5689
List of non-newbie issues: https://github.com/apache/dolphinscheduler/issues?q=is%3Aopen+is%3Aissue+label%3A%22volunteer+wanted%22
How to participate in the contribution: https://dolphinscheduler.apache.org/en-us/community/development/contribute.html
GitHub Code Repository: https://github.com/apache/dolphinscheduler
Official Website:https://dolphinscheduler.apache.org/
MailList:dev@dolphinscheduler@apache.org
Twitter:@DolphinSchedule
YouTube:https://www.youtube.com/channel/UCmrPmeE7dVqo8DYhSLHa0vA
Slack:https://s.apache.org/dolphinscheduler-slack
Contributor Guide:https://dolphinscheduler.apache.org/en-us/community/index.html
Your Star for the project is important, don’t hesitate to lighten a Star for Apache DolphinScheduler ❤️


 已为社区贡献15557条内容

所有评论(0)