
kubernetes日志收集方案 ELK(一)
一、为什么收集日志
收集日志可以用于:
- 分析用户行为
- 监控服务器状态
- 增强系统或应用安全性等。
二、收集哪些日志
- kubernetes集群节点系统日志
- kubernetes集群节点应用程序日志
- kubernetes集群中容器部署的应用程序日志
三、日志收集方案
日志收集技术栈ELK + Filebeat
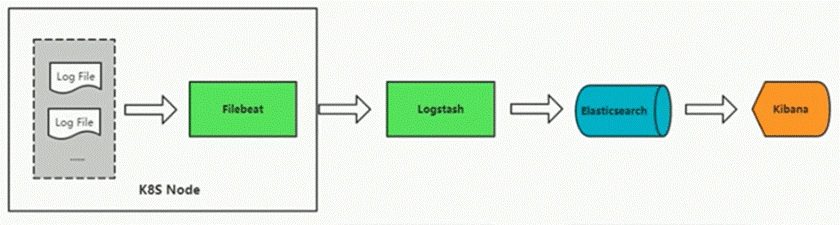
Filebeat:部署在各节点,负责收集日志
Logstash:负责过滤、格式化日志
ElasticSearch:用于存储、搜索和分析日志
Kibana:展示日志数据、监控系统状态
注:
Logstash本身可以部署在节点直接收集数据,但filebeat更轻量
四、ELK集群部署
为了增加ELK集群的运行效率,一般建议在k8s集群之外使用物理机部署ELK集群,当然也可以直接在k8s集群内部署。
4.1 主机准备(有条件的话应该将各组件部署在不同主机上,并配置群集)
|
主机 |
软件 |
版本 |
配置 |
IP |
|
kibana |
kibana |
7.17.2 |
2C4G |
192.168.10.14 |
|
elastic |
elasticsearch |
7.17.2 |
2C4G |
192.168.10.14 |
|
logstash |
logstash |
7.17.2 |
2C4G |
192.168.10.14 |
# hostname set-hostname xxx
# cat /etc/hosts
192.168.10.14 kibana
192.168.10.14 elastic
192.168.10.14 logstash
4.2 软件安装
由于软件下载较慢,请提前准备好以下软件。
4.2.1 安装jdk
所有主机全部安装,可考虑使用openjdk也可以使用oracle jdk。
[root@kibana ~]# yum -y install java-11-openjdk
[root@elastic ~]# yum -y install java-11-openjdk
[root@logstash ~]# yum -y install java-11-openjdk
4.2.2 安装kibana
# wget https://artifacts.elastic.co/downloads/kibana/kibana-7.17.2-x86_64.rpm
# yum -y install kibana-7.17.2-x86_64.rpm
4.2.3 安装elasticsearch
# wget https://artifacts.elastic.co/downloads/elasticsearch/elasticsearch-7.17.2-x86_64.rpm
# yum -y install elasticsearch-7.17.2-x86_64.rpm
4.2.4 安装logstash
# wget https://artifacts.elastic.co/downloads/logstash/logstash-7.17.2-x86_64.rpm
# yum -y install logstash-7.17.2-x86_64.rpm
4.3 软件配置及启动
4.3.1 kibana软件配置及启动
修改/etc/kibana/kibana.yml配置文件如下:
[root@kibana ~]# cat -n /etc/kibana/kibana.yml | grep -v "#" | grep -v "^$"
2 server.port: 5601
7 server.host: "192.168.10.14"
32 elasticsearch.hosts: ["http://192.168.10.14:9200"]
115 i18n.locale: "zh-CN"
说明:
server.port 是开启kibana监听端口
server.host 设置远程连接主机IP地址,用于远程访问使用
elasticsearch.hosts 设置elasticsearch.hosts主机IP,用于连接elasticsearch主机,可以为多个值
i18n.locale 设置语言支持,不需要再汉化,直接修改后即可支持中文
[root@kibana ~]# systemctl enable kibana
[root@kibana ~]# systemctl start kibana
[root@kibana ~]# ss -anput | grep ":5601"
tcp LISTEN 0 128 192.168.10.14:5601 *:* users:(("node",pid=2571,fd=71))
4.3.2 elasticsearch软件配置及启动
修改配置文件elasticsearch.yml如下:
[root@elastic ~]# cat -n /etc/elasticsearch/elasticsearch.yml | grep -v "#" | grep -v "^$"
17 cluster.name: k8s-elastic
23 node.name: elastic
33 path.data: /var/lib/elasticsearch
37 path.logs: /var/log/elasticsearch
56 network.host: 192.168.10.14
61 http.port: 9200
70 discovery.seed_hosts: ["192.168.10.14"]
74 cluster.initial_master_nodes: ["192.168.10.14"]
说明
cluster.name 集群名称
node.name 节点名称
path.data 数据目录
path.logs 日志目录
network.host 主机IP
http.port 监听端口
discovery.seed_hosts 主机发现列表
cluster.initial_master_nodes 集群master节点
启动服务并验证
[root@elastic ~]# systemctl enable elasticsearch
[root@elastic ~]# systemctl start elasticsearch
[root@elastic ~]# ss -anput | grep ":9200"
tcp LISTEN 0 128 [::ffff:192.168.10.14]:9200 [::]:* users:(("java",pid=9726,fd=219))
[root@elastic ~]# curl http://192.168.10.14:9200
{
"name" : "elastic",
"cluster_name" : "k8s-elastic",
"cluster_uuid" : "cW78ZkrhS4OV41DV5CtWWQ",
"version" : {
"number" : "7.17.2",
"build_flavor" : "default",
"build_type" : "rpm",
"build_hash" : "de7261de50d90919ae53b0eff9413fd7e5307301",
"build_date" : "2022-03-28T15:12:21.446567561Z",
"build_snapshot" : false,
"lucene_version" : "8.11.1",
"minimum_wire_compatibility_version" : "6.8.0",
"minimum_index_compatibility_version" : "6.0.0-beta1"
},
"tagline" : "You Know, for Search"
}
4.3.3 logstash软件配置及启动
4.3.3.1 修改配置文件/etc/logstash/logstash.yml如下:
[root@logstash ~]# cat -n /etc/logstash/logstash.yml | grep -v "#" | grep -v "^$"
19 node.name: logstash
28 path.data: /var/lib/logstash
133 api.http.host: 192.168.10.14
139 api.http.port: 9600-9700
280 path.logs: /var/log/logstash
4.3.3.2 启动服务
logstash进程不用预先启动,使用时启动即可
4.3.3.3 验证logstash可用性
标准输入及标准输出验证
[root@logstash ~]# /usr/share/logstash/bin/logstash -e 'input {stdin{} } output {stdout {} }'
Using bundled JDK: /usr/share/logstash/jdk
OpenJDK 64-Bit Server VM warning: Option UseConcMarkSweepGC was deprecated in version 9.0 and will likely be removed in a future release.
WARNING: Could not find logstash.yml which is typically located in $LS_HOME/config or /etc/logstash. You can specify the path using --path.settings. Continuing using the defaults
Could not find log4j2 configuration at path /usr/share/logstash/config/log4j2.properties. Using default config which logs errors to the console
[INFO ] 2022-04-07 16:34:16.332 [main] runner - Starting Logstash {"logstash.version"=>"7.17.2", "jruby.version"=>"jruby 9.2.20.1 (2.5.8) 2021-11-30 2a2962fbd1 OpenJDK 64-Bit Server VM 11.0.14.1+1 on 11.0.14.1+1 +indy +jit [linux-x86_64]"}
[INFO ] 2022-04-07 16:34:16.339 [main] runner - JVM bootstrap flags: [-Xms1g, -Xmx1g, -XX:+UseConcMarkSweepGC, -XX:CMSInitiatingOccupancyFraction=75, -XX:+UseCMSInitiatingOccupancyOnly, -Djava.awt.headless=true, -Dfile.encoding=UTF-8, -Djruby.compile.invokedynamic=true, -Djruby.jit.threshold=0, -Djruby.regexp.interruptible=true, -XX:+HeapDumpOnOutOfMemoryError, -Djava.security.egd=file:/dev/urandom, -Dlog4j2.isThreadContextMapInheritable=true]
[INFO ] 2022-04-07 16:34:16.385 [main] settings - Creating directory {:setting=>"path.queue", :path=>"/usr/share/logstash/data/queue"}
[INFO ] 2022-04-07 16:34:16.423 [main] settings - Creating directory {:setting=>"path.dead_letter_queue", :path=>"/usr/share/logstash/data/dead_letter_queue"}
[WARN ] 2022-04-07 16:34:16.890 [LogStash::Runner] multilocal - Ignoring the 'pipelines.yml' file because modules or command line options are specified
[INFO ] 2022-04-07 16:34:16.956 [LogStash::Runner] agent - No persistent UUID file found. Generating new UUID {:uuid=>"608c9b46-8138-44b6-8cd8-c42d0fb08a90", :path=>"/usr/share/logstash/data/uuid"}
[INFO ] 2022-04-07 16:34:18.587 [Api Webserver] agent - Successfully started Logstash API endpoint {:port=>9600, :ssl_enabled=>false}
[INFO ] 2022-04-07 16:34:19.018 [Converge PipelineAction::Create<main>] Reflections - Reflections took 76 ms to scan 1 urls, producing 119 keys and 419 values
[WARN ] 2022-04-07 16:34:19.571 [Converge PipelineAction::Create<main>] line - Relying on default value of `pipeline.ecs_compatibility`, which may change in a future major release of Logstash. To avoid unexpected changes when upgrading Logstash, please explicitly declare your desired ECS Compatibility mode.
[WARN ] 2022-04-07 16:34:19.590 [Converge PipelineAction::Create<main>] stdin - Relying on default value of `pipeline.ecs_compatibility`, which may change in a future major release of Logstash. To avoid unexpected changes when upgrading Logstash, please explicitly declare your desired ECS Compatibility mode.
[INFO ] 2022-04-07 16:34:19.839 [[main]-pipeline-manager] javapipeline - Starting pipeline {:pipeline_id=>"main", "pipeline.workers"=>2, "pipeline.batch.size"=>125, "pipeline.batch.delay"=>50, "pipeline.max_inflight"=>250, "pipeline.sources"=>["config string"], :thread=>"#<Thread:0xc108bf4 run>"}
[INFO ] 2022-04-07 16:34:20.536 [[main]-pipeline-manager] javapipeline - Pipeline Java execution initialization time {"seconds"=>0.69}
WARNING: An illegal reflective access operation has occurred
WARNING: Illegal reflective access by com.jrubystdinchannel.StdinChannelLibrary$Reader (file:/usr/share/logstash/vendor/bundle/jruby/2.5.0/gems/jruby-stdin-channel-0.2.0-java/lib/jruby_stdin_channel/jruby_stdin_channel.jar) to field java.io.FilterInputStream.in
WARNING: Please consider reporting this to the maintainers of com.jrubystdinchannel.StdinChannelLibrary$Reader
WARNING: Use --illegal-access=warn to enable warnings of further illegal reflective access operations
WARNING: All illegal access operations will be denied in a future release
[INFO ] 2022-04-07 16:34:20.602 [[main]-pipeline-manager] javapipeline - Pipeline started {"pipeline.id"=>"main"}
The stdin plugin is now waiting for input:
[INFO ] 2022-04-07 16:34:20.662 [Agent thread] agent - Pipelines running {:count=>1, :running_pipelines=>[:main], :non_running_pipelines=>[]}
abc # 输入abc字符,查看其输出
{
"@timestamp" => 2024-06-30T22:29:29.833Z,
"message" => "abc",
"@version" => "1",
"host" => "bogon"
}
以json格式输出abc内容
按Ctrl+C终止
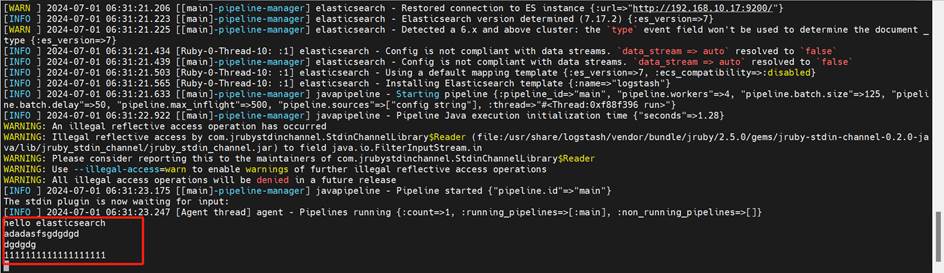
使用logstash输入内容到elasticsearch验证
[root@logstash ~]# /usr/share/logstash/bin/logstash -e 'input { stdin{} } output { elasticsearch { hosts => ["192.168.10.14:9200"] index => "logstash-%{+YYYY.MM.dd}" } }'
。。。
The stdin plugin is now waiting for input:
[INFO ] 2024-07-01 06:31:23.247 [Agent thread] agent - Pipelines running {:count=>1, :running_pipelines=>[:main], :non_running_pipelines=>[]}
hello elasticsearch #键盘输入内容
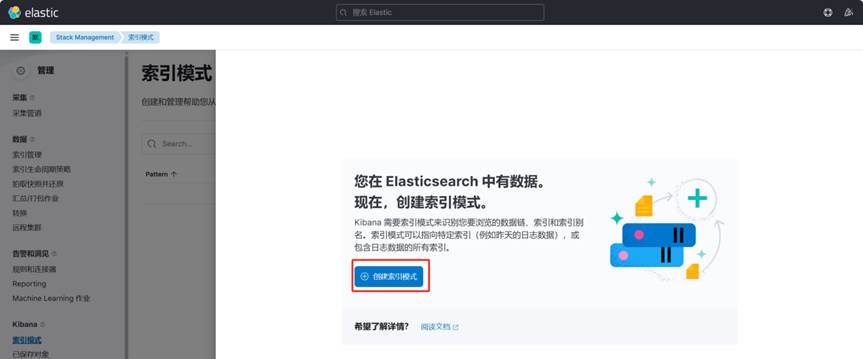
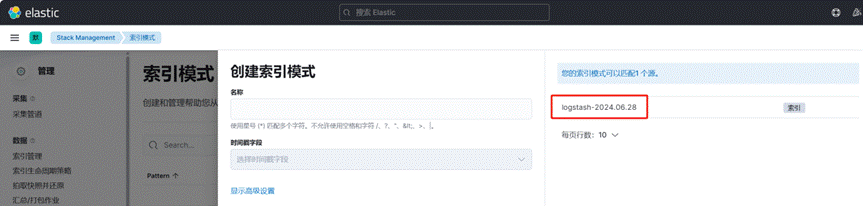
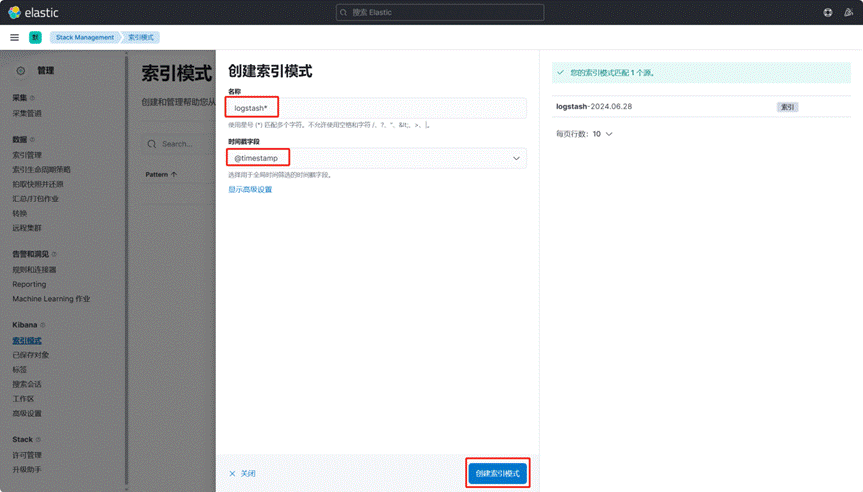
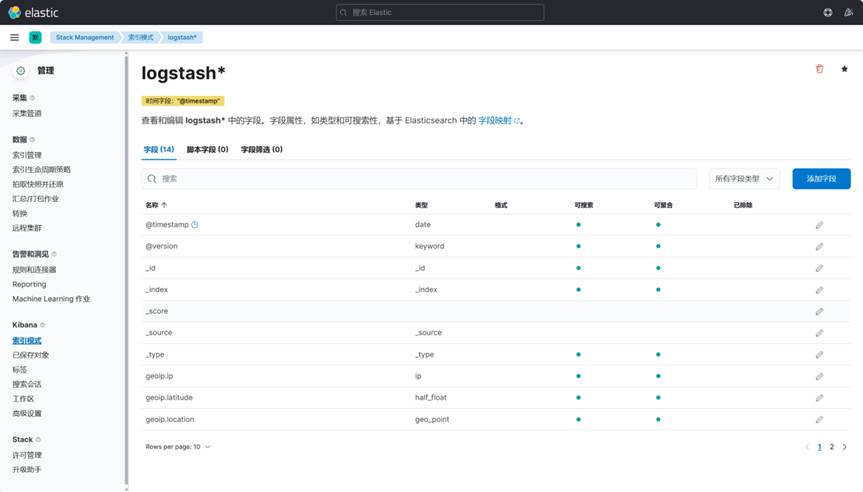
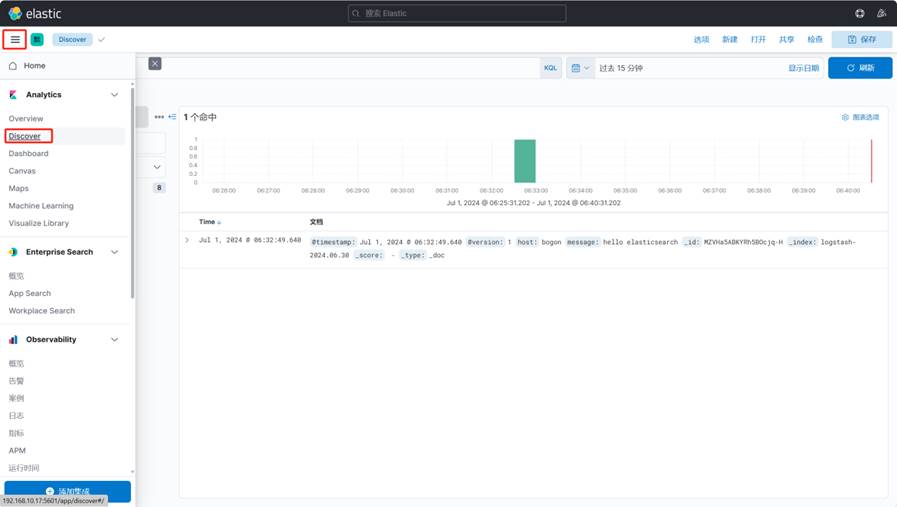
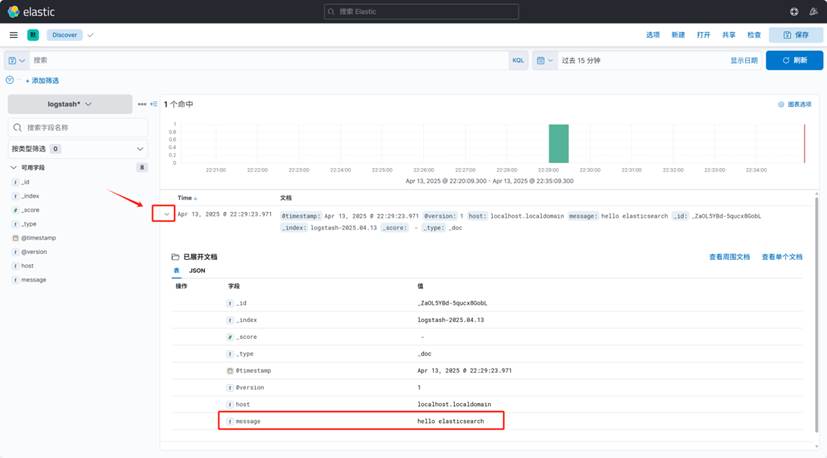
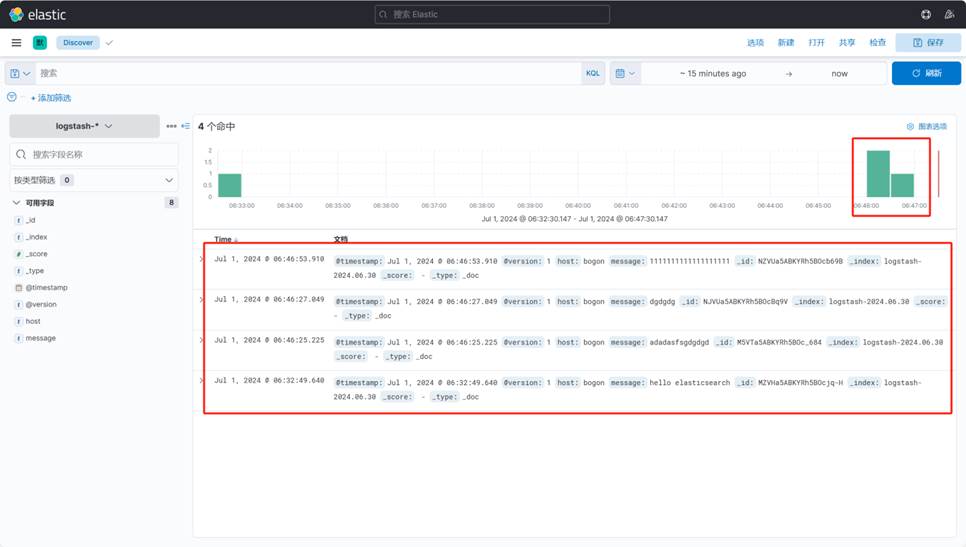
此内容将会通过kibana页面中的索引看到,但是需要在kibana页面中添加索引
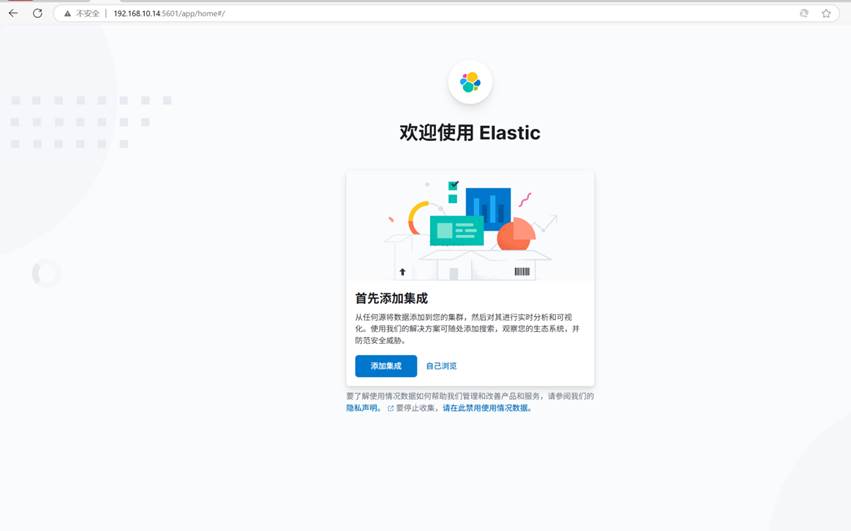
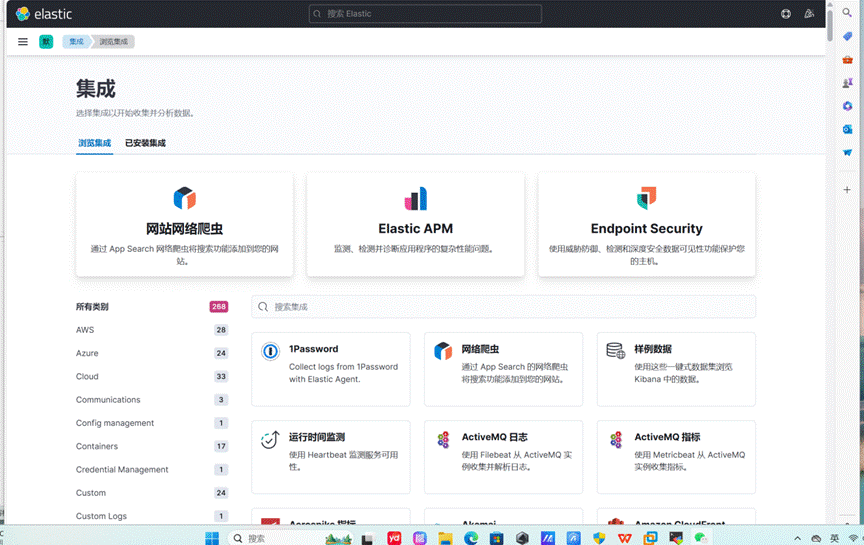
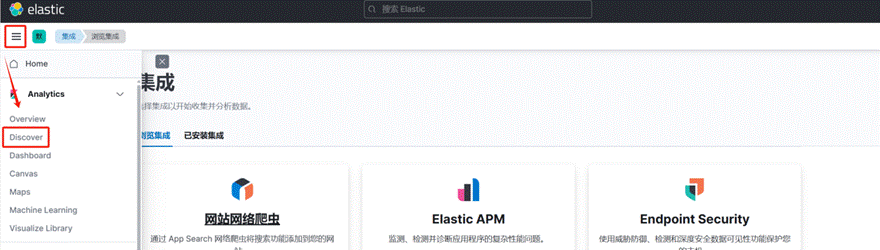
4.4 kibana访问
4.5 编写logstash用于收集日志配置文件
通过filebeat进行收集
[root@logstash ~]# cat /etc/logstash/conf.d/logstash-to-elastic.conf
input {
beats {
host => "0.0.0.0"
port => "5044"
}
}
filter {
}
output {
elasticsearch {
hosts => "192.168.10.14:9200"
index => "k8s-%{+YYYY.MM.dd}"
}
}
4.6 运行logstash
如果不涉及多个配置文件,可以直接使用systemctl start logstash;如果有多个配置文件,只想启动一个配置文件,可以使用如下方法。
4.6.1 直接在后台运行
[root@logstash ~]# /usr/share/logstash/bin/logstash -f /etc/logstash/conf.d/logstash-to-elastic.conf --path.data /usr/share/logstash/data1 &
[root@logstash ~]# netstat -lntp | grep :5044
4.6.2 通过rc.local设置自动后台运行
[root@logstash ~]# cat /etc/rc.d/rc.local
...
/usr/share/logstash/bin/logstash -f /etc/logstash/conf.d/logstash-to-elastic.conf &
查看文件默认权限
[root@logstash ~]# ls -l /etc/rc.d/rc.local
-rw-r--r-- 1 root root 562 1月 9 13:40 /etc/rc.d/rc.local
修改文件权限
[root@logstash ~]# chmod +x /etc/rc.d/rc.local
查看修改后文件权限
[root@logstash ~]# ls -l /etc/rc.d/rc.local
-rwxr-xr-x 1 root root 562 1月 9 13:40 /etc/rc.d/rc.local
五、收集k8s集群节点系统日志
通过在worker节点以DaemonSet方法运行filebeat应用实现
5.1 下载filebeat镜像
所有worker节点
下载filebeat镜像
[root@worker01 ~]# docker pull elastic/filebeat:7.17.2
[root@worker01 ~]# docker images
REPOSITORY TAG IMAGE ID CREATED SIZE
docker.elastic/filebeat 7.17.2 00c5b17745d1 3 weeks ago 359MB
5.2 创建filebeat资源清单文件
[root@master01 ~]# cat filebeat-to-logstash.yaml
apiVersion: v1
kind: ConfigMap
metadata:
name: k8s-logs-filebeat-config
namespace: kube-system
data:
filebeat.yml: |
filebeat.inputs:
- type: log
paths:
- /var/log/messages
fields:
app: k8s
type: module
fields_under_root: true
setup.ilm.enabled: false
setup.template.name: "k8s-module"
setup.template.pattern: "k8s-module-*"
output.logstash:
hosts: ['192.168.10.14:5044']
index: "k8s-module-%{+yyyy.MM.dd}"
---
apiVersion: apps/v1
kind: DaemonSet
metadata:
name: k8s-logs
namespace: kube-system
spec:
selector:
matchLabels:
project: k8s
app: filebeat
template:
metadata:
labels:
project: k8s
app: filebeat
spec:
containers:
- name: filebeat
image: docker.io/elastic/filebeat:7.17.2
args: [
"-c", "/etc/filebeat.yml",
"-e",
]
resources:
requests:
cpu: 100m
memory: 100Mi
limits:
cpu: 500m
memory: 500Mi
securityContext:
runAsUser: 0
volumeMounts:
- name: filebeat-config
mountPath: /etc/filebeat.yml
subPath: filebeat.yml
- name: k8s-logs
mountPath: /var/log/messages
volumes:
- name: k8s-logs
hostPath:
path: /var/log/messages
- name: filebeat-config
configMap:
name: k8s-logs-filebeat-config
5.3 应用filebeat资源清单文件
[root@master01 ~]# kubectl apply -f filebeat-to-logstash.yaml
5.4 验证结果
查看pod
# kubectl get pods -n kube-system -o wide
k8s-logs-8hst5 1/1 Running 0 2m26s 10.244.5.5 worker01 <none> <none>
k8s-logs-f57l5 1/1 Running 0 2m26s 10.244.30.68 worker02 <none> <none>
查看pod输出日志
[root@master01 ~]# kubectl logs k8s-logs-8hst5 -n kube-system
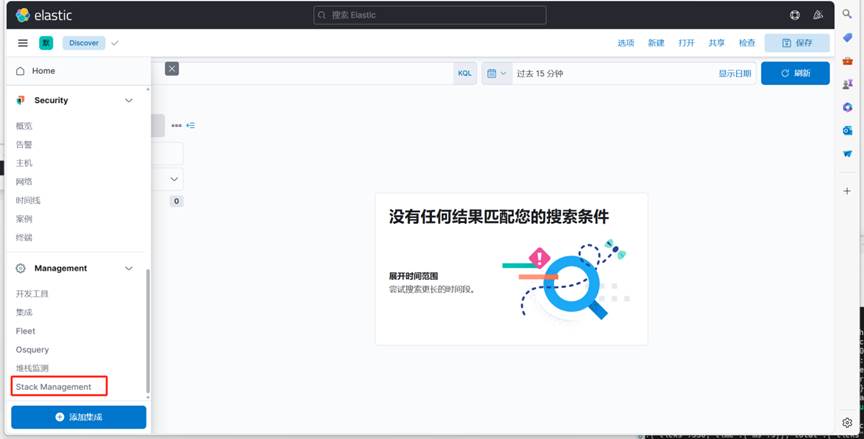
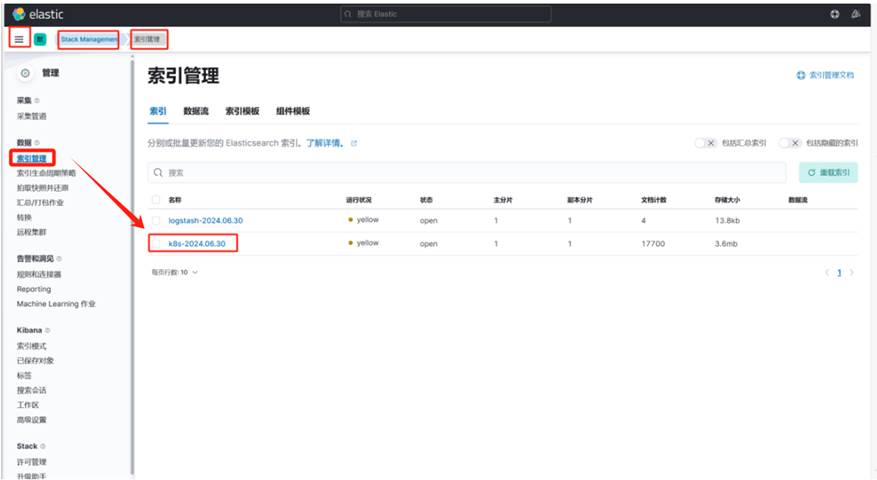
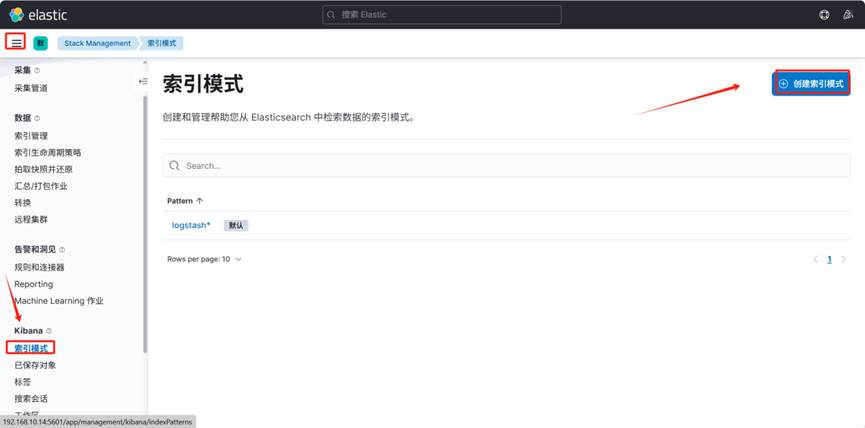
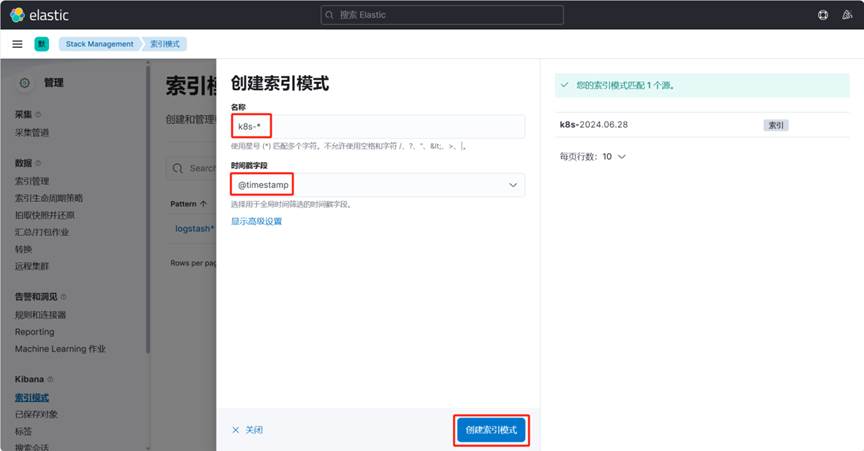
5.5 在kibana中添加索引
Stack Management-->索引管理-->查看到新加的索引
创建索引模式-->
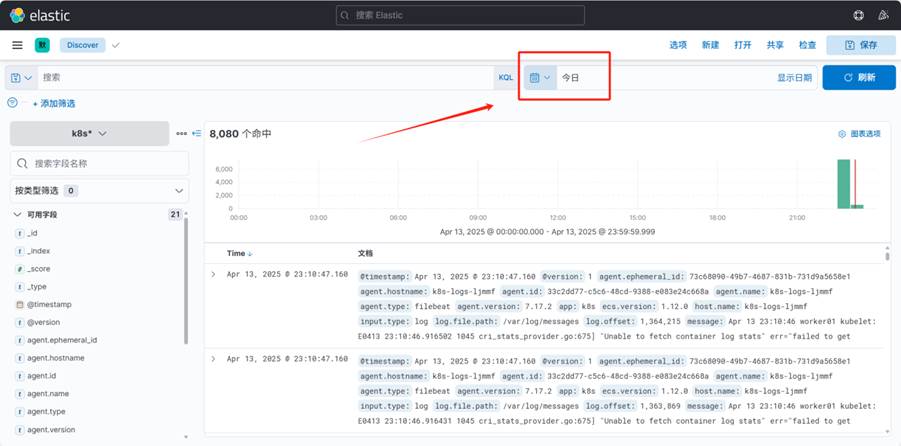
Discover查看
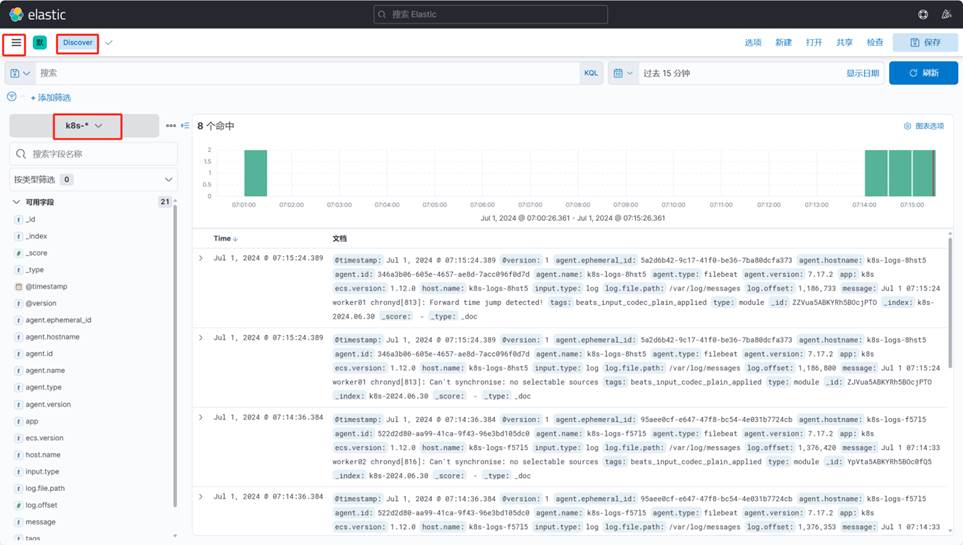
如果不显示数据时,可选择显示更长的时间范围
------------------------------------------------------------
补充: Kibana KQL (Kibana Query Language) 简介
KQL (Kibana Query Language) 是 Kibana 中用于查询和过滤数据的专用查询语言,比 Lucene 查询语法更简单直观。
- 基本查询语法
- 字段查询语法
field:value
例如:
status:200
message:"error occurred"
- 逻辑运算符
- AND (与): `status:200 AND extension:php`
- OR (或): `status:200 OR status:404`
- NOT (非): `NOT status:200`
- 通配符
- `*` 匹配零个或多个字符: `host.name:web-*`
- `?` 匹配单个字符: `host.name:web-srv?`
- 范围查询
bytes >= 1000 AND bytes <= 2000
response_time > 500
- 存在性检查
exists:field_name
- 嵌套字段查询
user.name:john
- 高级功能
- 模糊匹配
message:~"errror" # 会匹配"error"、"errors"等
- 短语搜索
message:"connection timeout"
- 转义特殊字符
message:"error \\[code\\]"
- 正则表达式
host.name:/web-\d+/
- 实际示例
- 查找特定IP的404错误:
client.ip:192.168.1.100 AND status:404
- 查找包含"timeout"或"error"的日志:
message:"timeout" OR message:"error"
- 查找响应时间超过1秒的非200状态请求:
response_time > 1000 AND NOT status:200
- 查找特定时间范围内的日志:
@timestamp >= "2023-01-01T00:00:00" AND @timestamp <= "2023-01-02T00:00:00"
KQL 语法简洁直观,特别适合在 Kibana 的 Discover 和 Dashboard 界面中快速构建查询。
更多推荐
 7
7 0
0- 0


 已为社区贡献8条内容

所有评论(0)