
50万数据点的直线序列图代码示列|体验使用Highcharts Boost模块渲染大数据
·
使用Highcharts Boost模块,可以在客户端渲染大量数据。
这个图表显示了一个包含500,000个数据点的直线序列。这些点代表了1965年以来的每小时数据。
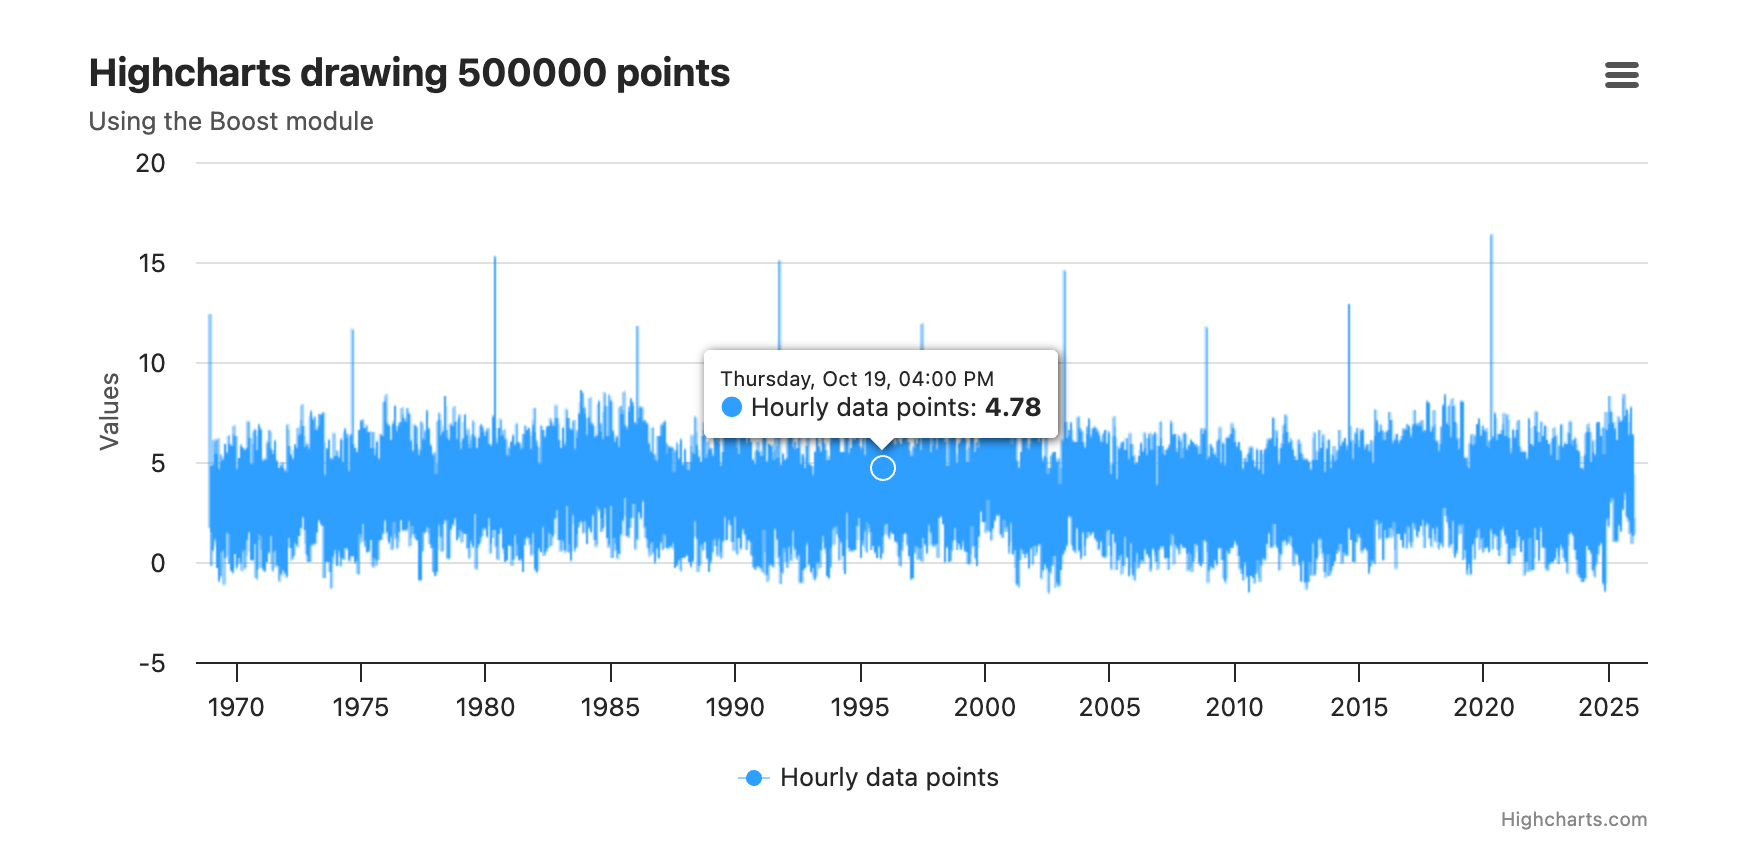
示列代码:
function getData(n) {
    const arr = [];
    let i,
        x,
        a,
        b,
        c,
        spike;
    for (
        i = 0, x = Date.UTC(new Date().getUTCFullYear(), 0, 1) - n * 36e5;
        i < n;
        i = i + 1, x = x + 36e5
    ) {
        if (i % 100 === 0) {
            a = 2 * Math.random();
        }
        if (i % 1000 === 0) {
            b = 2 * Math.random();
        }
        if (i % 10000 === 0) {
            c = 2 * Math.random();
        }
        if (i % 50000 === 0) {
            spike = 10;
        } else {
            spike = 0;
        }
        arr.push([
            x,
            2 * Math.sin(i / 100) + a + b + c + spike + Math.random()
        ]);
    }
    return arr;
}
const n = 500000,
    data = getData(n);


console.time('line');
Highcharts.chart('container', {

    chart: {
        zooming: {
            type: 'x'
        }
    },

    title: {
        text: 'Highcharts drawing ' + n + ' points',
        align: 'left'
    },

    subtitle: {
        text: 'Using the Boost module',
        align: 'left'
    },

    accessibility: {
        screenReaderSection: {
            beforeChartFormat: '<{headingTagName}>' +
                '{chartTitle}</{headingTagName}><div>{chartSubtitle}</div>' +
                '<div>{chartLongdesc}</div><div>{xAxisDescription}</div><div>' +
                '{yAxisDescription}</div>'
        }
    },

    tooltip: {
        valueDecimals: 2
    },

    xAxis: {
        type: 'datetime'
    },

    series: [{
        data: data,
        lineWidth: 0.5,
        name: 'Hourly data points',
        color: '#2caffe'
    }]

});
console.timeEnd('line');
更多推荐
 10
10 0
0- 0



 已为社区贡献38条内容

所有评论(0)