
柱状图(Vue3)
·
二种基础柱状图
效果图:
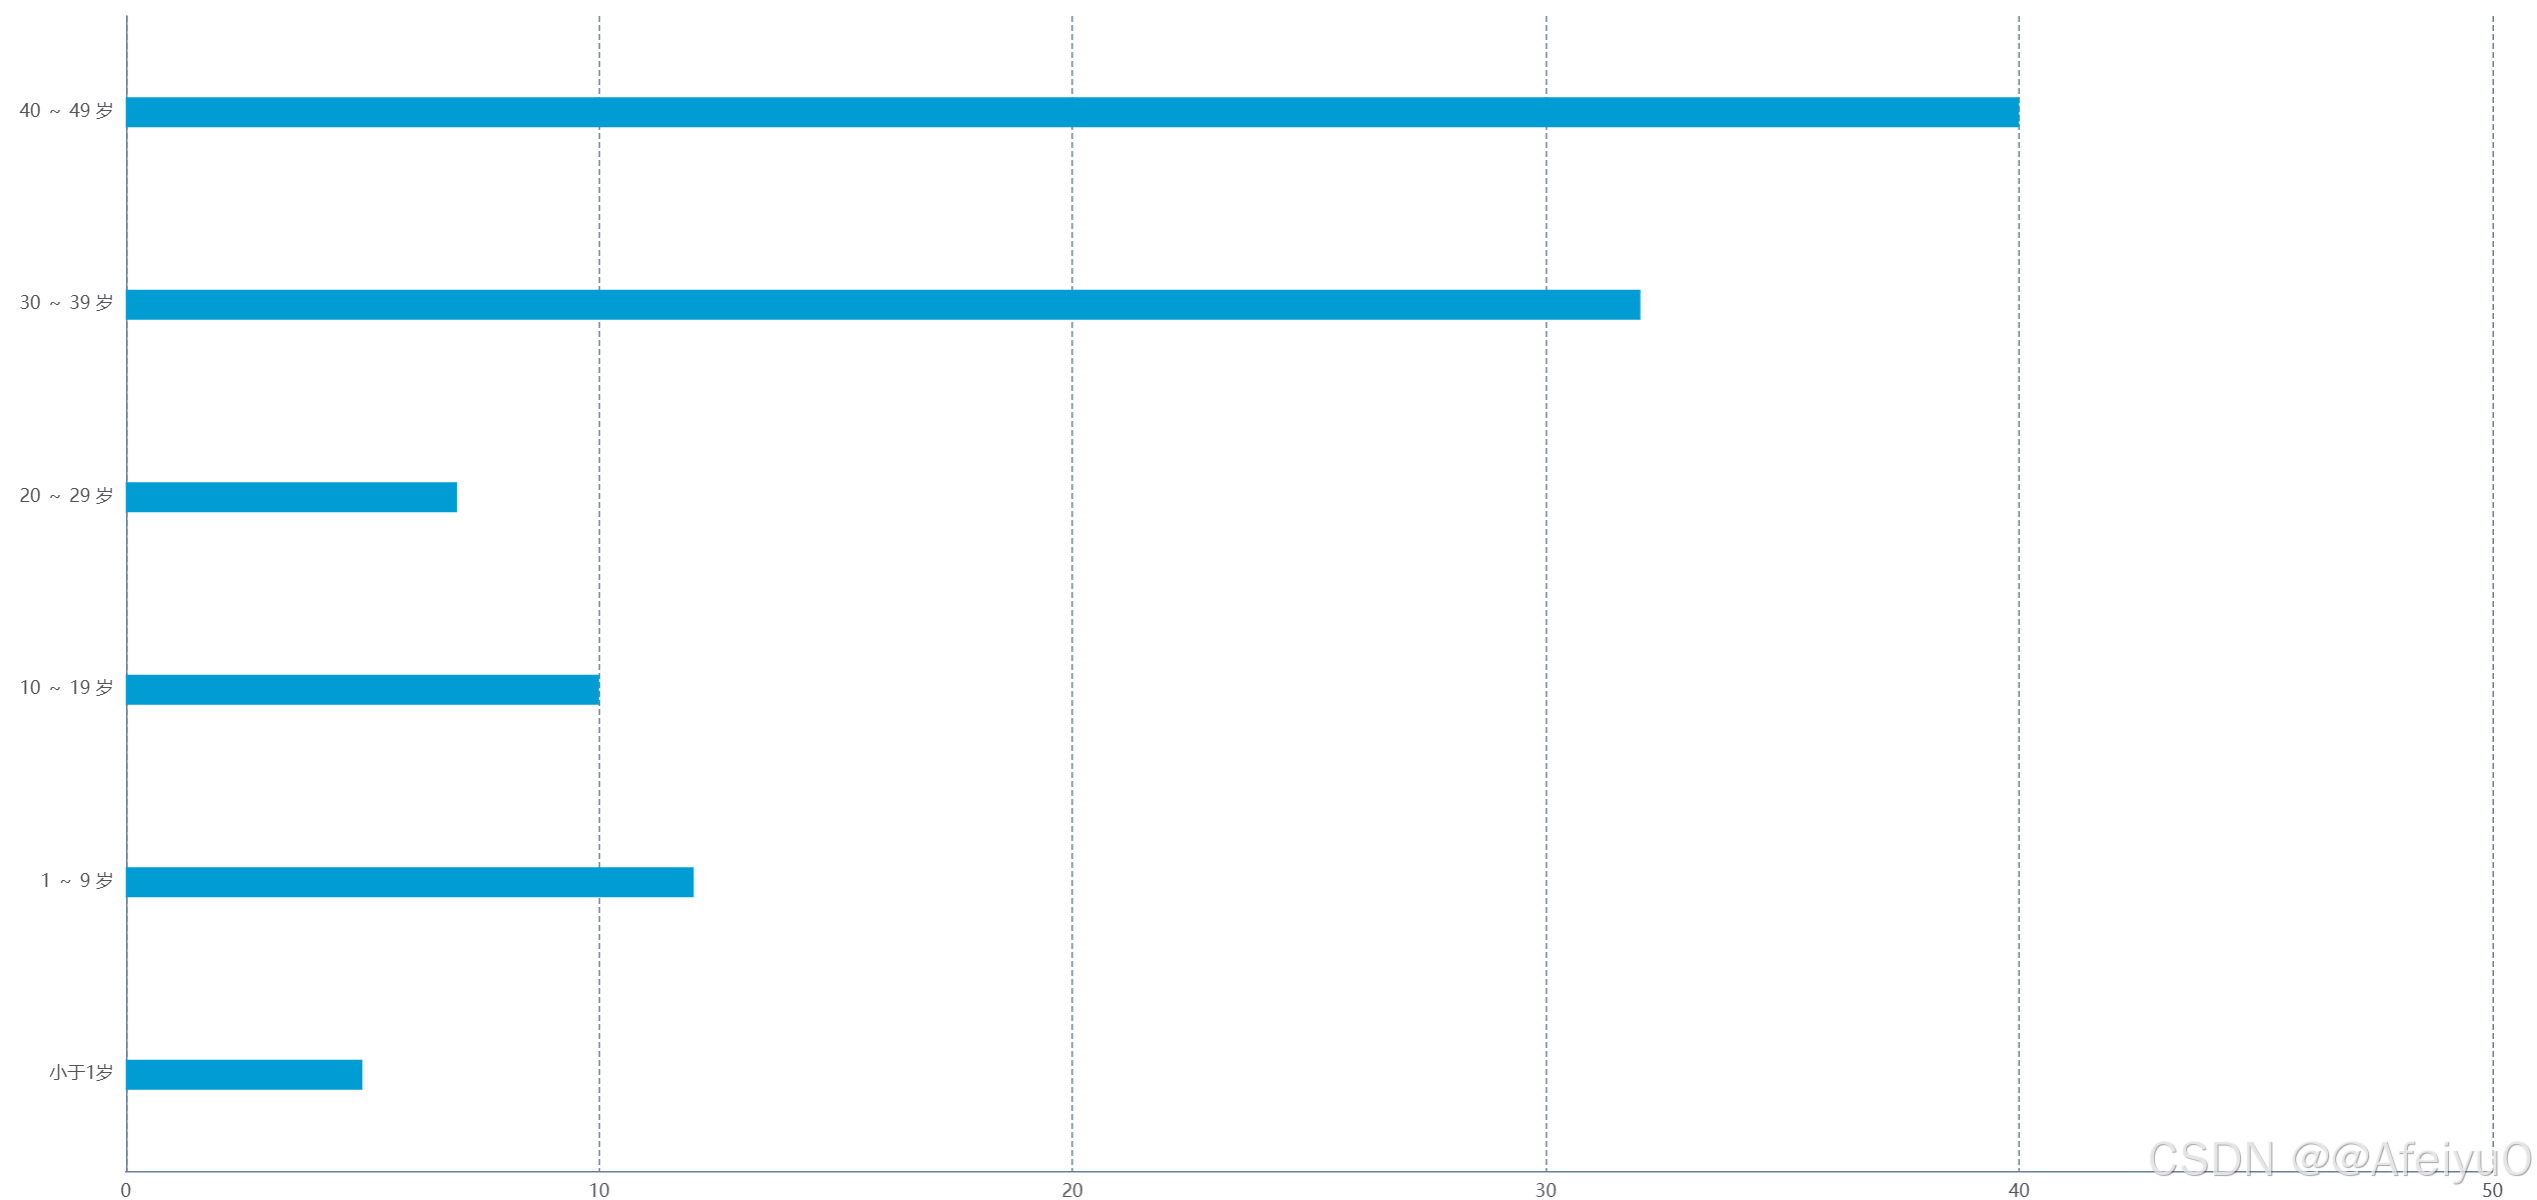
<template>
	<div>
	  <v-chart
		ref="vChartRef"
		:option="option"
		style="width: 100%; height: 800px"
	  />
	</div>
  </template>

  <script setup lang="ts">
  import { ref, computed } from "vue";
  import VChart from "vue-echarts";
  import { use } from "echarts/core";
  import { DatasetComponent } from "echarts/components";
  import { CanvasRenderer } from "echarts/renderers";
  import { BarChart } from "echarts/charts";
  import {
	GridComponent,
	TooltipComponent,
	LegendComponent,
  } from "echarts/components";

  use([
	DatasetComponent,
	CanvasRenderer,
	BarChart,
	GridComponent,
	TooltipComponent,
	LegendComponent,
  ]);

  // 原始数据
  const dataJson = ref([
	{ value: 5, label: "小于1岁" },
	{ value: 12, label: "1 ~ 9 岁" },
	{ value: 10, label: "10 ~ 19 岁" },
	{ value: 7, label: "20 ~ 29 岁" },
	{ value: 32, label: "30 ~ 39 岁" },
	{ value: 40, label: "40 ~ 49 岁" },
  ]);

  // 提取y轴标签数据
  const yAxisData = computed(() => dataJson.value.map(item => item.label));

  // 提取系列数据(仅数值)
  const seriesData = computed(() => dataJson.value.map(item => item.value));

  // 图表配置选项
  const option = computed(() => ({
	grid: {
	  left: 10,
	  right: 20,
	  bottom: 0,
	  top: 10,
	  containLabel: true,
	},
	tooltip: {
	  trigger: "axis",
	  axisPointer: {
		type: "shadow",
	  },
	},
	legend: {},
	xAxis: {
	  type: "value",
	  axisLine: {
		show: true,
		lineStyle: {
		  color: "#6A7F98FF",
		},
	  },
	  splitLine: {
		show: true,
		lineStyle: {
		  color: ["#6A7F98FF"],
		  type: "dashed",
		},
	  },
	  boundaryGap: [0, 0.01],
	},
	yAxis: {
	  type: "category",
	  splitLine: {
		show: false,
	  },
	  axisTick: {
		show: false,
		lineStyle: {
		  color: "#6A7F98FF",
		},
	  },
	  axisLine: {
		show: true,
		lineStyle: {
		  color: "#6A7F98FF",
		},
	  },
	  data: yAxisData.value,
	},
	series: [
	  {
		name: "",
		type: "bar",
		itemStyle: {
		  borderRadius: 0,
		  color: "#029CD4",
		},
		barWidth: 20,
		label: {
		  show: false,
		  fontSize: 12,
		  color: "#fff",
		  position: "top",
		},
		data: seriesData.value,
	  },
	],
  }));

  // 获取图表实例
  const vChartRef = ref();
  </script>
效果图2:
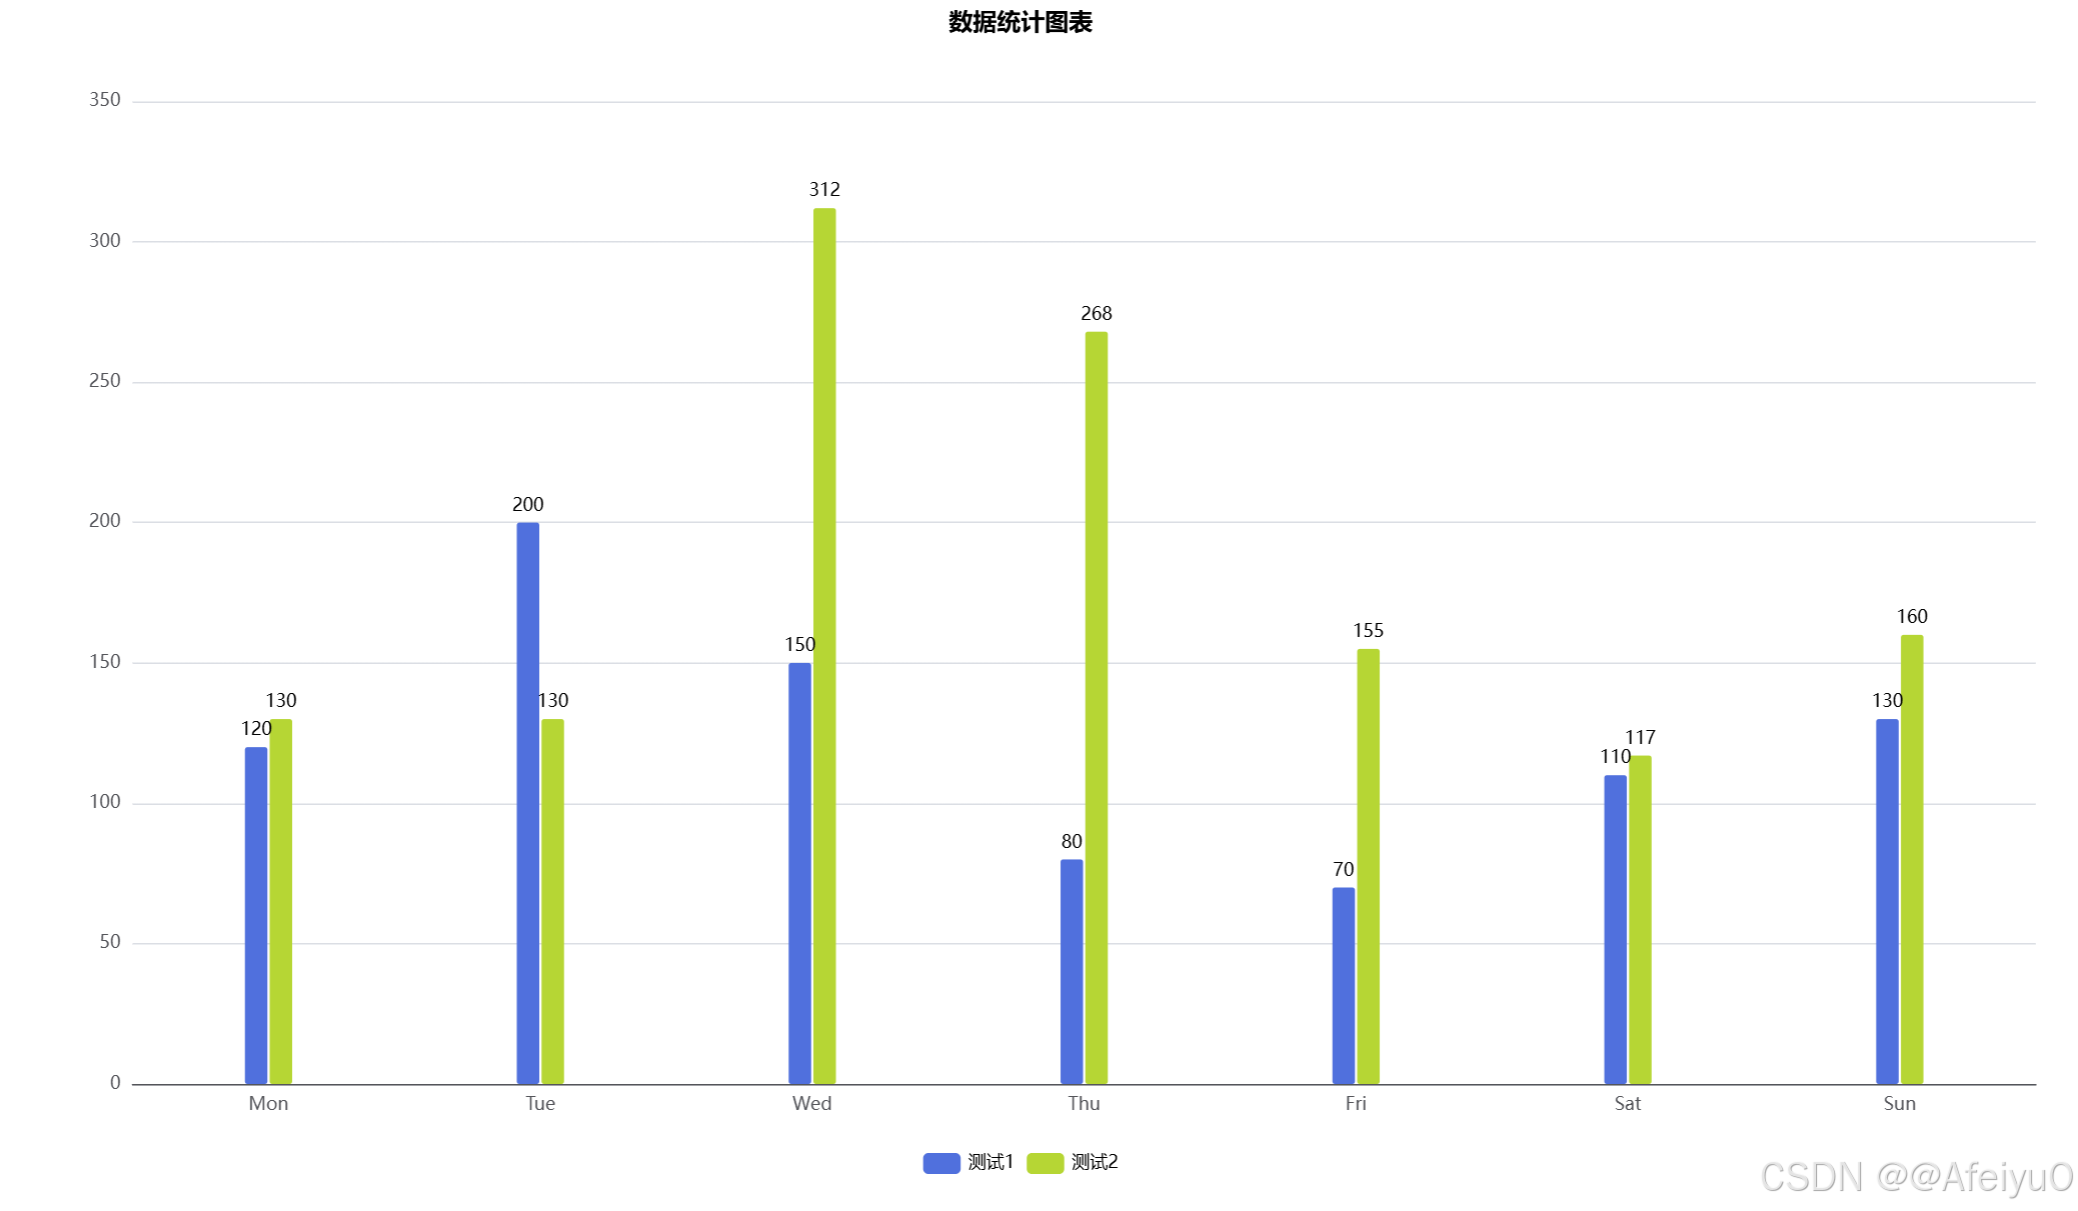
<template>
  <div>
    <v-chart
      ref="vChartRef"
      :option="option"
      style="width: 100%; height: 800px"
    />
  </div>
</template>
<script setup lang="ts">
import { ref, reactive, onMounted } from "vue";
import VChart from "vue-echarts";
import { use } from "echarts/core";
import { CanvasRenderer } from "echarts/renderers";
import { BarChart } from "echarts/charts";
import {
  DatasetComponent,
  GridComponent,
  TooltipComponent,
  LegendComponent,
  TitleComponent,
} from "echarts/components";

use([
  DatasetComponent,
  CanvasRenderer,
  BarChart,
  GridComponent,
  TooltipComponent,
  LegendComponent,
  TitleComponent,
]);

// 模拟接口数据数组
const chartData = ref([
  { x: "Mon", y: 120, s: "测试1" },
  { x: "Tue", y: 200, s: "测试1" },
  { x: "Wed", y: 150, s: "测试1" },
  { x: "Thu", y: 80, s: "测试1" },
  { x: "Fri", y: 70, s: "测试1" },
  { x: "Sat", y: 110, s: "测试1" },
  { x: "Sun", y: 130, s: "测试1" },
  { x: "Mon", y: 130, s: "测试2" },
  { x: "Tue", y: 130, s: "测试2" },
  { x: "Wed", y: 312, s: "测试2" },
  { x: "Thu", y: 268, s: "测试2" },
  { x: "Fri", y: 155, s: "测试2" },
  { x: "Sat", y: 117, s: "测试2" },
  { x: "Sun", y: 160, s: "测试2" },
]);

// 获取图表实例
const vChartRef = ref();

// 获取series
const seriesItem = ref({
  type: "bar",
  barWidth: 15,
  name: "",
  label: {
    show: true,
    position: "top",
    color: "#000",
    fontSize: 12,
  },
  itemStyle: {
    borderRadius: 2,
    color: null,
  },
  data: [],
});

const getSeries = () => {
  const seriesNames = [...new Set(chartData.value.map((item) => item.s))];
  const xValues = [...new Set(chartData.value.map((item) => item.x))];

  const series = seriesNames.map((name) => {
    const seriesItemCopy = JSON.parse(JSON.stringify(seriesItem.value));
    seriesItemCopy.name = name;

    const seriesData = new Array(xValues.length).fill(null);

    chartData.value.forEach((item) => {
      if (item.s === name) {
        const index = xValues.indexOf(item.x);
        if (index !== -1) {
          seriesData[index] = item.y;
        }
      }
    });

    seriesItemCopy.data = seriesData;
    return seriesItemCopy;
  });

  return { series, xValues };
};

const option = reactive({
  tooltip: {
    trigger: "axis",
    backgroundColor: "transparent",
    borderWidth: 0,
    padding: 0,
  },
  title: {
    show: true,
    text: "数据统计图表",
    subtext: "",
    left: "center",
    top: "0",
    right: "0",
    bottom: "0",
    textStyle: {
      color: "#000",
      fontSize: 16,
    },
    subtextStyle: {
      color: "#eee",
      fontSize: 14,
    },
  },
  legend: {
    show: true,
    textStyle: {
      color: "#000",
    },
  },
  xAxis: [
    {
      type: "category",
      data: <any>[],
    },
  ],
  yAxis: [
    {
      type: "value",
    },
  ],
  series: <any>[],
});
console.log('option',option)
onMounted(() => {
  const { series, xValues } = getSeries();
  option.series = series;
  option.xAxis[0].data = xValues;
});
</script>
更多推荐
 2
2 0
0- 0


 已为社区贡献3条内容

所有评论(0)